Shareholder Report
May 31, 2025
USD ($)
Holding
columbiathreadneedleus.com/resources/literature
. You can also request more information by contacting us at 1-800-345-6611.
What were the Fund costs for the reporting period?
(Based on a hypothetical $10,000 investment)
| Class | Cost of a $10,000 investment | Cost paid as a percentage of a $10,000 investment |
| Class A | $ 93 | 0.89 % |
Management's Discussion of Fund Performance
The performance of Class A shares for the period presented is shown in the Average Annual Total Returns table.
Top Performance Contributors
Interest rate positioning
| The Fund’s positioning with respect to interest rates contributed most to relative and absolute outperformance. Specifically, the Fund had an above-benchmark stance with respect to duration and corresponding interest rate sensitivity as short- and intermediate-term U.S. Treasury yields moved lower over the period. The Fund’s rate positioning also benefitted from a steepening yield curve over the period. Agency residential mortgage-backed securities
| Performance for the Fund’s agency passthrough and collateralized mortgage obligation (CMO) holdings gained against a backdrop of falling interest rates and a steepening yield curve.Non-agency residential mortgage-backed securities
| Non-agency residential mortgage-backed securities drove relative (the benchmark does not hold these securities) and absolute outperformance as housing fundamentals remained strong and borrower delinquencies remained low.Top Performance Detractors
There were no material detractors to Fund performance during the period.
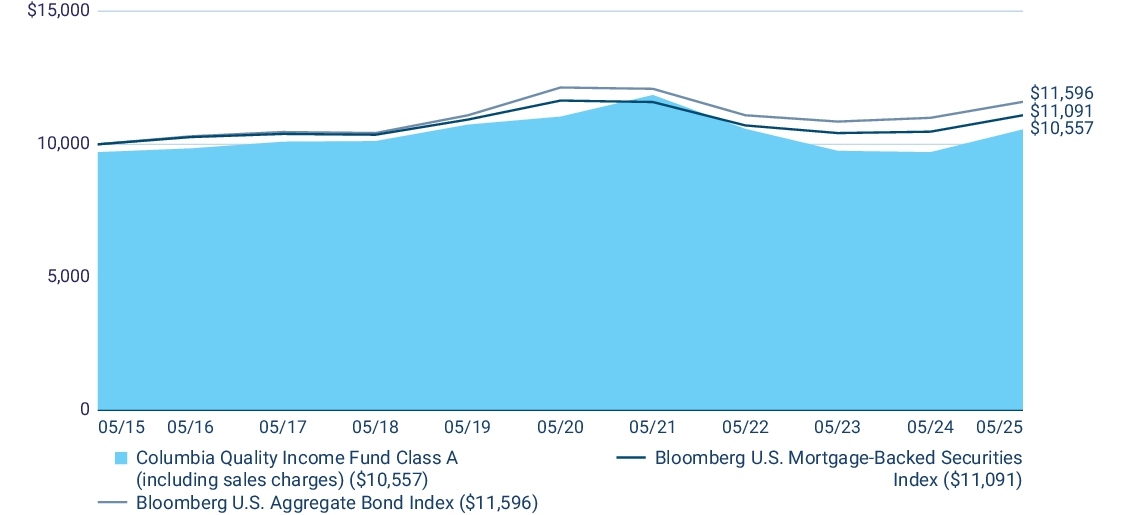
| Average Annual Total Returns (%) | 1 year | 5 years | 10 years |
| Class A (excluding sales charges) | 8.81 | (0.89 ) | 0.85 |
| Class A (including sales charges) | 5.54 | (1.49 ) | 0.54 |
| Bloomberg U.S. Mortgage-Backed Securities Index | 5.88 | (0.97 ) | 1.04 |
| Bloomberg U.S. Aggregate Bond Index | 5.46 | (0.90 ) | 1.49 |
columbiathreadneedleus.com/investment-products/mutual-funds
for more recent performance information.
Key Fund Statistics
Fund net assets | $ 1,274,068,619 |
Total number of portfolio holdings | 339 |
Management services fees (represents 0.49% of Fund average net assets) | $ 6,652,421 |
Portfolio turnover for the reporting period | 330% |
Portfolio turnover for the reporting period excluding to be announced (TBA) securities | 17% |
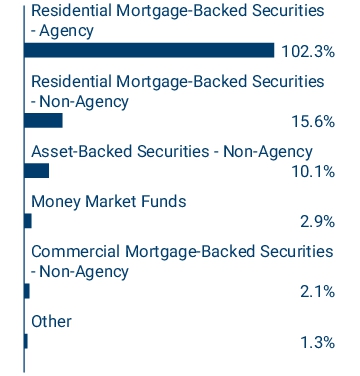
Graphical Representation of Fund Holdings
The tables below show the investment m
ak
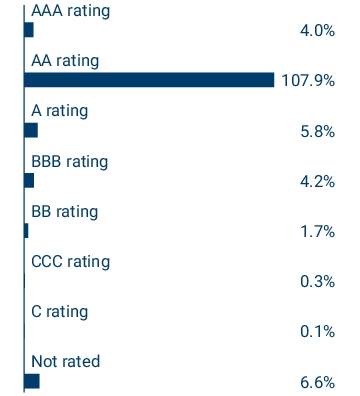
eup of the Fund represented as a percentage of Fund net assets. Derivatives are excluded from the tables unless otherwise noted. The Fund's portfolio composition is subject to change.Bond ratings on Fund holdings are divided into categories ranging from highest to lowest credit quality, determined by using the middle rating of Moody’s Ratings, S&P and Fitch, after dropping the highest and lowest available ratings. When ratings are available from only two rating agencies, the lower rating is used. When a rating is available from only one rating agency, that rating is used. If a security is not rated by Moody's Ratings, S&P or Fitch, but has a rating by Kroll and/or DBRS, the same methodology is applied to those bonds that would otherwise be not rated. When a bond is not rated by any rating agency, it is designated as “Not rated.” Credit quality ratings assigned by a rating agency are subjective opinions, not statements of fact, and are subject to change, including daily.
Top Holdings
| Uniform Mortgage-Backed Security TBA 06/13/2054 4.500% | 8.2 % |
| Uniform Mortgage-Backed Security TBA 06/12/2055 3.500% | 7.9 % |
| Government National Mortgage Association TBA 06/20/2054 4.500% | 4.8 % |
| Government National Mortgage Association 05/20/2051 2.500% | 2.7 % |
| Uniform Mortgage-Backed Security TBA 06/18/2040 3.000% | 2.7 % |
| Federal National Mortgage Association 08/01/2052 4.000% | 2.3 % |
| Uniform Mortgage-Backed Security TBA 06/13/2054 3.000% | 1.9 % |
| Federal National Mortgage Association 11/01/2052 4.500% | 1.8 % |
| Uniform Mortgage-Backed Security TBA 06/13/2054 2.000% | 1.8 % |
| Federal Home Loan Mortgage Corp. 08/01/2052 3.000% | 1.6 % |
Asset Categories

Credit Quality

Top Holdings
| Uniform Mortgage-Backed Security TBA 06/13/2054 4.500% | 8.2 % |
| Uniform Mortgage-Backed Security TBA 06/12/2055 3.500% | 7.9 % |
| Government National Mortgage Association TBA 06/20/2054 4.500% | 4.8 % |
| Government National Mortgage Association 05/20/2051 2.500% | 2.7 % |
| Uniform Mortgage-Backed Security TBA 06/18/2040 3.000% | 2.7 % |
| Federal National Mortgage Association 08/01/2052 4.000% | 2.3 % |
| Uniform Mortgage-Backed Security TBA 06/13/2054 3.000% | 1.9 % |
| Federal National Mortgage Association 11/01/2052 4.500% | 1.8 % |
| Uniform Mortgage-Backed Security TBA 06/13/2054 2.000% | 1.8 % |
| Federal Home Loan Mortgage Corp. 08/01/2052 3.000% | 1.6 % |
columbiathreadneedleus.com/resources/literature
. You can also request more information by contacting us at 1-800-345-6611.
What were the Fund costs for the reporting period?
(Based on a hypothetical $10,000 investment)
| Class | Cost of a $10,000 investment | Cost paid as a percentage of a $10,000 investment |
| Class C | $ 170 | 1.64 % |
Management's Discussion of Fund Performance
The performance of Class C shares for the period presented is shown in the Average Annual Total Returns table.
Top Performance Contributors
Interest rate positioning
| The Fund’s positioning with respect to interest rates contributed most to relative and absolute outperformance. Specifically, the Fund had an above-benchmark stance with respect to duration and corresponding interest rate sensitivity as short- and intermediate-term U.S. Treasury yields moved lower over the period. The Fund’s rate positioning also benefitted from a steepening yield curve over the period. Agency residential mortgage-backed securities
| Performance for the Fund’s agency passthrough and collateralized mortgage obligation (CMO) holdings gained against a backdrop of falling interest rates and a steepening yield curve.Non-agency residential mortgage-backed securities
| Non-agency residential mortgage-backed securities drove relative (the benchmark does not hold these securities) and absolute outperformance as housing fundamentals remained strong and borrower delinquencies remained low.Top Performance Detractors
There were no material detractors to Fund performance during the period.
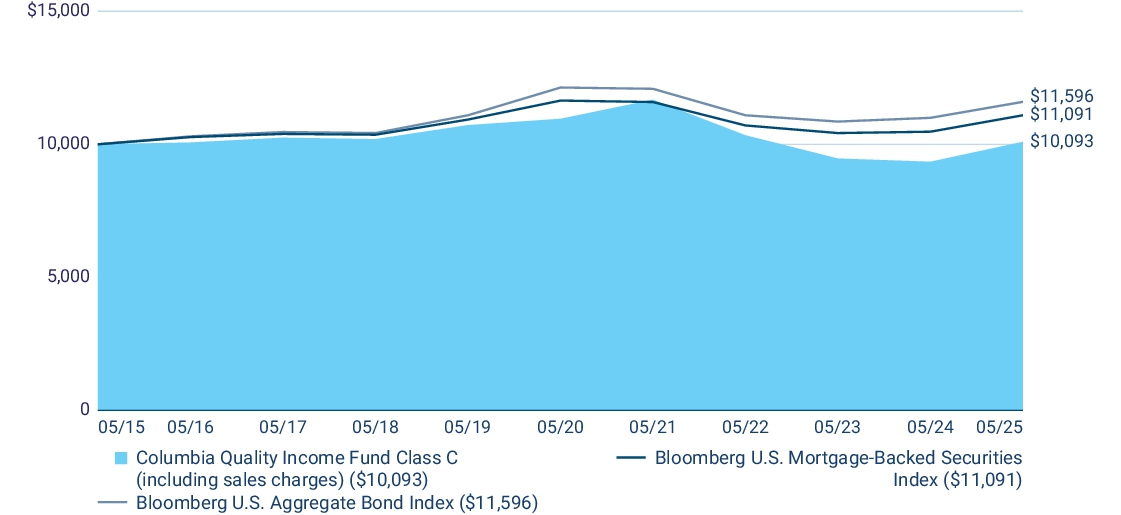
| Average Annual Total Returns (%) | 1 year | 5 years | 10 years |
| Class C (excluding sales charges) | 7.99 | (1.63 ) | 0.09 |
| Class C (including sales charges) | 6.99 | (1.63 ) | 0.09 |
| Bloomberg U.S. Mortgage-Backed Securities Index | 5.88 | (0.97 ) | 1.04 |
| Bloomberg U.S. Aggregate Bond Index | 5.46 | (0.90 ) | 1.49 |
columbiathreadneedleus.com/investment-products/mutual-funds
for more recent performance information.
Key Fund Statistics
Fund net assets | $ 1,274,068,619 |
Total number of portfolio holdings | 339 |
Management services fees (represents 0.49% of Fund average net assets) | $ 6,652,421 |
Portfolio turnover for the reporting period | 330% |
Portfolio turnover for the reporting period excluding to be announced (TBA) securities | 17% |
Graphical Representation of Fund Holdings
The tables below show the investment makeup of the Fund represented as a percentage of Fund net assets. Derivatives are excluded from the tables unless otherwise noted. The Fund's portfolio composition is subject to change.
Bond ratings on Fund holdings are divided into categories ranging from highest to lowest credit quality, determined by using the middle rating of Moody’s Ratings, S&P and Fitch, after dropping the highest and lowest available ratings. When ratings are available from only two rating agencies, the lower rating is used. When a rating is available from only one rating agency, that rating is used. If a security is not rated by Moody's Ratings, S&P or Fitch, but has a rating by Kroll and/or DBRS, the same methodology is applied to those bonds that would otherwise be not rated. When a bond is not rated by any rating agency, it is designated as “Not rated.” Credit quality ratings assigned by a rating agency are subjective opinions, not statements of fact, and are subject to change, including daily.
Top Holdings
| Uniform Mortgage-Backed Security TBA 06/13/2054 4.500% | 8.2 % |
| Uniform Mortgage-Backed Security TBA 06/12/2055 3.500% | 7.9 % |
| Government National Mortgage Association TBA 06/20/2054 4.500% | 4.8 % |
| Government National Mortgage Association 05/20/2051 2.500% | 2.7 % |
| Uniform Mortgage-Backed Security TBA 06/18/2040 3.000% | 2.7 % |
| Federal National Mortgage Association 08/01/2052 4.000% | 2.3 % |
| Uniform Mortgage-Backed Security TBA 06/13/2054 3.000% | 1.9 % |
| Federal National Mortgage Association 11/01/2052 4.500% | 1.8 % |
| Uniform Mortgage-Backed Security TBA 06/13/2054 2.000% | 1.8 % |
| Federal Home Loan Mortgage Corp. 08/01/2052 3.000% | 1.6 % |
Asset Categories

Credit Quality

Top Holdings
| Uniform Mortgage-Backed Security TBA 06/13/2054 4.500% | 8.2 % |
| Uniform Mortgage-Backed Security TBA 06/12/2055 3.500% | 7.9 % |
| Government National Mortgage Association TBA 06/20/2054 4.500% | 4.8 % |
| Government National Mortgage Association 05/20/2051 2.500% | 2.7 % |
| Uniform Mortgage-Backed Security TBA 06/18/2040 3.000% | 2.7 % |
| Federal National Mortgage Association 08/01/2052 4.000% | 2.3 % |
| Uniform Mortgage-Backed Security TBA 06/13/2054 3.000% | 1.9 % |
| Federal National Mortgage Association 11/01/2052 4.500% | 1.8 % |
| Uniform Mortgage-Backed Security TBA 06/13/2054 2.000% | 1.8 % |
| Federal Home Loan Mortgage Corp. 08/01/2052 3.000% | 1.6 % |
columbiathreadneedleus.com/resources/literature
. You can also request more information by contacting us at 1-800-345-6611.
What were the Fund costs for the reporting period?
(Based on a hypothetical $10,000 investment)
| Class | Cost of a $10,000 investment | Cost paid as a percentage of a $10,000 investment |
| Institutional Class | $ 67 | 0.64 % |
Management's Discussion of Fund Performance
The performance of Institutional Class shares for the period presented is shown in the Average Annual Total Returns table.
Top Performance Contributors
Interest rate positioning
| The Fund’s positioning with respect to interest rates contributed most to relative and absolute outperformance. Specifically, the Fund had an above-benchmark stance with respect to duration and corresponding interest rate sensitivity as short- and intermediate-term U.S. Treasury yields moved lower over the period. The Fund’s rate positioning also benefitted from a steepening yield curve over the period. Agency residential mortgage-backed securities
| Performance for the Fund’s agency passthrough and collateralized mortgage obligation (CMO) holdings gained against a backdrop of falling interest rates and a steepening yield curve.Non-agency residential mortgage-backed securities
| Non-agency residential mortgage-backed securities drove relative (the benchmark does not hold these securities) and absolute outperformance as housing fundamentals remained strong and borrower delinquencies remained low.Top Performance Detractors
There were no material detractors to Fund performance during the period.
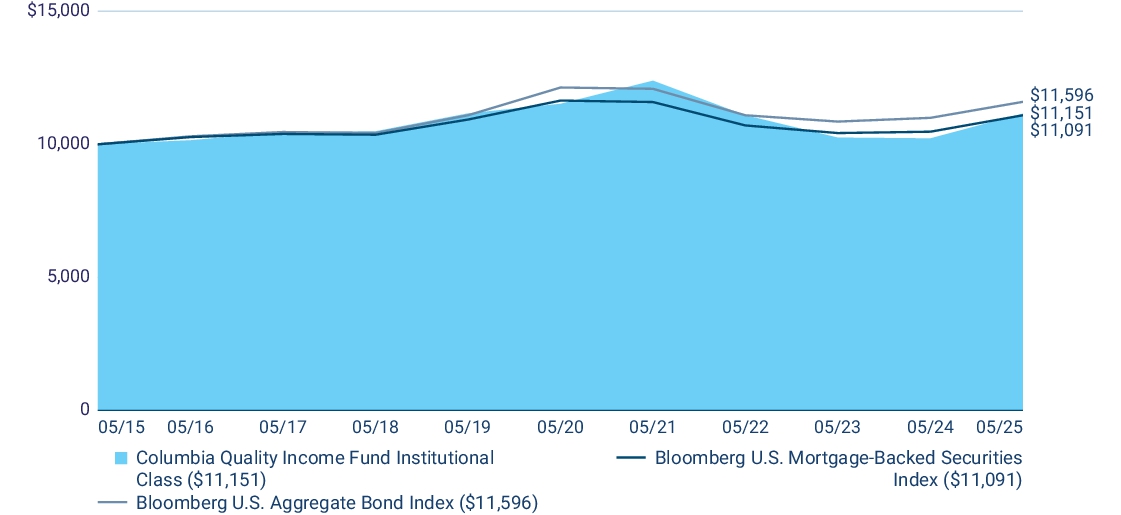
| Average Annual Total Returns (%) | 1 year | 5 years | 10 years |
| Institutional Class | 9.08 | (0.65 ) | 1.10 |
| Bloomberg U.S. Mortgage-Backed Securities Index | 5.88 | (0.97 ) | 1.04 |
| Bloomberg U.S. Aggregate Bond Index | 5.46 | (0.90 ) | 1.49 |
columbiathreadneedleus.com/investment-products/mutual-funds
for more recent performance information.
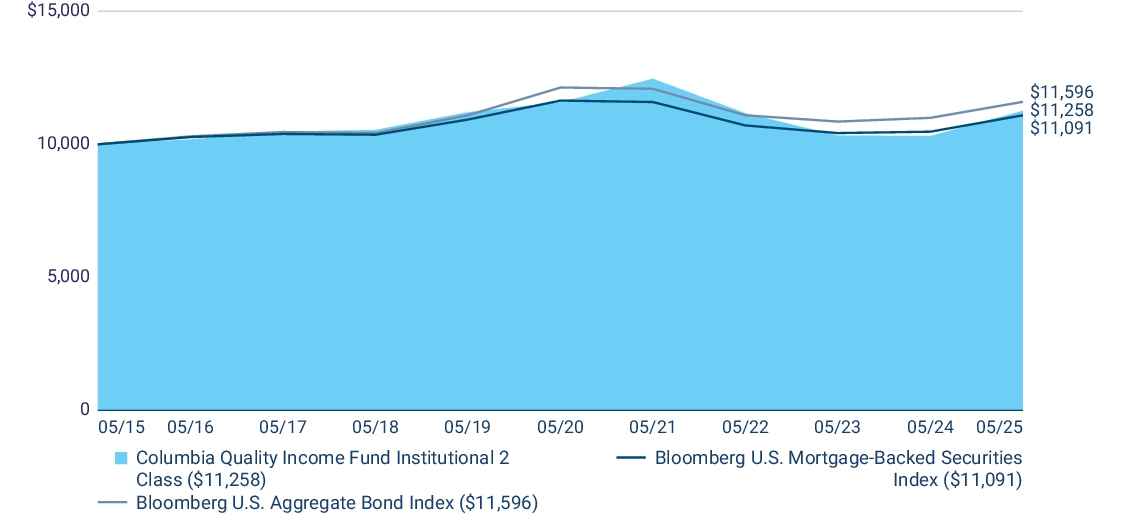
Key Fund Statistics
Fund net assets | $ 1,274,068,619 |
Total number of portfolio holdings | 339 |
Management services fees (represents 0.49% of Fund average net assets) | $ 6,652,421 |
Portfolio turnover for the reporting period | 330% |
Portfolio turnover for the reporting period excluding to be announced (TBA) securities | 17% |
Graphical Representation of Fund Holdings
The tables below show the investment makeup of the Fund represented as a percentage of Fund net assets. Derivatives are excluded from the tables unless otherwise noted. The Fund's portfolio composition is subject to change.
Bond ratings on Fund holdings are divided into categories ranging from highest to lowest credit quality, determined by using the middle rating of Moody’s Ratings, S&P and Fitch, after dropping the highest and lowest available ratings. When ratings are available from only two rating agencies, the lower rating is used. When a rating is available from only one rating agency, that rating is used. If a security is not rated by Moody's Ratings, S&P or Fitch, but has a rating by Kroll and/or DBRS, the same methodology is applied to those bonds that would otherwise be not rated. When a bond is not rated by any rating agency, it is designated as “Not rated.” Credit quality ratings assigned by a rating agency are subjective opinions, not statements of fact, and are subject to change, including daily.
Top Holdings
| Uniform Mortgage-Backed Security TBA 06/13/2054 4.500% | 8.2 % |
| Uniform Mortgage-Backed Security TBA 06/12/2055 3.500% | 7.9 % |
| Government National Mortgage Association TBA 06/20/2054 4.500% | 4.8 % |
| Government National Mortgage Association 05/20/2051 2.500% | 2.7 % |
| Uniform Mortgage-Backed Security TBA 06/18/2040 3.000% | 2.7 % |
| Federal National Mortgage Association 08/01/2052 4.000% | 2.3 % |
| Uniform Mortgage-Backed Security TBA 06/13/2054 3.000% | 1.9 % |
| Federal National Mortgage Association 11/01/2052 4.500% | 1.8 % |
| Uniform Mortgage-Backed Security TBA 06/13/2054 2.000% | 1.8 % |
| Federal Home Loan Mortgage Corp. 08/01/2052 3.000% | 1.6 % |
Asset Categories
Credit Quality
Top Holdings
| Uniform Mortgage-Backed Security TBA 06/13/2054 4.500% | 8.2 % |
| Uniform Mortgage-Backed Security TBA 06/12/2055 3.500% | 7.9 % |
| Government National Mortgage Association TBA 06/20/2054 4.500% | 4.8 % |
| Government National Mortgage Association 05/20/2051 2.500% | 2.7 % |
| Uniform Mortgage-Backed Security TBA 06/18/2040 3.000% | 2.7 % |
| Federal National Mortgage Association 08/01/2052 4.000% | 2.3 % |
| Uniform Mortgage-Backed Security TBA 06/13/2054 3.000% | 1.9 % |
| Federal National Mortgage Association 11/01/2052 4.500% | 1.8 % |
| Uniform Mortgage-Backed Security TBA 06/13/2054 2.000% | 1.8 % |
| Federal Home Loan Mortgage Corp. 08/01/2052 3.000% | 1.6 % |
columbiathreadneedleus.com/resources/literature
. You can also request more information by contacting us at 1-800-345-6611.
What were the Fund costs for the reporting period?
(Based on a hypothetical $10,000 investment)
| Class | Cost of a $10,000 investment | Cost paid as a percentage of a $10,000 investment |
| Institutional 2 Class | $ 57 |
0.55 % |
Management's Discussion of Fund Performance
The performance of Institutional 2 Class shares for the period presented is shown in the Average Annual Total Returns table.
Top Performance Contributors
Interest rate positioning
| The Fund’s positioning with respect to interest rates contributed most to relative and absolute outperformance. Specifically, the Fund had an above-benchmark stance with respect to duration and corresponding interest rate sensitivity as short- and intermediate-term U.S. Treasury yields moved lower over the period. The Fund’s rate positioning also benefitted from a steepening yield curve over the period. Agency residential mortgage-backed securities
| Performance for the Fund’s agency passthrough and collateralized mortgage obligation (CMO) holdings gained against a backdrop of falling interest rates and a steepening yield curve.Non-agency residential mortgage-backed securities
| Non-agency residential mortgage-backed securities drove relative (the benchmark does not hold these securities) and absolute outperformance as housing fundamentals remained strong and borrower delinquencies remained low.Top Performance Detractors
There were no material detractors to Fund performance during the period.
| Average Annual Total Returns (%) | 1 year | 5 years | 10 years |
| Institutional 2 Class | 9.18 | (0.56 ) |
1.19 |
| Bloomberg U.S. Mortgage-Backed Securities Index | 5.88 | (0.97 ) |
1.04 |
| Bloomberg U.S. Aggregate Bond Index | 5.46 | (0.90 ) |
1.49 |
columbiathreadneedleus.com/investment-products/mutual-funds
for more recent performance information.
Key Fund Statistics
Fund net assets |
$ 1,274,068,619 |
Total number of portfolio holdings |
339 |
Management services fees (represents 0.49% of Fund average net assets) |
$ 6,652,421 |
Portfolio turnover for the reporting period |
330% |
Portfolio turnover for the reporting period excluding to be announced (TBA) securities |
17% |
Graphical Representation of Fund Holdings
The tables below show the investment makeup of the Fund represented as a percentage of Fund net assets. Derivatives are excluded from the tables unless otherwise noted. The Fund's portfolio composition is subject to change.
Bond ratings on Fund holdings are divided into categories ranging from highest to lowest credit quality, determined by using the middle rating of Moody’s Ratings, S&P and Fitch, after dropping the highest and lowest available ratings. When ratings are available from only two rating agencies, the lower rating is used. When a rating is available from only one rating agency, that rating is used. If a security is not rated by Moody's Ratings, S&P or Fitch, but has a rating by Kroll and/or DBRS, the same methodology is applied to those bonds that would otherwise be not rated. When a bond is not rated by any rating agency, it is designated as “Not rated.” Credit quality ratings assigned by a rating agency are subjective opinions, not statements of fact, and are subject to change, including daily.
Top Holdings
| Uniform Mortgage-Backed Security TBA 06/13/2054 4.500% |
8.2 % |
| Uniform Mortgage-Backed Security TBA 06/12/2055 3.500% |
7.9 % |
| Government National Mortgage Association TBA 06/20/2054 4.500% |
4.8 % |
| Government National Mortgage Association 05/20/2051 2.500% |
2.7 % |
| Uniform Mortgage-Backed Security TBA 06/18/2040 3.000% |
2.7 % |
| Federal National Mortgage Association 08/01/2052 4.000% |
2.3 % |
| Uniform Mortgage-Backed Security TBA 06/13/2054 3.000% |
1.9 % |
| Federal National Mortgage Association 11/01/2052 4.500% |
1.8 % |
| Uniform Mortgage-Backed Security TBA 06/13/2054 2.000% |
1.8 % |
| Federal Home Loan Mortgage Corp. 08/01/2052 3.000% |
1.6 % |
Asset Categories

Credit Quality

Top Holdings
| Uniform Mortgage-Backed Security TBA 06/13/2054 4.500% |
8.2 % |
| Uniform Mortgage-Backed Security TBA 06/12/2055 3.500% |
7.9 % |
| Government National Mortgage Association TBA 06/20/2054 4.500% |
4.8 % |
| Government National Mortgage Association 05/20/2051 2.500% |
2.7 % |
| Uniform Mortgage-Backed Security TBA 06/18/2040 3.000% |
2.7 % |
| Federal National Mortgage Association 08/01/2052 4.000% |
2.3 % |
| Uniform Mortgage-Backed Security TBA 06/13/2054 3.000% |
1.9 % |
| Federal National Mortgage Association 11/01/2052 4.500% |
1.8 % |
| Uniform Mortgage-Backed Security TBA 06/13/2054 2.000% |
1.8 % |
| Federal Home Loan Mortgage Corp. 08/01/2052 3.000% |
1.6 % |
columbiathreadneedleus.com/resources/literature
. You can also request more information by contacting us at 1-800-345-6611.
What were the Fund costs for the reporting period?
(Based on a hypothetical $10,000 investment)
| Class | Cost of a $10,000 investment | Cost paid as a percentage of a $10,000 investment |
| Institutional 3 Class | $ 52 |
0.50 % |
Management's Discussion of Fund Performance
The performance of Institutional 3 Class shares for the period presented is shown in the Average Annual Total Returns table.
Top Performance Contributors
Interest rate positioning
| The Fund’s positioning with respect to interest rates contributed most to relative and absolute outperformance. Specifically, the Fund had an above-benchmark stance with respect to duration and corresponding interest rate sensitivity as short- and intermediate-term U.S. Treasury yields moved lower over the period. The Fund’s rate positioning also benefitted from a steepening yield curve over the period. Agency residential mortgage-backed securities
| Performance for the Fund’s agency passthrough and collateralized mortgage obligation (CMO) holdings gained against a backdrop of falling interest rates and a steepening yield curve.Non-agency residential mortgage-backed securities
| Non-agency residential mortgage-backed securities drove relative (the benchmark does not hold these securities) and absolute outperformance as housing fundamentals remained strong and borrower delinquencies remained low.Top Performance Detractors
There were no material detractors to Fund performance during the period.
| Average Annual Total Returns (%) | 1 year | 5 years | 10 years |
| Institutional 3 Class | 9.25 | (0.52 ) |
1.26 |
| Bloomberg U.S. Mortgage-Backed Securities Index | 5.88 | (0.97 ) |
1.04 |
| Bloomberg U.S. Aggregate Bond Index | 5.46 | (0.90 ) |
1.49 |
columbiathreadneedleus.com/investment-products/mutual-funds
for more recent performance information.
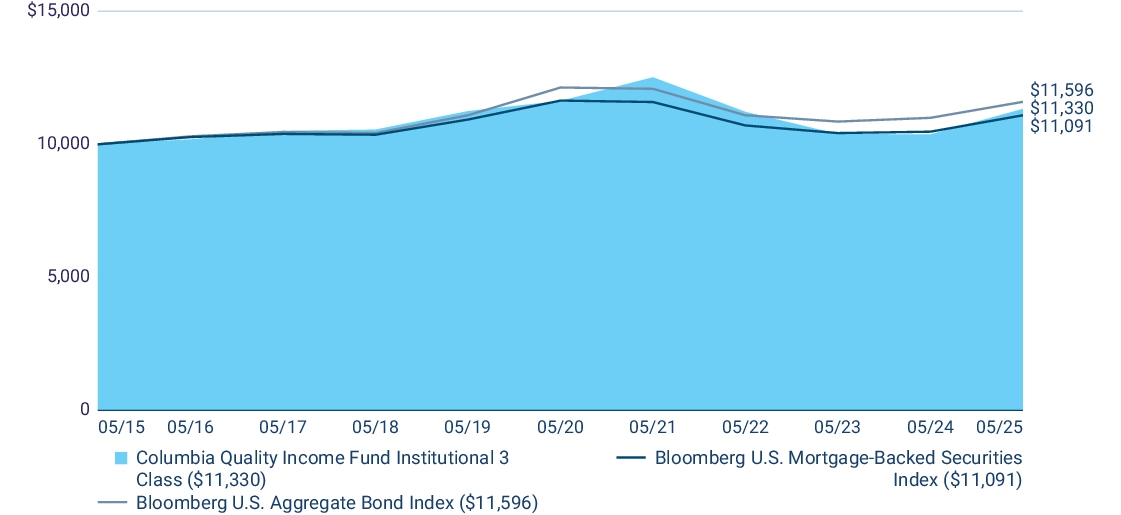
Key Fund Statistics
Fund net assets |
$ 1,274,068,619 |
Total number of portfolio holdings |
339 |
Management services fees (represents 0.49% of Fund average net assets) |
$ 6,652,421 |
Portfolio turnover for the reporting period |
330% |
Portfolio turnover for the reporting period excluding to be announced (TBA) securities |
17% |
Graphical Representation of Fund Holdings
The tables below show the investment makeup of the Fund represented as a percentage of Fund net assets. Derivatives are excluded from the tables unless otherwise noted. The Fund's portfolio composition is subject to change.
Bond ratings on Fund holdings are divided into categories ranging from highest to lowest credit quality, determined by using the middle rating of Moody’s Ratings, S&P and Fitch, after dropping the highest and lowest available ratings. When ratings are available from only two rating agencies, the lower rating is used. When a rating is available from only one rating agency, that rating is used. If a security is not rated by Moody's Ratings, S&P or Fitch, but has a rating by Kroll and/or DBRS, the same methodology is applied to those bonds that would otherwise be not rated. When a bond is not rated by any rating agency, it is designated as “Not rated.” Credit quality ratings assigned by a rating agency are subjective opinions, not statements of fact, and are subject to change, including daily.
Top Holdings
| Uniform Mortgage-Backed Security TBA 06/13/2054 4.500% |
8.2 % |
| Uniform Mortgage-Backed Security TBA 06/12/2055 3.500% |
7.9 % |
| Government National Mortgage Association TBA 06/20/2054 4.500% |
4.8 % |
| Government National Mortgage Association 05/20/2051 2.500% |
2.7 % |
| Uniform Mortgage-Backed Security TBA 06/18/2040 3.000% |
2.7 % |
| Federal National Mortgage Association 08/01/2052 4.000% |
2.3 % |
| Uniform Mortgage-Backed Security TBA 06/13/2054 3.000% |
1.9 % |
| Federal National Mortgage Association 11/01/2052 4.500% |
1.8 % |
| Uniform Mortgage-Backed Security TBA 06/13/2054 2.000% |
1.8 % |
| Federal Home Loan Mortgage Corp. 08/01/2052 3.000% |
1.6 % |
Asset Categories

Credit Quality

Top Holdings
| Uniform Mortgage-Backed Security TBA 06/13/2054 4.500% |
8.2 % |
| Uniform Mortgage-Backed Security TBA 06/12/2055 3.500% |
7.9 % |
| Government National Mortgage Association TBA 06/20/2054 4.500% |
4.8 % |
| Government National Mortgage Association 05/20/2051 2.500% |
2.7 % |
| Uniform Mortgage-Backed Security TBA 06/18/2040 3.000% |
2.7 % |
| Federal National Mortgage Association 08/01/2052 4.000% |
2.3 % |
| Uniform Mortgage-Backed Security TBA 06/13/2054 3.000% |
1.9 % |
| Federal National Mortgage Association 11/01/2052 4.500% |
1.8 % |
| Uniform Mortgage-Backed Security TBA 06/13/2054 2.000% |
1.8 % |
| Federal Home Loan Mortgage Corp. 08/01/2052 3.000% |
1.6 % |