Shareholder Report
May 31, 2025
USD ($)
HOLDINGS
columbiathreadneedleus.com/resources/literature
. You can also request more information by contacting us at 1-800-345-6611.
What were the Fund costs for the reporting period?
(Based on a hypothetical $10,000 investment)
| Class | Cost of a $10,000 investment | Cost paid as a percentage of a $10,000 investment |
| Class A | $ 100 | 0.96 % |
Management's Discussion of Fund Performance
The performance of Class A shares for the period presented is shown in the Average Annual Total Returns table.
Top Performance Contributors
Stock selection
| Selections in the consumer discretionary, financials and industrials sectors boosted the Fund’s results most relative to the benchmark during the annual period.Allocations
| Larger weightings relative to the benchmark in the financials and industrials sectors and smaller relative weightings in the materials and energy sectors improved Fund results during the annual period.Individual holdings
| A relative overweight position in JPMorgan Chase & Co., a multinational financial and investment banking company; a relative overweight position in Boston Scientific Corporation, a medical devices company; a relative overweight position in Goldman Sachs Group, Inc., a multinational financial and investment banking company; a relative overweight position in Oracle Corporation, a computer technology company that engages in the provision of products and services used for corporate applications; and a relative overweight position in Allstate Corp., an insurance company, were among the top contributors to Fund performance.Top Performance Detractors
Stock selection
Allocations
| Larger weightings relative to the benchmark in the health care and information technology sectors and smaller relative weightings in the real estate, utilities, consumer staples and communication services sectors detracted from Fund performance during the period.Individual holdings
| A relative overweight position in UnitedHealth Group, Inc., a health insurance and health care service company; a relative overweight position in Thermo Fisher Scientific, Inc., a life science tools and clinical research company; a relative overweight position in Merck & Co., Inc., a pharmaceutical company; a relative overweight position in ON Semiconductor Corp., a semiconductor company; and a relative overweight position in Target Corp., a retail corporation that operates a chain of general merchandise stores, were notable detractors from Fund performance during the period.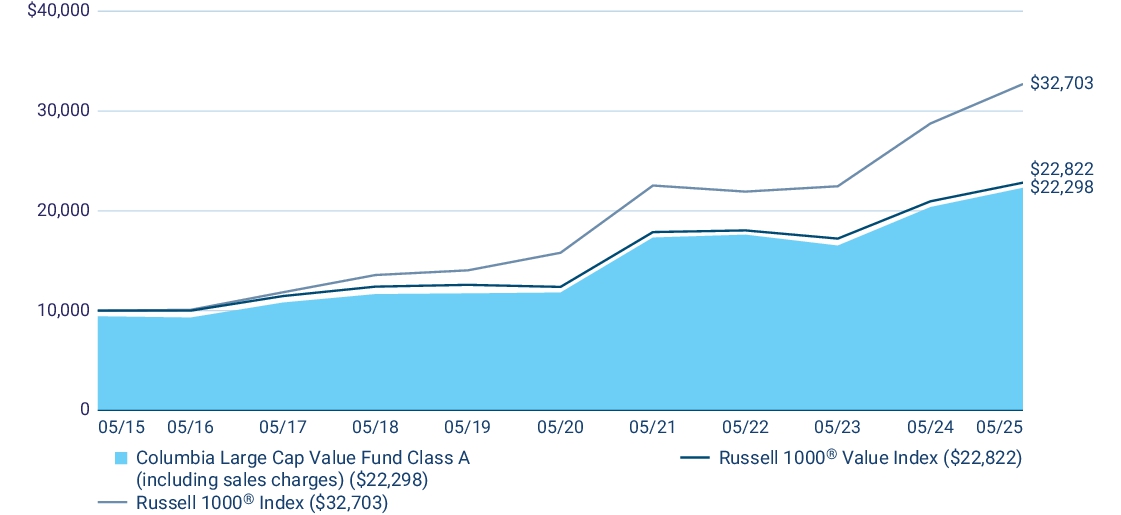
| Average Annual Total Returns (%) | 1 year | 5 years | 10 years |
| Class A (excluding sales charges) | 9.46 | 13.56 | 8.99 |
| Class A (including sales charges) | 3.18 | 12.23 | 8.35 |
| Russell 1000® Value Index | 8.91 | 13.02 | 8.60 |
| Russell 1000® Index | 13.73 | 15.66 | 12.58 |
columbiathreadneedleus.com/investment-products/mutual-funds
for more recent performance information.
Key Fund Statistics
Fund net assets | $ 2,422,466,912 |
Total number of portfolio holdings | 67 |
Management services fees (represents 0.63% of Fund average net assets) | $ 15,376,718 |
Portfolio turnover for the reporting period | 27% |
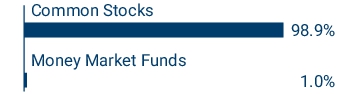
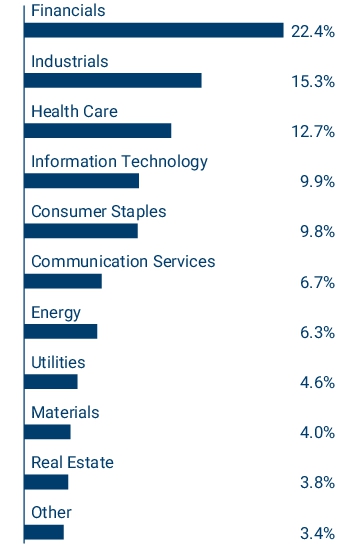
Graphical Representation of Fund Holdings
The tables below show the investment makeup of the
Fund
represented as a percentage of Fund net assets. Derivatives are excluded from the tables unless otherwise
noted. The Fund's portfolio composition is subject to change.Top Holdings
| JPMorgan Chase & Co. | 4.1 % |
| Berkshire Hathaway, Inc., Class B | 3.4 % |
| Walmart, Inc. | 3.0 % |
| Exxon Mobil Corp. | 2.8 % |
| Philip Morris International, Inc. | 2.7 % |
| Procter & Gamble Co. (The) | 2.3 % |
| Linde PLC | 2.2 % |
| Citigroup, Inc. | 2.1 % |
| Boeing Co. (The) | 2.0 % |
| Walt Disney Co. (The) | 1.9 % |
Asset Categories

Equity Sector Allocation

Top Holdings
| JPMorgan Chase & Co. | 4.1 % |
| Berkshire Hathaway, Inc., Class B | 3.4 % |
| Walmart, Inc. | 3.0 % |
| Exxon Mobil Corp. | 2.8 % |
| Philip Morris International, Inc. | 2.7 % |
| Procter & Gamble Co. (The) | 2.3 % |
| Linde PLC | 2.2 % |
| Citigroup, Inc. | 2.1 % |
| Boeing Co. (The) | 2.0 % |
| Walt Disney Co. (The) | 1.9 % |
columbiathreadneedleus.com/resources/literature
. You can also request more information by contacting us at 1-800-345-6611.
What were the Fund costs for the reporting period?
(Based on a hypothetical $10,000 investment)
| Class | Cost of a $10,000 investment | Cost paid as a percentage of a $10,000 investment |
| Class C | $ 178 | 1.71 % |
Management's Discussion of Fund Performance
The performance of Class C shares for the period presented is shown in the Average Annual Total Returns table.
Top Performance Contributors
Stock selection
| Selections in the consumer discretionary, financials and industrials sectors boosted the Fund’s results most relative to the benchmark during the annual period.Allocations
| Larger weightings relative to the benchmark in the financials and industrials sectors and smaller relative weightings in the materials and energy sectors improved Fund results during the annual period.Individual holdings
| A relative overweight position in JPMorgan Chase & Co., a multinational financial and investment banking company; a relative overweight position in Boston Scientific Corporation, a medical devices company; a relative overweight position in Goldman Sachs Group, Inc., a multinational financial
and investment banking company; a relative overweight position in Oracle Corporation, a computer technology company that engages in the provision of products and services used for corporate applications; and a relative overweight position in Allstate Corp., an insurance company, were among the top contributors to Fund performance.Top Performance Detractors
Stock selection
Allocations
| Larger weightings relative to the benchmark in the health care and information technology sectors and smaller relative weightings in the real estate, utilities, consumer staples and communication services sectors detracted from Fund performance during the period.Individual holdings
| A relative overweight position in UnitedHealth Group, Inc., a health insurance and health care service company; a relative overweight position in Thermo Fisher Scientific, Inc., a life science tools and clinical research company; a relative overweight position in Merck & Co., Inc., a pharmaceutical company; a relative overweight position in ON Semiconductor Corp., a semiconductor company; and a relative overweight position in Target Corp., a retail corporation that operates a chain of general merchandise stores, were notable detractors from Fund performance during the period.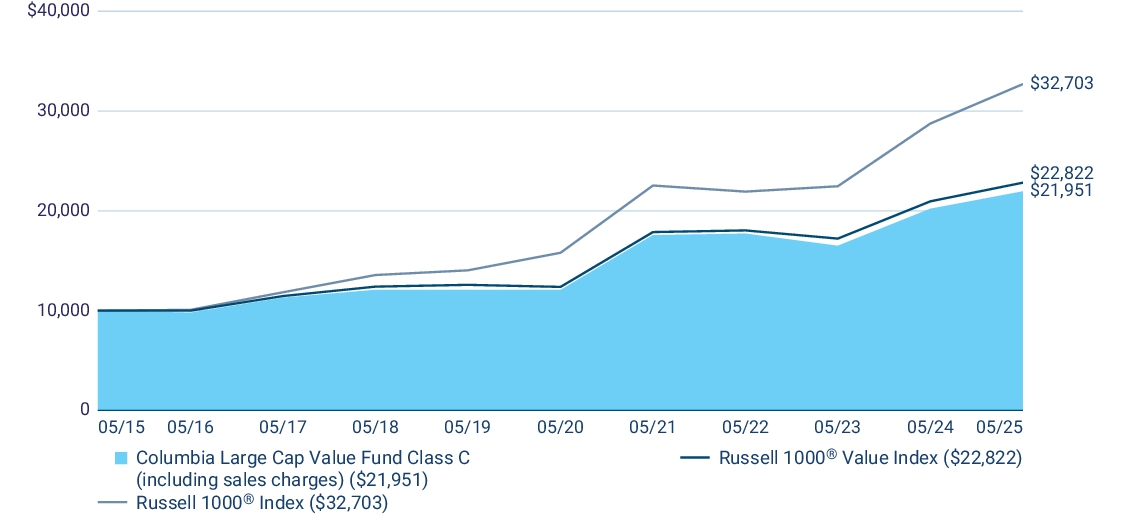
| Average Annual Total Returns (%) | 1 year | 5 years | 10 years |
| Class C (excluding sales charges) | 8.61 | 12.71 | 8.18 |
| Class C (including sales charges) | 7.61 | 12.71 | 8.18 |
| Russell 1000® Value Index | 8.91 | 13.02 | 8.60 |
| Russell 1000® Index | 13.73 | 15.66 | 12.58 |
columbiathreadneedleus.com/investment-products/mutual-funds
for more recent performance information.
Key Fund Statistics
Fund net assets | $ 2,422,466,912 |
Total number of portfolio holdings | 67 |
Management services fees (represents 0.63% of Fund average net assets) | $ 15,376,718 |
Portfolio turnover for the reporting period | 27% |
Graphical Representation of Fund Holdings
The tables below show the investment makeup of the Fund represented as a percentage of Fund net assets. Derivatives are excluded from the tables unless otherwise noted. The Fund's portfolio composition is subject to change.
Top Holdings
| JPMorgan Chase & Co. | 4.1 % |
| Berkshire Hathaway, Inc., Class B | 3.4 % |
| Walmart, Inc. | 3.0 % |
| Exxon Mobil Corp. | 2.8 % |
| Philip Morris International, Inc. | 2.7 % |
| Procter & Gamble Co. (The) | 2.3 % |
| Linde PLC | 2.2 % |
| Citigroup, Inc. | 2.1 % |
| Boeing Co. (The) | 2.0 % |
| Walt Disney Co. (The) | 1.9 % |
Asset Categories

Equity Sector Allocation

Top Holdings
| JPMorgan Chase & Co. | 4.1 % |
| Berkshire Hathaway, Inc., Class B | 3.4 % |
| Walmart, Inc. | 3.0 % |
| Exxon Mobil Corp. | 2.8 % |
| Philip Morris International, Inc. | 2.7 % |
| Procter & Gamble Co. (The) | 2.3 % |
| Linde PLC | 2.2 % |
| Citigroup, Inc. | 2.1 % |
| Boeing Co. (The) | 2.0 % |
| Walt Disney Co. (The) | 1.9 % |
columbiathreadneedleus.com/resources/literature
. You can also request more information by contacting us at 1-800-345-6611.
What were the
Fund
costs for the reporting period?(Based on a hypothetical $10,000 investment)
| Class | Cost of a $10,000 investment | Cost paid as a percentage of a $10,000 investment |
| Institutional Class | $ 75 | 0.72 % |
Management's Discussion of Fund Performance
The performance of Institutional Class shares for the period presented is shown in the Average Annual Total Returns table.
Top Performance Contributors
Stock selection
| Selections in the consumer discretionary, financials and industrials sectors boosted the Fund’s results most relative to the benchmark during the annual period.Allocations
| Larger weightings relative to the benchmark in the financials and industrials sectors and smaller relative weightings in the materials and energy sectors improved Fund results during the annual period.Individual holdings
| A relative overweight position in JPMorgan Chase & Co., a multinational financial and investment banking company; a relative overweight position in Boston Scientific Corporation, a medical devices company; a relative overweight position in Goldman Sachs Group, Inc., a multinational financial and investment banking company; a relative overweight position in Oracle Corporation, a computer technology company that engages in the provision of products and services used for corporate applications; and a relative overweight position in Allstate Corp., an insurance company, were among the top contributors to Fund performance.Top Performance Detractors
Stock selection
Allocations
| Larger weightings relative to the benchmark in the health care and information technology sectors and smaller relative weightings in the real estate, utilities, consumer staples and communication services sectors detracted from Fund performance during the period.Individual holdings
| A relative overweight position in UnitedHealth Group, Inc., a health insurance and health care service company; a relative overweight position in Thermo Fisher Scientific, Inc., a life science tools and clinical research company; a relative overweight position in Merck & Co., Inc., a pharmaceutical company; a relative overweight position in ON Semiconductor Corp., a semiconductor company; and a relative overweight position in Target Corp., a retail corporation that operates a chain of general merchandise stores, were notable detractors from Fund performance during the period.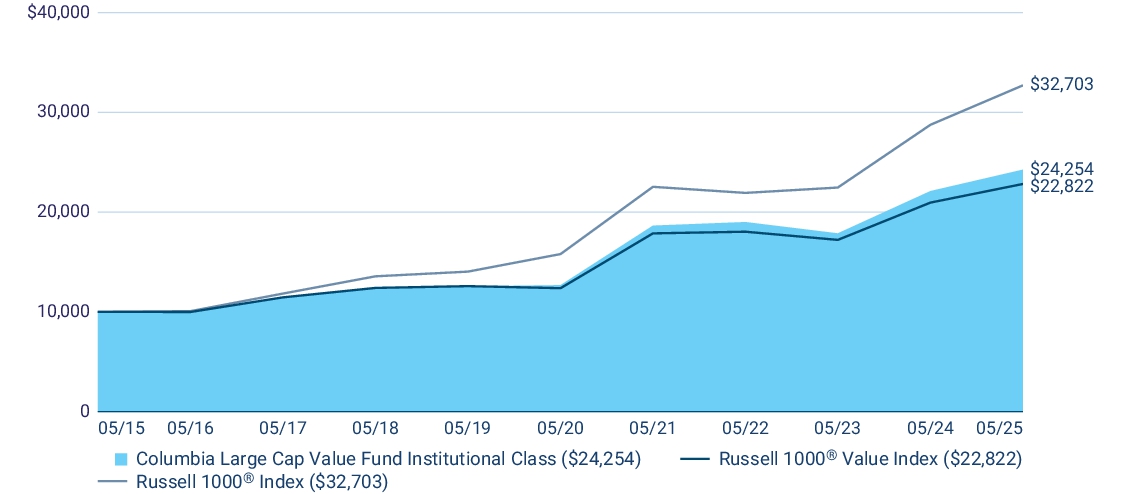
| Average Annual Total Returns (%) | 1 year | 5 years | 10 years |
| Institutional Class | 9.70 | 13.85 | 9.26 |
| Russell 1000® Value Index | 8.91 | 13.02 | 8.60 |
| Russell 1000® Index | 13.73 | 15.66 | 12.58 |
columbiathreadneedleus.com/investment-products/mutual-funds
for more recent performance information.
Key Fund
Statistics
Fund net assets | $ 2,422,466,912 |
Total number of portfolio holdings | 67 |
Management services fees (represents 0.63% of Fund average net assets) | $ 15,376,718 |
Portfolio turnover for the reporting period | 27% |
Graphical Representation of Fund Holdings
The tables below show the investment
makeup
of the Fund represented as a percentage of Fund net assets. Derivatives are excluded from the tables unless otherwise noted. The Fund's portfolio composition is subject to change.Top Holdings
| JPMorgan Chase & Co. | 4.1 % |
| Berkshire Hathaway, Inc., Class B | 3.4 % |
| Walmart, Inc. | 3.0 % |
| Exxon Mobil Corp. | 2.8 % |
| Philip Morris International, Inc. | 2.7 % |
| Procter & Gamble Co. (The) | 2.3 % |
| Linde PLC | 2.2 % |
| Citigroup, Inc. | 2.1 % |
| Boeing Co. (The) | 2.0 % |
| Walt Disney Co. (The) | 1.9 % |
Asset Categories

Equity Sector Allocation

Top Holdings
| JPMorgan Chase & Co. | 4.1 % |
| Berkshire Hathaway, Inc., Class B | 3.4 % |
| Walmart, Inc. | 3.0 % |
| Exxon Mobil Corp. | 2.8 % |
| Philip Morris International, Inc. | 2.7 % |
| Procter & Gamble Co. (The) | 2.3 % |
| Linde PLC | 2.2 % |
| Citigroup, Inc. | 2.1 % |
| Boeing Co. (The) | 2.0 % |
| Walt Disney Co. (The) | 1.9 % |
columbiathreadneedleus.com/resources/literature
. You can also request more information by contacting us at 1-800-345-6611.
What were the Fund costs for the reporting period?
(Based on a hypothetical $10,000 investment)
| Class | Cost of a $10,000 investment | Cost paid as a percentage of a $10,000 investment |
| Institutional 2 Class | $ 72 | 0.69 % |
Management's Discussion of Fund Performance
The performance of Institutional 2 Class shares for the period presented is shown in the Average Annual Total Returns table.
Top Performance Contributors
Stock selection
| Selections in the consumer discretionary, financials and industrials sectors boosted the Fund’s results most relative to the benchmark during the annual period.Allocations
| Larger weightings relative to the benchmark in the financials and industrials sectors and smaller relative weightings in the materials and energy sectors improved Fund results during the annual period.Individual holdings
| A relative overweight position in JPMorgan Chase & Co., a multinational financial and investment banking company; a relative overweight position in Boston Scientific Corporation, a medical devices company; a relative overweight position in Goldman Sachs Group, Inc., a multinational financial and investment banking company; a relative overweight position in Oracle Corporation, a computer technology company that engages in the provision of products and services used for corporate applications; and a relative overweight position in Allstate Corp., an insurance company, were among the top contributors to Fund performance.Top Performance Detractors
Stock selection
Allocations
| Larger weightings relative to the benchmark in the health care and information technology sectors and smaller relative weightings in the real estate, utilities, consumer staples and communication services sectors detracted from Fund performance during the period.Individual holdings
| A relative overweight position in UnitedHealth Group, Inc., a health insurance and health care service company; a relative overweight position in Thermo Fisher Scientific, Inc., a life science tools and clinical research company; a relative overweight position in Merck & Co., Inc., a pharmaceutical company; a relative overweight position in ON Semiconductor Corp., a semiconductor company; and a relative overweight position in Target Corp., a retail corporation that operates a chain of general merchandise stores, were notable detractors from Fund performance during the period.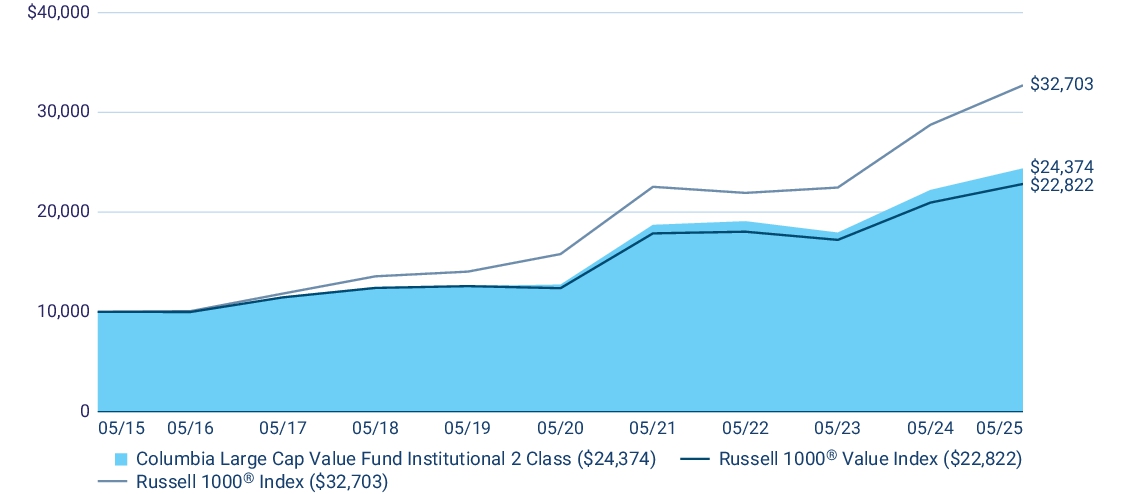
| Average Annual Total Returns (%) | 1 year | 5 years | 10 years |
| Institutional 2 Class | 9.71 | 13.86 | 9.32 |
| Russell 1000® Value Index | 8.91 | 13.02 | 8.60 |
| Russell 1000® Index | 13.73 | 15.66 | 12.58 |
columbiathreadneedleus.com/investment-products/mutual-funds
for more recent performance information.
Key Fund
Statistics
Fund net assets | $ 2,422,466,912 |
Total number of portfolio holdings | 67 |
Management services fees (represents 0.63% of Fund average net assets) | $ 15,376,718 |
Portfolio turnover for the reporting period | 27% |
Graphical Representation of Fund Holdings
The tables below show the investment makeup of the Fund represented as a percentage of Fund net assets. Derivatives are excluded from the tables unless otherwise noted. The Fund's portfolio composition is subject to change.
Top Holdings
| JPMorgan Chase & Co. | 4.1 % |
| Berkshire Hathaway, Inc., Class B | 3.4 % |
| Walmart, Inc. | 3.0 % |
| Exxon Mobil Corp. | 2.8 % |
| Philip Morris International, Inc. | 2.7 % |
| Procter & Gamble Co. (The) | 2.3 % |
| Linde PLC | 2.2 % |
| Citigroup, Inc. | 2.1 % |
| Boeing Co. (The) | 2.0 % |
| Walt Disney Co. (The) | 1.9 % |
Asset Categories
Equity Sector Allocation
Top Holdings
| JPMorgan Chase & Co. | 4.1 % |
| Berkshire Hathaway, Inc., Class B | 3.4 % |
| Walmart, Inc. | 3.0 % |
| Exxon Mobil Corp. | 2.8 % |
| Philip Morris International, Inc. | 2.7 % |
| Procter & Gamble Co. (The) | 2.3 % |
| Linde PLC | 2.2 % |
| Citigroup, Inc. | 2.1 % |
| Boeing Co. (The) | 2.0 % |
| Walt Disney Co. (The) | 1.9 % |
columbiathreadneedleus.com/resources/literature
. You can also request more information by contacting us at 1-800-345-6611.
What were the Fund costs for the reporting period?
(Based on a hypothetical $10,000 investment)
| Class | Cost of a $10,000 investment | Cost paid as a percentage of a $10,000 investment |
| Institutional 3 Class | $ 68 | 0.65 % |
Management's Discussion of Fund Performance
The performance of Institutional 3 Class shares for the period presented is shown in the Average Annual Total Returns table.
Top Performance Contributors
Stock selection
| Selections in the consumer discretionary, financials and industrials sectors boosted the Fund’s results most relative to the benchmark during the annual period.Allocations
| Larger weightings relative to the benchmark in the financials and industrials sectors and smaller relative weightings in the materials and energy sectors improved Fund results during the annual period.Individual holdings
| A relative overweight position in JPMorgan Chase & Co., a multinational financial and investment banking company; a relative overweight position in Boston Scientific Corporation, a medical devices company; a relative overweight position in Goldman Sachs Group, Inc., a multinational financial and investment banking company; a relative overweight position in Oracle Corporation, a computer technology company that engages in the provision of products and services used for corporate applications; and a relative overweight position in Allstate Corp., an insurance company, were among the top contributors to Fund performance.Top Performance Detractors
Stock selection
Allocations
| Larger weightings relative to the benchmark in the health care and information technology sectors and smaller relative weightings in the real estate, utilities, consumer staples and communication services sectors detracted from Fund performance during the period.Individual holdings
| A relative overweight position in UnitedHealth Group, Inc., a health insurance and health care service company; a relative overweight position in Thermo Fisher Scientific, Inc., a life science tools and clinical research company; a relative overweight position in Merck & Co., Inc., a pharmaceutical company; a relative overweight position in ON Semiconductor Corp., a semiconductor company; and a relative overweight position in Target Corp., a retail corporation that operates a chain of general merchandise stores, were notable detractors from Fund performance during the period.
| Average Annual Total Returns (%) | 1 year | 5 years | 10 years |
| Institutional 3 Class | 9.78 | 13.93 | 9.37 |
| Russell 1000® Value Index | 8.91 | 13.02 | 8.60 |
| Russell 1000® Index | 13.73 | 15.66 | 12.58 |
columbiathreadneedleus.com/investment-products/mutual-funds
for more recent performance information.
Key Fund
Statistics
Fund net assets | $ 2,422,466,912 |
Total number of portfolio holdings | 67 |
Management services fees (represents 0.63% of Fund average net assets) | $ 15,376,718 |
Portfolio turnover for the reporting period | 27% |
Graphical Representation of Fund Holdings
The tables below show the investment makeup of the Fund
represented
as a percentage of Fund net assets. Derivatives are excluded from the tables unless otherwise noted. The Fund's portfolio composition is subject to change.Top Holdings
| JPMorgan Chase & Co. | 4.1 % |
| Berkshire Hathaway, Inc., Class B | 3.4 % |
| Walmart, Inc. | 3.0 % |
| Exxon Mobil Corp. | 2.8 % |
| Philip Morris International, Inc. | 2.7 % |
| Procter & Gamble Co. (The) | 2.3 % |
| Linde PLC | 2.2 % |
| Citigroup, Inc. | 2.1 % |
| Boeing Co. (The) | 2.0 % |
| Walt Disney Co. (The) | 1.9 % |
Asset Categories

Equity Sector Allocation

Top Holdings
| JPMorgan Chase & Co. | 4.1 % |
| Berkshire Hathaway, Inc., Class B | 3.4 % |
| Walmart, Inc. | 3.0 % |
| Exxon Mobil Corp. | 2.8 % |
| Philip Morris International, Inc. | 2.7 % |
| Procter & Gamble Co. (The) | 2.3 % |
| Linde PLC | 2.2 % |
| Citigroup, Inc. | 2.1 % |
| Boeing Co. (The) | 2.0 % |
| Walt Disney Co. (The) | 1.9 % |