Shareholder Report
May 31, 2025
USD ($)
Holding
columbiathreadneedleus.com/resources/literature
. You can also request more information by contacting us at 1-800-345-6611.
What were the Fund costs for the reporting period?
(Based on a hypothetical $10,000 investment)
| Class | Cost of a $10,000 investment | Cost paid as a percentage of a $10,000 investment |
| Class A | $ 101 |
0.97 % |
Management's Discussion of Fund Performance
The performance of Class A shares for the period presented is shown in the Average Annual Total Returns table.
Top Performance Contributors
Industry allocation
| The Fund’s largest contributor to relative returns during the period was from its allocation to the building materials industry. Additional contribution during the period came from an allocation to department stores.Security selection
| Security selection in the support–services sector, with an allocation to a roofing supply business, contributed to relative performance. Additional security selection was most positive in the gas–distribution sector with an allocation to a natural gas-distribution company.Credit allocation
| Allocations to BB and B rated debt, as well as small allocations to investment-grade debt was most additive to Fund performance.Top Performance Detractors
Industry allocation
Security selection
| Security selection in the telecom–wireline integrated industry detracted most, with an allocation to an internet service provider. Additional negative performance for the Fund came from the Real Estate Investment Trust industry, with allocations to an IT and storage company.Credit allocation
| Allocations to CCC and below rated debt, as well as cash allocations, detracted from the Fund’s relative performance.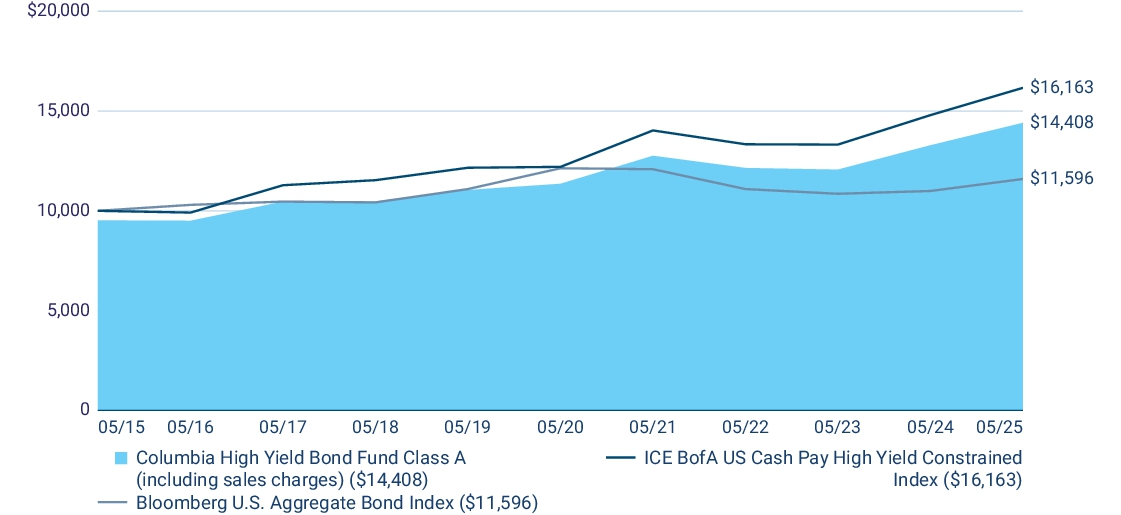
| Average Annual Total Returns (%) | 1 year | 5 years | 10 years |
| Class A (excluding sales charges) | 8.46 | 4.88 | 4.23 |
| Class A (including sales charges) | 3.27 | 3.86 | 3.72 |
| ICE BofA US Cash Pay High Yield Constrained Index | 9.24 | 5.78 | 4.92 |
| Bloomberg U.S. Aggregate Bond Index | 5.46 | (0.90 ) |
1.49 |
columbiathreadneedleus.com/investment-products/mutual-funds
for more recent performance information.
Key Fund Statistics
Fund net assets |
$ 1,355,498,411 |
Total number of portfolio holdings |
458 |
Management services fees (represents 0.63% of Fund average net assets) |
$ 8,621,920 |
Portfolio turnover for the reporting period |
45% |
Graphical Representation of Fund Holdings
The tables below show the investment makeup of the Fund represented as a percentage of Fund net assets. Derivatives are excluded from the tables unless otherwise noted. The Fund's portfolio composition is subject to change.
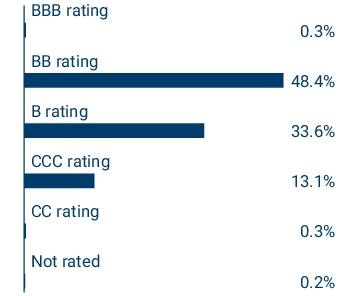
Bond ratings on Fund holdings are divided into categories ranging from highest to lowest credit quality, determined by using the average rating of Moody’s Ratings, S&P and Fitch. When ratings are available from only two rating agencies, the average of the two ratings is used. When a rating is available from only one rating agency, that rating is used. When a bond is not rated by any rating agency, it is designated as “Not rated.” Credit quality ratings assigned by a rating agency are subjective opinions, not statements of fact, and are subject to change, including daily.
Top Holdings
| Columbia US High Yield ETF | 1.0 % |
| Alliant Holdings Intermediate LLC/Co-Issuer 10/15/2027 6.750% |
0.7 % |
| American Airlines, Inc./AAdvantage Loyalty IP Ltd. 04/20/2029 5.750% |
0.6 % |
| HUB International, Ltd. 06/15/2030 7.250% |
0.6 % |
| DISH Network Corp. 11/15/2027 11.750% |
0.6 % |
| CCO Holdings LLC/Capital Corp. 03/01/2030 4.750% |
0.6 % |
| Cloud Software Group, Inc. 09/30/2029 9.000% |
0.6 % |
| Altice France SA 07/15/2029 5.125% |
0.6 % |
| BroadStreet Partners, Inc. 04/15/2029 5.875% |
0.6 % |
| ZoomInfo Technologies LLC/Finance Corp. 02/01/2029 3.875% |
0.6 % |
Asset Categories

Credit Quality

Top Holdings
| Columbia US High Yield ETF | 1.0 % |
| Alliant Holdings Intermediate LLC/Co-Issuer 10/15/2027 6.750% |
0.7 % |
| American Airlines, Inc./AAdvantage Loyalty IP Ltd. 04/20/2029 5.750% |
0.6 % |
| HUB International, Ltd. 06/15/2030 7.250% |
0.6 % |
| DISH Network Corp. 11/15/2027 11.750% |
0.6 % |
| CCO Holdings LLC/Capital Corp. 03/01/2030 4.750% |
0.6 % |
| Cloud Software Group, Inc. 09/30/2029 9.000% |
0.6 % |
| Altice France SA 07/15/2029 5.125% |
0.6 % |
| BroadStreet Partners, Inc. 04/15/2029 5.875% |
0.6 % |
| ZoomInfo Technologies LLC/Finance Corp. 02/01/2029 3.875% |
0.6 % |
columbiathreadneedleus.com/resources/literature
. You can also request more information by contacting us at 1-800-345-6611.
What were the Fund costs for the reporting period?
(Based on a hypothetical $10,000 investment)
| Class | Cost of a $10,000 investment | Cost paid as a percentage of a $10,000 investment |
| Class C | $ 178 | 1.72 % |
Management's Discussion of Fund Performance
The performance of Class C shares for the period presented is shown in the Average Annual Total Returns table.
Top Performance Contributors
Industry allocation
| The Fund’s largest contributor to relative returns during the period was from its allocation to the building materials industry. Additional contribution during the period came from an allocation to department stores.Security selection
| Security selection in the support–services sector, with an allocation to a roofing supply business, contributed to relative performance. Additional security selection was most positive in the gas–distribution sector with an allocation to a natural gas-distribution company.Credit allocation
| Allocations to BB and B rated debt, as well as small allocations to investment-grade debt was most additive to Fund performance.Top Performance Detractors
Industry allocation
Security selection
| Security selection in the telecom–wireline integrated industry detracted most, with an allocation to an internet service provider. Additional negative performance for the Fund came from the Real Estate Investment Trust industry, with allocations to an IT and storage company.Credit allocation
| Allocations to CCC and below rated debt, as well as cash allocations, detracted from the Fund’s relative performance.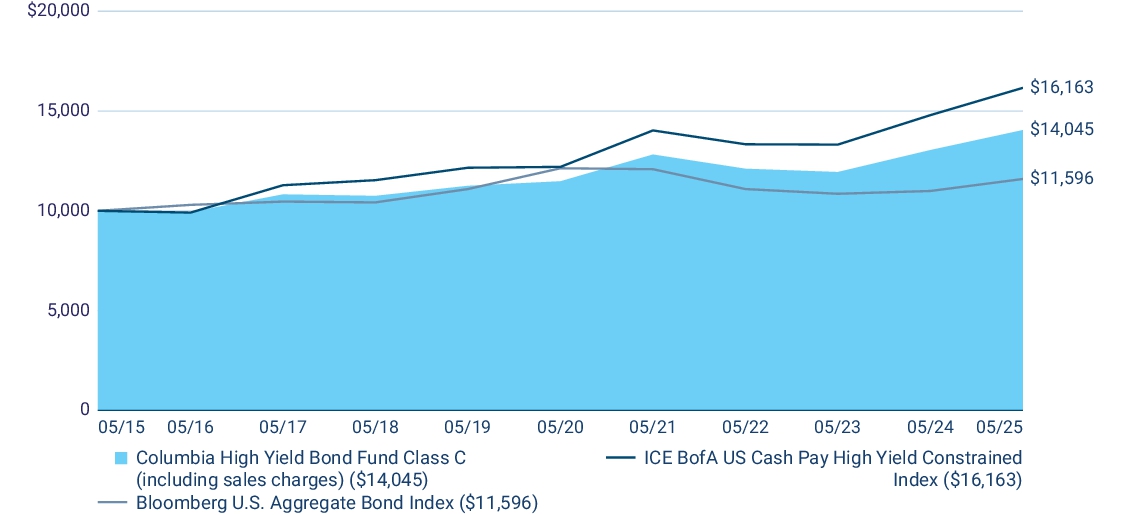
| Average Annual Total Returns (%) | 1 year | 5 years | 10 years |
| Class C (excluding sales charges) | 7.67 | 4.12 | 3.45 |
| Class C (including sales charges) | 6.67 | 4.12 | 3.45 |
| ICE BofA US Cash Pay High Yield Constrained Index | 9.24 | 5.78 | 4.92 |
| Bloomberg U.S. Aggregate Bond Index | 5.46 | (0.90 ) | 1.49 |
columbiathreadneedleus.com/investment-products/mutual-funds
for more recent performance information
Key Fund Statistics
Fund net assets | $ 1,355,498,411 |
Total number of portfolio holdings | 458 |
Management services fees (represents 0.63% of Fund average net assets) | $ 8,621,920 |
Portfolio turnover for the reporting period | 45% |
Graphical Representation of Fund Holdings
The tables below show the investment makeup of the Fund represented as a percentage of Fund net assets. Deriva
tives
are excluded from the tables unless otherwise noted. The Fund's portfolio composition is subject to change.Bond ratings on Fund holdings are divided into categories ranging from highest to lowest credit quality, determined by using the average rating of Moody’s Ratings, S&P and Fitch. When ratings are available from only two rating agencies, the average of the two ratings is used. When a rating is available from only one rating agency, that rating is used. When a bond is not rated by any rating agency, it is designated as “Not rated.” Credit quality ratings assigned by a rating agency are subjective opinions
, not statements of
fact
, and are subject to change, including daily.Top Holdings
| Columbia US High Yield ETF | 1.0 % |
| Alliant Holdings Intermediate LLC/Co-Issuer 10/15/2027 6.750% | 0.7 % |
| American Airlines, Inc./AAdvantage Loyalty IP Ltd. 04/20/2029 5.750% | 0.6 % |
| HUB International, Ltd. 06/15/2030 7.250% | 0.6 % |
| DISH Network Corp. 11/15/2027 11.750% | 0.6 % |
| CCO Holdings LLC/Capital Corp. 03/01/2030 4.750% | 0.6 % |
| Cloud Software Group, Inc. 09/30/2029 9.000% | 0.6 % |
| Altice France SA 07/15/2029 5.125% | 0.6 % |
| BroadStreet Partners, Inc. 04/15/2029 5.875% | 0.6 % |
| ZoomInfo Technologies LLC/Finance Corp. 02/01/2029 3.875% | 0.6 % |
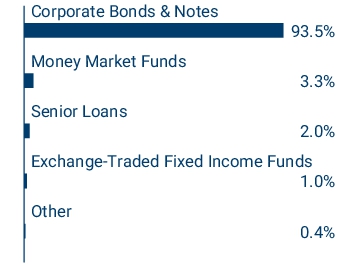
Asset Categories

Credit Quality

, not statements of
fact
, and are subject to change, including daily.
Top Holdings
| Columbia US High Yield ETF | 1.0 % |
| Alliant Holdings Intermediate LLC/Co-Issuer 10/15/2027 6.750% | 0.7 % |
| American Airlines, Inc./AAdvantage Loyalty IP Ltd. 04/20/2029 5.750% | 0.6 % |
| HUB International, Ltd. 06/15/2030 7.250% | 0.6 % |
| DISH Network Corp. 11/15/2027 11.750% | 0.6 % |
| CCO Holdings LLC/Capital Corp. 03/01/2030 4.750% | 0.6 % |
| Cloud Software Group, Inc. 09/30/2029 9.000% | 0.6 % |
| Altice France SA 07/15/2029 5.125% | 0.6 % |
| BroadStreet Partners, Inc. 04/15/2029 5.875% | 0.6 % |
| ZoomInfo Technologies LLC/Finance Corp. 02/01/2029 3.875% | 0.6 % |
columbiathreadneedleus.com/resources/literature
. You can also request more information by contacting us at 1-800-345-6611.
What were the Fund costs for the reporting period?
(Based on a hypothetical $10,000 investment)
| Class | Cost of a $10,000 investment | Cost paid as a percentage of a $10,000 investment |
| Institutional Class | $ 75 | 0.72 % |
Management's Discussion of Fund Performance
The performance of Institutional Class shares for the period presented is shown in the Average Annual Total Returns table.
Top Performance Contributors
Industry allocation
| The Fund’s largest contributor to relative returns during the period was from its allocation to the building materials industry. Additional contribution during the period came from an allocation to department stores.Security selection
| Security selection in the support–services sector, with an allocation to a roofing supply business, contributed to relative performance. Additional security selection was most positive in the gas–distribution sector with an allocation to a natural gas-distribution company.Credit allocation
| Allocations to BB and B rated debt, as well as small allocations to investment-grade debt was most additive to Fund performance.Top Performance Detractors
Industry allocation
Security selection
| Security selection in the telecom–wireline integrated industry detracted most, with an allocation to an internet service provider. Additional negative performance for the Fund came from the Real Estate Investment Trust industry, with allocations to an IT and storage company.Credit allocation
| Allocations to CCC and below rated debt, as well as cash allocations, detracted from the Fund’s relative performance.
| Average Annual Total Returns (%) | 1 year | 5 years | 10 years |
| Institutional Class | 8.73 | 5.12 | 4.48 |
| ICE BofA US Cash Pay High Yield Constrained Index | 9.24 | 5.78 | 4.92 |
| Bloomberg U.S. Aggregate Bond Index | 5.46 | (0.90 ) | 1.49 |
columbiathreadneedleus.com/investment-products/mutual-funds
for more recent performance information.
Key Fund Statistics
Fund net assets | $ 1,355,498,411 |
Total number of portfolio holdings | 458 |
Management services fees (represents 0.63% of Fund average net assets) | $ 8,621,920 |
Portfolio turnover for the reporting period | 45% |
Graphical Representation of Fund Holdings
The tables below show the investment makeup of the Fund represented as a percentage of Fund net assets. Derivati
ves
are excluded from the tables unless otherwise noted. The Fund's portfolio composition is subject to change.Bond ratings on Fund holdings are divided into categories ranging from highest to lowest credit quality, determined by using the average rating of Moody’s Ratings, S&P and Fitch. When ratings are available from only two rating agencies, the average of the two ratings is used. When a rating is available from only one rating age
ncy, that rat
ing is used. When a bond is not rated by any rating agency, it is designated as “Not rated.” Credit quality ratings assigned by a rating agency are subjective opinions, not statements of fact, and are subject to change, including daily.Top Holdings
| Columbia US High Yield ETF | 1.0 % |
| Alliant Holdings Intermediate LLC/Co-Issuer 10/15/2027 6.750% | 0.7 % |
| American Airlines, Inc./AAdvantage Loyalty IP Ltd. 04/20/2029 5.750% | 0.6 % |
| HUB International, Ltd. 06/15/2030 7.250% | 0.6 % |
| DISH Network Corp. 11/15/2027 11.750% | 0.6 % |
| CCO Holdings LLC/Capital Corp. 03/01/2030 4.750% | 0.6 % |
| Cloud Software Group, Inc. 09/30/2029 9.000% | 0.6 % |
| Altice France SA 07/15/2029 5.125% | 0.6 % |
| BroadStreet Partners, Inc. 04/15/2029 5.875% | 0.6 % |
| ZoomInfo Technologies LLC/Finance Corp. 02/01/2029 3.875% | 0.6 % |
Asset Categories

Credit Quality

ncy, that rat
ing is used. When a bond is not rated by any rating agency, it is designated as “Not rated.” Credit quality ratings assigned by a rating agency are subjective opinions, not statements of fact, and are subject to change, including daily.
Top Holdings
| Columbia US High Yield ETF | 1.0 % |
| Alliant Holdings Intermediate LLC/Co-Issuer 10/15/2027 6.750% | 0.7 % |
| American Airlines, Inc./AAdvantage Loyalty IP Ltd. 04/20/2029 5.750% | 0.6 % |
| HUB International, Ltd. 06/15/2030 7.250% | 0.6 % |
| DISH Network Corp. 11/15/2027 11.750% | 0.6 % |
| CCO Holdings LLC/Capital Corp. 03/01/2030 4.750% | 0.6 % |
| Cloud Software Group, Inc. 09/30/2029 9.000% | 0.6 % |
| Altice France SA 07/15/2029 5.125% | 0.6 % |
| BroadStreet Partners, Inc. 04/15/2029 5.875% | 0.6 % |
| ZoomInfo Technologies LLC/Finance Corp. 02/01/2029 3.875% | 0.6 % |
columbiathreadneedleus.com/resources/literature
. You can also request more information by contacting us at 1-800-345-6611.
What were the Fund costs for the reporting period?
(Based on a hypothetical $10,000 investment)
| Class | Cost of a $10,000 investment | Cost paid as a percentage of a $10,000 investment |
| Institutional 2 Class | $ 68 |
0.65 % |
Management's Discussion of Fund Performance
The performance of Institutional 2 Class shares for the period presented is shown in the Average Annual Total Returns table.
Top Performance Contributors
Industry allocation
| The Fund’s largest contributor to relative returns during the period was from its allocation to the building materials industry. Additional contribution during the period came from an allocation to department stores.Security selection
| Security selection in the support–services sector, with an allocation to a roofing supply business, contributed to relative performance. Additional security selection was most positive in the gas–distribution sector with an allocation to a natural gas-distribution company.Credit allocation
| Allocations to BB and B rated debt, as well as small allocations to investment-grade debt was most additive to Fund performance.Top Performance Detractors
Industry allocation
Security selection
| Security selection in the telecom–wireline integrated industry detracted most, with an allocation to an internet service provider. Additional negative performance for the Fund came from the Real Estate Investment Trust industry, with allocations to an IT and storage company.Credit allocation
| Allocations to CCC and below rated debt, as well as cash allocations, detracted from the Fund’s relative performance.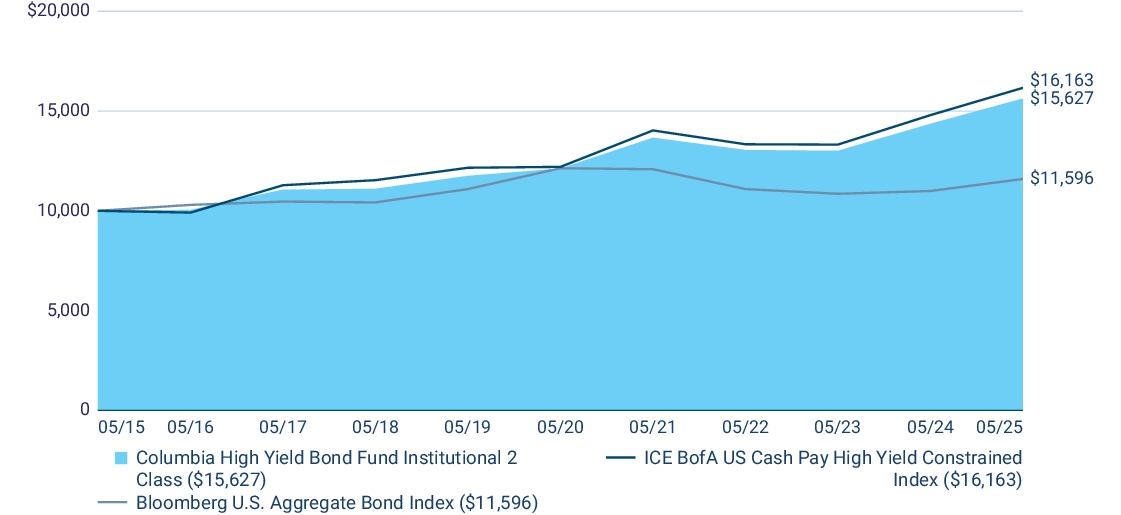
| Average Annual Total Returns (%) | 1 year | 5 years | 10 years |
| Institutional 2 Class | 8.82 | 5.22 | 4.57 |
| ICE BofA US Cash Pay High Yield Constrained Index | 9.24 | 5.78 | 4.92 |
| Bloomberg U.S. Aggregate Bond Index | 5.46 | (0.90 ) |
1.49 |
columbiathreadneedleus.com/investment-products/mutual-funds
for more recent performance information.
Key Fund Statistics
Fund net assets |
$ 1,355,498,411 |
Total number of portfolio holdings |
458 |
Management services fees (represents 0.63% of Fund average net assets) |
$ 8,621,920 |
Portfolio turnover for the reporting period |
45% |
Graphical Representation of Fund Holdings
The tables below show the investment makeup of the Fund represented as a percentage of Fund net assets. Derivati
ves
are excluded from the tables unless otherwise noted. The Fund's portfolio composition is subject to change.Bond ratings on Fund holdings are divided into categories ranging from highest to lowest credit quality, determined by using the average rating of Moody’s Ratings, S&P and Fitch. When ratings are available from only two rating agencies, the average of the two ratings is used. When a rating is available from only one rating agency, that rating is used. When a bond is not rated by any rating agency, it is designated as “Not rated.” Credit quality ratings assigned by a rating agency are subjective opinions, not statements of fact, and are subject to change, including daily.
Top Holdings
| Columbia US High Yield ETF | 1.0 % |
| Alliant Holdings Intermediate LLC/Co-Issuer 10/15/2027 6.750% |
0.7 % |
| American Airlines, Inc./AAdvantage Loyalty IP Ltd. 04/20/2029 5.750% |
0.6 % |
| HUB International, Ltd. 06/15/2030 7.250% |
0.6 % |
| DISH Network Corp. 11/15/2027 11.750% |
0.6 % |
| CCO Holdings LLC/Capital Corp. 03/01/2030 4.750% |
0.6 % |
| Cloud Software Group, Inc. 09/30/2029 9.000% |
0.6 % |
| Altice France SA 07/15/2029 5.125% |
0.6 % |
| BroadStreet Partners, Inc. 04/15/2029 5.875% |
0.6 % |
| ZoomInfo Technologies LLC/Finance Corp. 02/01/2029 3.875% |
0.6 % |
Asset Categories

Credit Quality

Top Holdings
| Columbia US High Yield ETF | 1.0 % |
| Alliant Holdings Intermediate LLC/Co-Issuer 10/15/2027 6.750% |
0.7 % |
| American Airlines, Inc./AAdvantage Loyalty IP Ltd. 04/20/2029 5.750% |
0.6 % |
| HUB International, Ltd. 06/15/2030 7.250% |
0.6 % |
| DISH Network Corp. 11/15/2027 11.750% |
0.6 % |
| CCO Holdings LLC/Capital Corp. 03/01/2030 4.750% |
0.6 % |
| Cloud Software Group, Inc. 09/30/2029 9.000% |
0.6 % |
| Altice France SA 07/15/2029 5.125% |
0.6 % |
| BroadStreet Partners, Inc. 04/15/2029 5.875% |
0.6 % |
| ZoomInfo Technologies LLC/Finance Corp. 02/01/2029 3.875% |
0.6 % |
columbiathreadneedleus.com/resources/literature
. You can also request more information by contacting us at 1-800-345-6611.
What were the Fund costs for the reporting period?
(Based on a hypothetical $10,000 investment)
| Class | Cost of a $10,000 investment | Cost paid as a percentage of a $10,000 investment |
| Institutional 3 Class | $ 62 |
0.60 % |
Management's Discussion of Fund Performance
The performance of Institutional 3 Class shares for the period presented is shown in the Average Annual Total Returns table.
Top Performance Contributors
Industry allocation
| The Fund’s largest contributor to relative returns during the period was from its allocation to the building materials industry. Additional contribution during the period came from an allocation to department stores.Security selection
| Security selection in the support–services sector, with an allocation to a roofing supply business, contributed to relative performance. Additional security selection was most positive in the gas–distribution sector with an allocation to a natural gas-distribution company.Credit allocation
| Allocations to BB and B rated debt, as well as small allocations to investment-grade debt was most additive to Fund performance.Top Performance Detractors
Industry allocation
Security selection
| Security selection in the telecom–wireline integrated industry detracted most, with an allocation to an internet service provider. Additional negative performance for the Fund came from the Real Estate Investment Trust industry, with allocations to an IT and storage company.Credit allocation
| Allocations to CCC and below rated debt, as well as cash allocations, detracted from the Fund’s relative performance.
| Average Annual Total Returns (%) | 1 year | 5 years | 10 years |
| Institutional 3 Class | 8.87 | 5.31 | 4.60 |
| ICE BofA US Cash Pay High Yield Constrained Index | 9.24 | 5.78 | 4.92 |
| Bloomberg U.S. Aggregate Bond Index | 5.46 | (0.90 ) |
1.49 |
columbiathreadneedleus.com/investment-products/mutual-funds
for more recent performance information.
Key Fund Statistics
Fund net assets |
$ 1,355,498,411 |
Total number of portfolio holdings |
458 |
Management services fees (represents 0.63% of Fund average net assets) |
$ 8,621,920 |
Portfolio turnover for the reporting period |
45% |
Graphical Representation of Fund Holdings
The tables below show the investment makeup of the Fund represented as a percentage of Fund net assets. Deriva
tive
s are excluded from the tables unless otherwise noted. The Fund's portfolio composition is subject to change.Bond ratings on Fund holdings are divided into categories ranging from highest to lowest credit quality, determined by using the average rating of Moody’s Ratings, S&P and Fitch. When ratings are available from only two rating agencies, the average of the two ratings is used. When a rating is available from only one rating agency, that rating is used. When a bond is not rated by any rating agency, it is designated as “Not rated.” Credit quality ratings assigned by a rating agency are subjective opinions, not statements of fact, and are subject to change, including daily.
Top Holdings
| Columbia US High Yield ETF | 1.0 % |
| Alliant Holdings Intermediate LLC/Co-Issuer 10/15/2027 6.750% |
0.7 % |
| American Airlines, Inc./AAdvantage Loyalty IP Ltd. 04/20/2029 5.750% |
0.6 % |
| HUB International, Ltd. 06/15/2030 7.250% |
0.6 % |
| DISH Network Corp. 11/15/2027 11.750% |
0.6 % |
| CCO Holdings LLC/Capital Corp. 03/01/2030 4.750% |
0.6 % |
| Cloud Software Group, Inc. 09/30/2029 9.000% |
0.6 % |
| Altice France SA 07/15/2029 5.125% |
0.6 % |
| BroadStreet Partners, Inc. 04/15/2029 5.875% |
0.6 % |
| ZoomInfo Technologies LLC/Finance Corp. 02/01/2029 3.875% |
0.6 % |
Asset Categories

Credit Quality

Top Holdings
| Columbia US High Yield ETF | 1.0 % |
| Alliant Holdings Intermediate LLC/Co-Issuer 10/15/2027 6.750% |
0.7 % |
| American Airlines, Inc./AAdvantage Loyalty IP Ltd. 04/20/2029 5.750% |
0.6 % |
| HUB International, Ltd. 06/15/2030 7.250% |
0.6 % |
| DISH Network Corp. 11/15/2027 11.750% |
0.6 % |
| CCO Holdings LLC/Capital Corp. 03/01/2030 4.750% |
0.6 % |
| Cloud Software Group, Inc. 09/30/2029 9.000% |
0.6 % |
| Altice France SA 07/15/2029 5.125% |
0.6 % |
| BroadStreet Partners, Inc. 04/15/2029 5.875% |
0.6 % |
| ZoomInfo Technologies LLC/Finance Corp. 02/01/2029 3.875% |
0.6 % |
annual shareholder report
contains important information about Columbia High Yield Bond Fund (the Fund) for the period of June 1, 2024 to May 31, 2025.
columbiathreadneedleus.com/resources/literature
. You can also request more information by contacting us at 1-800-345-6611.
What were the Fund costs for the reporting period?
(Based on a hypothetical $10,000 investment)
| Class | Cost of a $10,000 investment | Cost paid as a percentage of a $10,000 investment |
| Class R | $ 127 |
1.22 % |
Management's Discussion of Fund Performance
The performance of Class R shares for the period presented is shown in the Average Annual Total Returns t
able.
Top Performance Contributors
Industry allocation
| The Fund’s largest contributor to relative returns during the period was from its allocation to the building materials industry. Additional contribution during the period came from an allocation to department stores.Security selection
| Security selection in the support–services sector, with an allocation to a roofing supply business, contributed to relative performance. Additional security selection was most positive in the gas–distribution sector with an allocation to a natural gas-distribution company.Credit allocation
| Allocations to BB and B rated debt, as well as small allocations to investment-grade debt was most additive to Fund performance.Top Performance Detractors
Industry allocation
Security selection
| Security selection in the telecom–wireline integrated industry detracted most, with an allocation to an internet service provider. Additional negative performance for the Fund came from the Real Estate Investment Trust industry, with allocations to an IT and storage company.Credit allocation
| Allocations to CCC and below rated debt, as well as cash allocations, detracted from the Fund’s relative performance.
| Average Annual Total Returns (%) | 1 year | 5 years | 10 years |
| Class R | 8.18 | 4.60 | 3.96 |
| ICE BofA US Cash Pay High Yield Constrained Index | 9.24 | 5.78 | 4.92 |
| Bloomberg U.S. Aggregate Bond Index | 5.46 | (0.90 ) |
1.49 |
columbiathreadneedleus.com/investment-products/mutual-funds
for more recent performance information.
Key Fund Statistics
Fund net assets |
$ 1,355,498,411 |
Total number of portfolio holdings |
458 |
Management services fees (represents 0.63% of Fund average net assets) |
$ 8,621,920 |
Portfolio turnover for the reporting period |
45% |
Graphical Representation of Fund Holdings
The tables below show the investment makeup of the Fund represented as a percentage of Fund net assets. Derivatives are excluded from the tables unless otherwise noted. The Fund's portfolio composition is subject to change.
Bond ratings on Fund holdings are divided into categories ranging from highest to lowest credit quality, determined by using the average rating of Moody’s Ratings, S&P and Fitch. When ratings are available from only two rating agencies, the average of the two ratings is used. When a rating is available from only one rating agency, that rating is used. When a bond is not rated by any rating agency, it is designated as “Not rated.” Credit quality ratings assigned by a rating agency are subjective opinions, not statements of fact, and are subject to change, including daily.
Top Holdings
| Columbia US High Yield ETF | 1.0 % |
| Alliant Holdings Intermediate LLC/Co-Issuer 10/15/2027 6.750% |
0.7 % |
| American Airlines, Inc./AAdvantage Loyalty IP Ltd. 04/20/2029 5.750% |
0.6 % |
| HUB International, Ltd. 06/15/2030 7.250% |
0.6 % |
| DISH Network Corp. 11/15/2027 11.750% |
0.6 % |
| CCO Holdings LLC/Capital Corp. 03/01/2030 4.750% |
0.6 % |
| Cloud Software Group, Inc. 09/30/2029 9.000% |
0.6 % |
| Altice France SA 07/15/2029 5.125% |
0.6 % |
| BroadStreet Partners, Inc. 04/15/2029 5.875% |
0.6 % |
| ZoomInfo Technologies LLC/Finance Corp. 02/01/2029 3.875% |
0.6 % |
Asset Categories

Credit Quality
Top Holdings
| Columbia US High Yield ETF | 1.0 % |
| Alliant Holdings Intermediate LLC/Co-Issuer 10/15/2027 6.750% |
0.7 % |
| American Airlines, Inc./AAdvantage Loyalty IP Ltd. 04/20/2029 5.750% |
0.6 % |
| HUB International, Ltd. 06/15/2030 7.250% |
0.6 % |
| DISH Network Corp. 11/15/2027 11.750% |
0.6 % |
| CCO Holdings LLC/Capital Corp. 03/01/2030 4.750% |
0.6 % |
| Cloud Software Group, Inc. 09/30/2029 9.000% |
0.6 % |
| Altice France SA 07/15/2029 5.125% |
0.6 % |
| BroadStreet Partners, Inc. 04/15/2029 5.875% |
0.6 % |
| ZoomInfo Technologies LLC/Finance Corp. 02/01/2029 3.875% |
0.6 % |
columbiathreadneedleus.com/resources/literature
. You can also request more information by contacting us at 1-800-345-6611.
What were the Fund costs for the reporting period?
(Based on a hypothetical $10,000 investment)
| Class | Cost of a $10,000 investment | Cost paid as a percentage of a $10,000 investment |
| Class S | $ 48(a) | 0.72 % (b) |
| (a) | Based on operations from October 2, 2024 (commencement of operations) through the stated period end. Had the class been open for the entire reporting period, expenses shown in the table above would have been higher. |
| (b) | Annualized. |
Management's Discussion of Fund Performance
The performance of Class S shares for the period presented is shown in the Average Annual Total Returns table.
Top Performance Contributors
Industry allocation
| The Fund’s largest contributor to relative returns during the period was from its allocation to the building materials industry. Additional contribution during the period came from an allocation to department stores.Security selection
| Security selection in the support–services sector, with an allocation to a roofing supply business, contributed to relative performance. Additional security selection was most positive in the gas–distribution sector with an allocation to a natural gas-distribution company.Credit allocation
| Allocations to BB and B rated debt, as well as small allocations to investment-grade debt was most additive to Fund performance.Top Performance Detractors
Industry allocation
Security selection
| Security selection in the telecom–wireline integrated industry detracted most, with an allocation to an internet service provider. Additional negative performance for the Fund came from the Real Estate Investment Trust industry, with allocations to an IT and storage company.Credit allocation
| Allocations to CCC and below rated debt, as well as cash allocations, detracted from the Fund’s relative performance.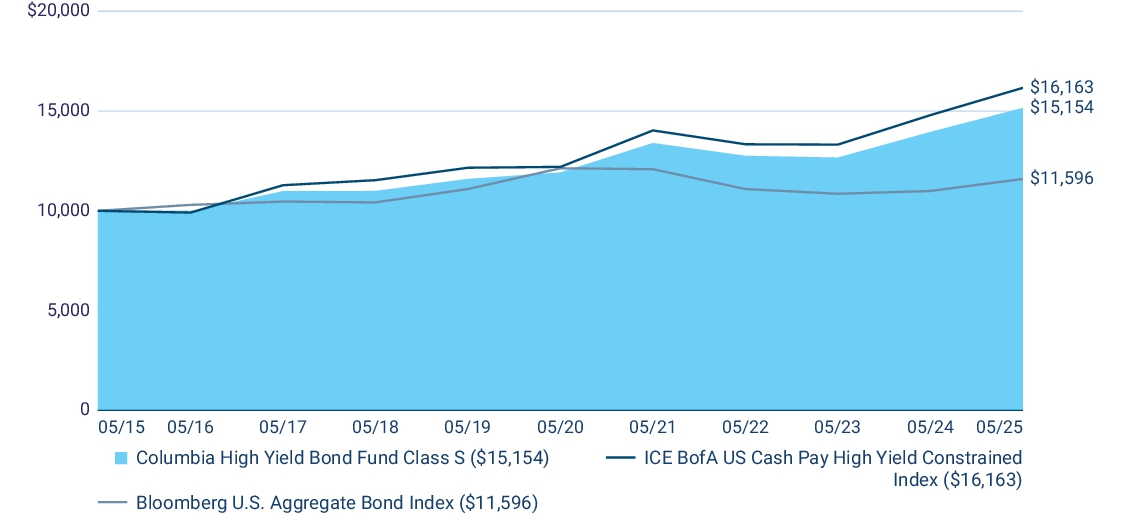
| Average Annual Total Returns (%) | 1 year | 5 years | 10 years |
| Class S (a) | 8.63 | 4.91 | 4.24 |
| ICE BofA US Cash Pay High Yield Constrained Index | 9.24 | 5.78 | 4.92 |
| Bloomberg U.S. Aggregate Bond Index | 5.46 | (0.90 ) | 1.49 |
(a) | The returns shown for periods prior to October 2, 2024 (including Since Fund Inception returns, if shown) include the returns of Class A. These returns are adjusted to reflect any higher class-related operating expenses of the newer share classes, as applicable. Please visit columbiathreadneedleus.com/investment-products/mutual-funds/appended-performance for more information. |
columbiathreadneedleus.com/investment-products/mutual-funds
for more recent performance information.
Key Fund Statistics
Fund net assets | $ 1,355,498,411 |
Total number of portfolio holdings | 458 |
Management services fees (represents 0.63% of Fund average net assets) | $ 8,621,920 |
Portfolio turnover for the reporting period | 45% |
Graphical Representation of Fund Holdings
The tables below show the investment makeup of the Fund represented as a percentage of Fund net assets. Derivatives are excluded from the tables unless otherwise noted. The Fund's portfolio composition is subject to change.
Bond ratings on Fund holdings are divided into categories ranging from highest to lowest credit quality, determined by using the average rating of Moody’s Ratings, S&P and Fitch. When ratings are available from only two rating agencies, the ave
rage of
the two ratings is used. When a rating is available from only one rating agency, that rating is used. When a bond is not rated by any rating agency, it is designated as “Not rated.” Credit quality ratings assigned by a rating agency are subjective opinions, not statements of fact, and are subject to change, including daily.Top Holdings
| Columbia US High Yield ETF | 1.0 % |
| Alliant Holdings Intermediate LLC/Co-Issuer 10/15/2027 6.750% | 0.7 % |
| American Airlines, Inc./AAdvantage Loyalty IP Ltd. 04/20/2029 5.750% | 0.6 % |
| HUB International, Ltd. 06/15/2030 7.250% | 0.6 % |
| DISH Network Corp. 11/15/2027 11.750% | 0.6 % |
| CCO Holdings LLC/Capital Corp. 03/01/2030 4.750% | 0.6 % |
| Cloud Software Group, Inc. 09/30/2029 9.000% | 0.6 % |
| Altice France SA 07/15/2029 5.125% | 0.6 % |
| BroadStreet Partners, Inc. 04/15/2029 5.875% | 0.6 % |
| ZoomInfo Technologies LLC/Finance Corp. 02/01/2029 3.875% | 0.6 % |
Asset Categories
Credit Quality

rage of
the two ratings is used. When a rating is available from only one rating agency, that rating is used. When a bond is not rated by any rating agency, it is designated as “Not rated.” Credit quality ratings assigned by a rating agency are subjective opinions, not statements of fact, and are subject to change, including daily.
Top Holdings
| Columbia US High Yield ETF | 1.0 % |
| Alliant Holdings Intermediate LLC/Co-Issuer 10/15/2027 6.750% | 0.7 % |
| American Airlines, Inc./AAdvantage Loyalty IP Ltd. 04/20/2029 5.750% | 0.6 % |
| HUB International, Ltd. 06/15/2030 7.250% | 0.6 % |
| DISH Network Corp. 11/15/2027 11.750% | 0.6 % |
| CCO Holdings LLC/Capital Corp. 03/01/2030 4.750% | 0.6 % |
| Cloud Software Group, Inc. 09/30/2029 9.000% | 0.6 % |
| Altice France SA 07/15/2029 5.125% | 0.6 % |
| BroadStreet Partners, Inc. 04/15/2029 5.875% | 0.6 % |
| ZoomInfo Technologies LLC/Finance Corp. 02/01/2029 3.875% | 0.6 % |
| [1] | Based on operations from October 2, 2024 (commencement of operations) through the stated period end. Had the class been open for the entire reporting period, expenses shown in the table above would have been higher. |
| [2] | Annualized. |