Shareholder Report
May 31, 2025
USD ($)
Holdings
columbiathreadneedleus.com/resources/literature
. You can also request more information by contacting us at 1-800-345-6611.
What were the Fund costs for the reporting period?
(Based on a hypothetical $10,000 investment)
| Class | Cost of a $10,000 investment | Cost paid as a percentage of a $10,000 investment |
| Class A | $ 104 | 1.00 % |
Management's Discussion of Fund Performance
The performance of Class A shares for the period presented is shown in the Average Annual Total Returns table.
Top Performance Contributors
Stock selection
| Selections in the information technology and consumer discretionary sectors boosted the Fund’s relative results most during the annual period.Allocations
| Underweight positions in the materials sector buoyed relative Fund results during the annual period.Individual holdings
| Positions in Philip Morris International, Inc., a tobacco and nicotine company, International Business Machines Corp., an information technology company, and Broadcom, Inc., a semiconductor company, were among the top contributors to Fund relative performance.Stock selection
the
Fund’s relative results during the annual period.Allocations
| Overweight positions in the energy sector detracted from relative performance.Individual holdings
| Positions in Merck & Co., Inc., a health care company, PepsiCo, Inc., a food, snack and beverage company, and Target Corp., a general merchandise company, were among the top detractors to relative performance during the period.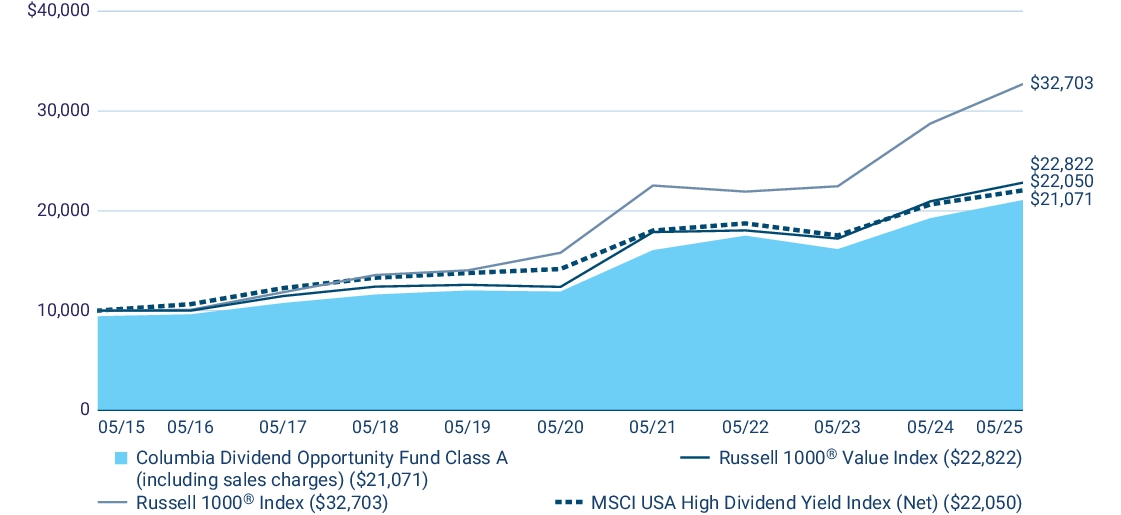
| Average Annual Total Returns (%) | 1 year | 5 years | 10 years |
| Class A (excluding sales charges) | 9.40 | 12.10 | 8.37 |
| Class A (including sales charges) | 3.12 | 10.78 | 7.74 |
| Russell 1000® Value Index | 8.91 | 13.02 | 8.60 |
| Russell 1000® Index | 13.73 | 15.66 | 12.58 |
| MSCI USA High Dividend Yield Index (Net) (a) | 6.83 | 9.25 | 8.23 |
(a) | Effective March 28, 2025, the Fund no longer compares its performance to the MSCI USA High Dividend Yield Index (Net). The returns of the MSCI USA High Dividend Yield Index (Net) will be shown for a one-year transition period. |
columbiathreadneedleus.com/investment-products/mutual-funds
for more recent performance information.
Key Fund Statistics
Fund net assets | $ 2,066,758,424 |
Total number of portfolio holdings | 88 |
Management services fees (represents 0.64% of Fund average net assets) | $ 13,627,946 |
Portfolio turnover for the reporting period | 36% |
Graphical Representation of Fund Holdings
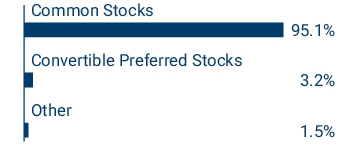
The tables below show the investment makeup of the Fund represented as a percentage of Fund net assets. Derivatives are excluded from the tables unless otherwise noted. The Fund's portfolio composition is subject to change.
Top Holdings
| Exxon Mobil Corp. | 3.8 % |
| JPMorgan Chase & Co. | 3.5 % |
| Philip Morris International, Inc. | 2.9 % |
| AbbVie, Inc. | 2.8 % |
| International Business Machines Corp. | 2.7 % |
| Cisco Systems, Inc. | 2.6 % |
| Johnson & Johnson | 2.3 % |
| Goldman Sachs Group, Inc. (The) | 2.4 % |
| Coca-Cola Co. (The) | 2.1 % |
| Chevron Corp. | 2.1 % |
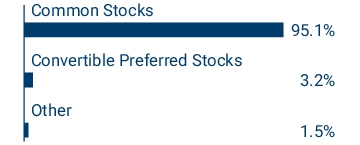
Asset Categories

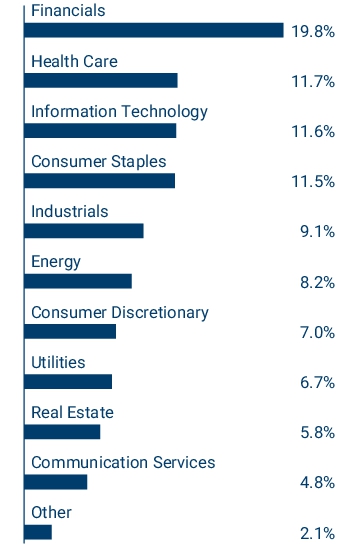
Equity Sector Allocation

Top Holdings
| Exxon Mobil Corp. | 3.8 % |
| JPMorgan Chase & Co. | 3.5 % |
| Philip Morris International, Inc. | 2.9 % |
| AbbVie, Inc. | 2.8 % |
| International Business Machines Corp. | 2.7 % |
| Cisco Systems, Inc. | 2.6 % |
| Johnson & Johnson | 2.3 % |
| Goldman Sachs Group, Inc. (The) | 2.4 % |
| Coca-Cola Co. (The) | 2.1 % |
| Chevron Corp. | 2.1 % |
columbiathreadneedleus.com/resources/literature
. You can also request more information by contacting us at 1-800-345-6611.
What were the Fund costs for the reporting period?
(Based on a hypothetical $10,000 investment)
| Class | Cost of a $10,000 investment | Cost paid as a percentage of a $10,000 investment |
| Class C | $ 182 | 1.75 % |
Management's Discussion of Fund Performance
The performance of Class C shares for the period
presented
is shown in the Average Annual Total Returns table.Top Performance Contributors
Stock selection
| Selections in the information technology and consumer discretionary sectors boosted the Fund’s relative results most during the annual period.Allocations
| Underweight positions in the materials sector buoyed relative Fund results during the annual period.Individual holdings
| Positions in Philip Morris International, Inc., a tobacco and nicotine company, International Business Machines Corp., an information technology company, and Broadcom, Inc., a semiconductor company, were among the top contributors to Fund relative performance.Top Performance Detractors
Stock selection
Allocations
| Overweight positions in the energy sector detracted from relative performance.Individual holdings
| Positions in Merck & Co., Inc., a health care company, PepsiCo, Inc., a food, snack and beverage company, and Target Corp., a general merchandise company, were among the top detractors to relative performance during the period.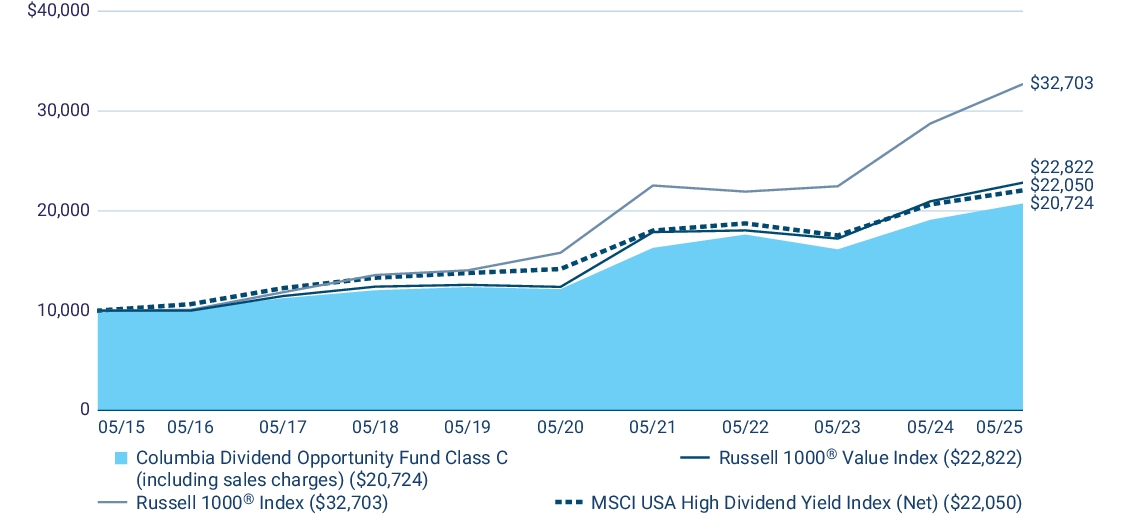
| Average Annual Total Returns (%) | 1 year | 5 years | 10 years |
| Class C (excluding sales charges) | 8.56 | 11.29 | 7.56 |
| Class C (including sales charges) | 7.56 | 11.29 | 7.56 |
| Russell 1000® Value Index | 8.91 | 13.02 | 8.60 |
| Russell 1000® Index | 13.73 | 15.66 | 12.58 |
| MSCI USA High Dividend Yield Index (Net) (a) | 6.83 | 9.25 | 8.23 |
(a) | Effective March 28, 2025, the Fund no longer compares its performance to the MSCI USA High Dividend Yield Index (Net). The returns of the MSCI USA High Dividend Yield Index (Net) will be shown for a one-year transition period. |
columbiathreadneedleus.com/investment-products/mutual-funds
for more recent performance information.
Key
Fund
StatisticsFund net assets | $ 2,066,758,424 |
Total number of portfolio holdings | 88 |
Management services fees (represents 0.64% of Fund average net assets) | $ 13,627,946 |
Portfolio turnover for the reporting period | 36% |
Graphical Representation of Fund Holdings
The tables below show the investment makeup of the Fund represented as a percentage of Fund net assets. Derivatives are excluded from the tables unless otherwise noted. The Fund's portfolio composition is subject to change.
Top Holdings
| Exxon Mobil Corp. | 3.8 % |
| JPMorgan Chase & Co. | 3.5 % |
| Philip Morris International, Inc. | 2.9 % |
| AbbVie, Inc. | 2.8 % |
| International Business Machines Corp. | 2.7 % |
| Cisco Systems, Inc. | 2.6 % |
| Johnson & Johnson | 2.3 % |
| Goldman Sachs Group, Inc. (The) | 2.4 % |
| Coca-Cola Co. (The) | 2.1 % |
| Chevron Corp. | 2.1 % |
Asset Categories

Equity Sector Allocation

Top Holdings
| Exxon Mobil Corp. | 3.8 % |
| JPMorgan Chase & Co. | 3.5 % |
| Philip Morris International, Inc. | 2.9 % |
| AbbVie, Inc. | 2.8 % |
| International Business Machines Corp. | 2.7 % |
| Cisco Systems, Inc. | 2.6 % |
| Johnson & Johnson | 2.3 % |
| Goldman Sachs Group, Inc. (The) | 2.4 % |
| Coca-Cola Co. (The) | 2.1 % |
| Chevron Corp. | 2.1 % |
columbiathreadneedleus.com/resources/literature
. You can also request more information by contacting us at 1-800-345-6611.
What were the Fund costs for the reporting period?
(Based on a hypothetical $10,000 investment)
| Class | Cost of a $10,000 investment | Cost paid as a percentage of a $10,000 investment |
| Institutional Class | $ 78 | 0.75 % |
Management's Discussion of Fund Performance
The performance of Institutional Class shares for the period presented is shown
in
the Average Annual Total Returns table.Top Performance Contributors
Stock selection
| Selections in the information technology and consumer discretionary sectors boosted the Fund’s relative results
most during the annual period.Allocations
| Underweight positions in the materials sector buoyed relative Fund results during the annual period.Individual holdings
| Positions in Philip Morris International, Inc., a tobacco and nicotine company, International Business Machines Corp., an information technology company, and Broadcom, Inc., a semiconductor company, were among the top contributors to Fund relative performance.Stock selection
Allocations
| Overweight positions in the energy sector detracted from relative performance.Individual holdings
| Positions in Merck & Co., Inc.
, a health care company, PepsiCo, Inc., a food, snack and beverage company, and Target Corp., a general merchandise company, were among the top detractors to relative performance during the period.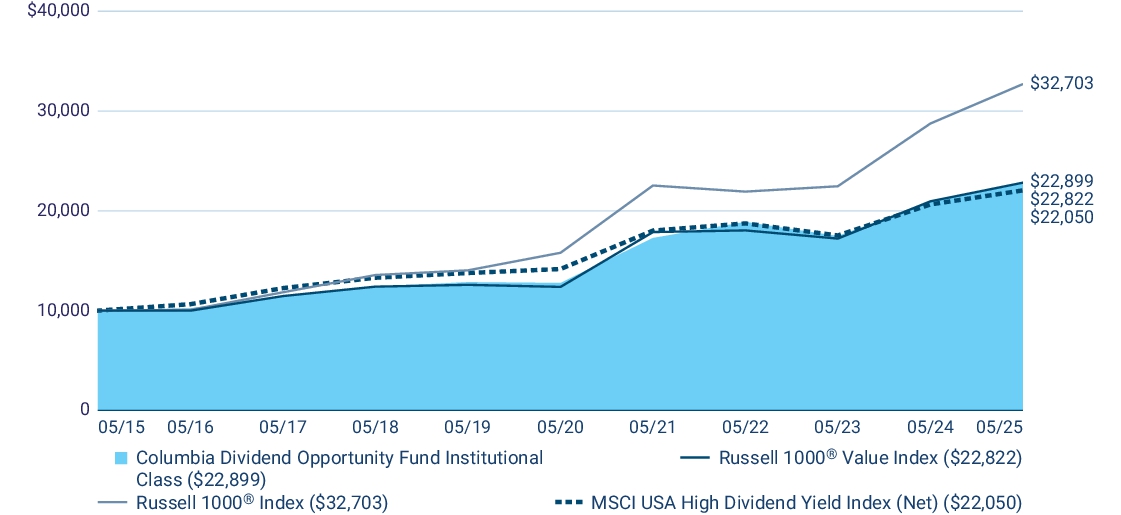
| Average Annual Total Returns (%) | 1 year | 5 years | 10 years |
| Institutional Class | 9.66 | 12.39 | 8.64 |
| Russell 1000® Value Index | 8.91 | 13.02 | 8.60 |
| Russell 1000® Index | 13.73 | 15.66 | 12.58 |
| MSCI USA High Dividend Yield Index (Net) (a) | 6.83 | 9.25 | 8.23 |
(a) | Effective March 28, 2025, the Fund no longer compares its performance to the MSCI USA High Dividend Yield Index (Net). The returns of the MSCI USA High Dividend Yield Index (Net) will be shown for a one-year transition period. |
columbiathreadneedleus.com/investment-products/mutual-funds
for more recent performance information.
Key Fund Statistics
Fund net assets | $ 2,066,758,424 |
Total number of portfolio holdings | 88 |
Management services fees (represents 0.64% of Fund average net assets) | $ 13,627,946 |
Portfolio turnover for the reporting period | 36% |
Graphical Representation of Fund Holdings
The tables below show the investment makeup of the Fund represented as a percentage of Fund net assets. Derivatives are excluded from the tables unless otherwise noted. The Fund's portfolio composition is subject to change.
Top Holdings
| Exxon Mobil Corp. | 3.8 % |
| JPMorgan Chase & Co. | 3.5 % |
| Philip Morris International, Inc. | 2.9 % |
| AbbVie, Inc. | 2.8 % |
| International Business Machines Corp. | 2.7 % |
| Cisco Systems, Inc. | 2.6 % |
| Johnson & Johnson | 2.3 % |
| Goldman Sachs Group, Inc. (The) | 2.4 % |
| Coca-Cola Co. (The) | 2.1 % |
| Chevron Corp. | 2.1 % |
Asset Categories

Equity Sector Allocation

Top Holdings
| Exxon Mobil Corp. | 3.8 % |
| JPMorgan Chase & Co. | 3.5 % |
| Philip Morris International, Inc. | 2.9 % |
| AbbVie, Inc. | 2.8 % |
| International Business Machines Corp. | 2.7 % |
| Cisco Systems, Inc. | 2.6 % |
| Johnson & Johnson | 2.3 % |
| Goldman Sachs Group, Inc. (The) | 2.4 % |
| Coca-Cola Co. (The) | 2.1 % |
| Chevron Corp. | 2.1 % |
columbiathreadneedleus.com/resources/literature
. You can also request more information by contacting us at 1-800-345-6611.
What were the Fund costs for the reporting period?
(Based on a hypothetical $10,000 investment)
| Class | Cost of a $10,000 investment | Cost paid as a percentage of a $10,000 investment |
| Institutional 2 Class | $ 74 | 0.71 % |
Management's Discussion of Fund Performance
The performance of Institutional 2 Class shares for the period presented is shown in the Average Annual Total Returns table.
Top Performance Contributors
Stock selection
| Selections in the information technology and consumer discretionary sectors boosted the Fund’s relative results most during the annual period.Allocations
| Underweight positions in the materials sector buoyed relative Fund results during the annual period.Individual holdings
| Positions in Philip Morris International, Inc., a tobacco and nicotine company, International Business Machines Corp., an information technology company, and Broadcom, Inc., a semiconductor company, were among the top contributors to Fund relative performance.Top Performance Detractors
Stock selection
Allocations
| Overweight positions in the energy sector detracted from relative performance.Individual holdings
| Positions in Merck & Co., Inc., a health care company, PepsiCo, Inc., a food, snack and beverage company, and Target Corp., a general merchandise company, were among the top detractors to relative performance during the period.
| Average Annual Total Returns (%) | 1 year | 5 years | 10 years |
| Institutional 2 Class | 9.69 | 12.44 | 8.70 |
| Russell 1000® Value Index | 8.91 | 13.02 | 8.60 |
| Russell 1000® Index | 13.73 | 15.66 | 12.58 |
| MSCI USA High Dividend Yield Index (Net) (a) | 6.83 | 9.25 | 8.23 |
(a) | Effective March 28, 2025, the Fund no longer compares its performance to the MSCI USA High Dividend Yield Index (Net). The returns of the MSCI USA High Dividend Yield Index (Net) will be shown for a one-year transition period. |
columbiathreadneedleus.com/investment-products/mutual-funds
for more recent performance information.
Key Fund Statistics
Fund net assets | $ 2,066,758,424 |
Total number of portfolio holdings | 88 |
Management services fees (represents 0.64% of Fund average net assets) | $ 13,627,946 |
Portfolio turnover for the reporting period | 36% |
Graphical Representation of Fund Holdings
The tables below show the investment makeup of the Fund represented as a percentage of Fund net assets. Derivatives are excluded from the tables unless otherwise noted. The Fund's portfolio composition is subject to change.
Top Holdings
| Exxon Mobil Corp. | 3.8 % |
| JPMorgan Chase & Co. | 3.5 % |
| Philip Morris International, Inc. | 2.9 % |
| AbbVie, Inc. | 2.8 % |
| International Business Machines Corp. | 2.7 % |
| Cisco Systems, Inc. | 2.6 % |
| Johnson & Johnson | 2.3 % |
| Goldman Sachs Group, Inc. (The) | 2.4 % |
| Coca-Cola Co. (The) | 2.1 % |
| Chevron Corp. | 2.1 % |
Asset Categories

Equity Sector Allocation

Top Holdings
| Exxon Mobil Corp. | 3.8 % |
| JPMorgan Chase & Co. | 3.5 % |
| Philip Morris International, Inc. | 2.9 % |
| AbbVie, Inc. | 2.8 % |
| International Business Machines Corp. | 2.7 % |
| Cisco Systems, Inc. | 2.6 % |
| Johnson & Johnson | 2.3 % |
| Goldman Sachs Group, Inc. (The) | 2.4 % |
| Coca-Cola Co. (The) | 2.1 % |
| Chevron Corp. | 2.1 % |
columbiathreadneedleus.com/resources/literature
. You can also request more information by contacting us at 1-800-345-6611.
What were the Fund costs for the reporting period?
(Based on a hypothetical $10,000 investment)
| Class | Cost of a $10,000 investment | Cost paid as a pe rcenta ge of a $10,000 investment |
| Institutional 3 Class | $ 70 | 0.67 % |
Management's Discussion of Fund Performance
The performance of Institutional 3 Class shares for the period presented is shown in the Average Annual Total Returns table.
Top Performance Contributors
Stock selection
| Selections in the information technology and consumer discretionary sectors boosted the Fund’s relative results most during the annual period.Allocations
| Underweight positions in the materials sector buoyed relative Fund results during the annual period.Individual holdings
| Positions in Philip Morris International, Inc., a tobacco and nicotine company, International Business Machines Corp., an information technology company, and Broadcom, Inc., a semiconductor company, were among the top contributors to Fund relative performance.Top Performance Detractors
Stock selection
Allocations
| Overweight positions in the energy sector detracted from relative performance.Individual holdings
| Positions in Merck & Co., Inc., a health care company, PepsiCo, Inc., a food, snack and beverage company, and Target Corp., a general merchandise company, were among the top detractors to relative performance during the period.
| Average Annual Total Returns (%) | 1 year | 5 years | 10 years |
| Institutional 3 Class | 9.78 | 12.49 | 8.76 |
| Russell 1000® Value Index | 8.91 | 13.02 | 8.60 |
| Russell 1000® Index | 13.73 | 15.66 | 12.58 |
| MSCI USA High Dividend Yield Index (Net) (a) | 6.83 | 9.25 | 8.23 |
(a) | Effective March 28, 2025, the Fund no longer compares its performance to the MSCI USA High Dividend Yield Index (Net). The returns of the MSCI USA High Dividend Yield Index (Net) will be shown for a one-year transition period. |
columbiathreadneedleus.com/investment-products/mutual-funds
for more recent performance information.
Key Fund Statistics
Fund net assets | $ 2,066,758,424 |
Total number of portfolio holdings | 88 |
Management services fees (represents 0.64% of Fund average net assets) | $ 13,627,946 |
Portfolio turnover for the reporting period | 36% |
Top Holdings
| Exxon Mobil Corp. | 3.8 % |
| JPMorgan Chase & Co. | 3.5 % |
| Philip Morris International, Inc. | 2.9 % |
| AbbVie, Inc. | 2.8 % |
| International Business Machines Corp. | 2.7 % |
| Cisco Systems, Inc. | 2.6 % |
| Johnson & Johnson | 2.3 % |
| Goldman Sachs Group, Inc. (The) | 2.4 % |
| Coca-Cola Co. (The) | 2.1 % |
| Chevron Corp. | 2.1 % |
Asset Categories
Equity Sector Allocation
Top Holdings
| Exxon Mobil Corp. | 3.8 % |
| JPMorgan Chase & Co. | 3.5 % |
| Philip Morris International, Inc. | 2.9 % |
| AbbVie, Inc. | 2.8 % |
| International Business Machines Corp. | 2.7 % |
| Cisco Systems, Inc. | 2.6 % |
| Johnson & Johnson | 2.3 % |
| Goldman Sachs Group, Inc. (The) | 2.4 % |
| Coca-Cola Co. (The) | 2.1 % |
| Chevron Corp. | 2.1 % |
columbiathreadneedleus.com/resources/literature
. You can also request more information by contacting us at 1-800-345-6611.
What were the Fund costs for the reporting period?
(Based on a hypothetical $10,000 investment)
| Class | Cost of a $10,000 investment | Cost paid as a pe rce ntage of a $10,000 investment |
| Class R | $ 130 | 1.25 % |
Management's Discussion of Fund Performance
The performance of Class R shares for the period presented is shown in the Average Annual Total Returns table.
Top Performance Contributors
Stock selection
| Selections in the information technology and consumer discretionary sectors boosted the Fund’s relative results most during the annual period.Allocations
| Underweight positions in the materials sector buoyed relative Fund results during the annual period.Individual holdings
| Positions in Philip Morris International, Inc., a tobacco and nicotine company, International Business Machines Corp., an information technology company, and Broadcom, Inc., a semiconductor company, were among the top contributors to Fund relative performance.Top Performance Detractors
Stock selection
Allocations
| Overweight positions in the energy sector detracted from relative performance.Individual holdings
| Positions in Merck & Co., Inc., a health care company, PepsiCo, Inc., a food, snack and beverage company, and Target Corp., a general merchandise company, were among the top detractors to relative performance during the period.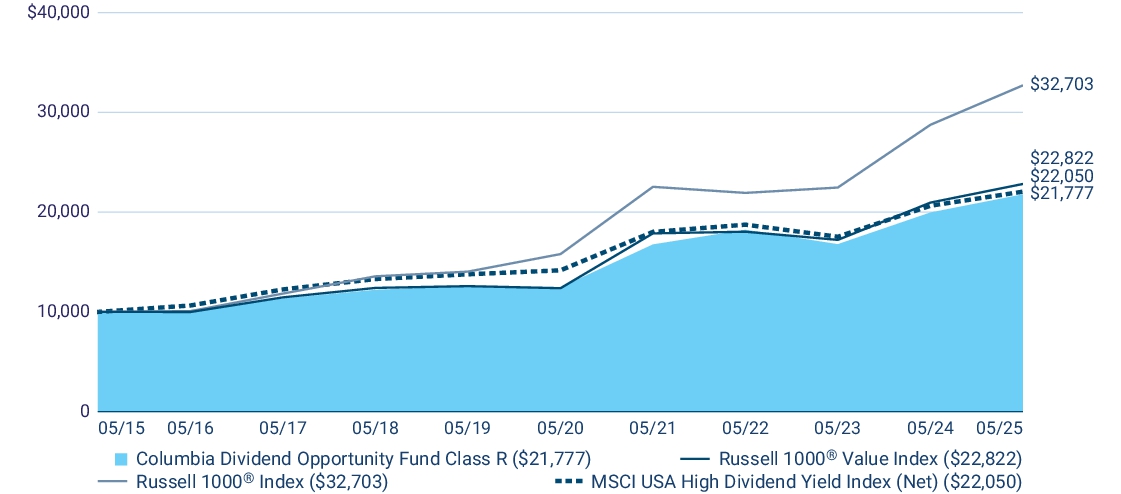
| Average Annual Total Returns (%) | 1 year | 5 years | 10 years |
| Class R | 9.11 | 11.83 | 8.09 |
| Russell 1000® Value Index | 8.91 | 13.02 | 8.60 |
| Russell 1000® Index | 13.73 | 15.66 | 12.58 |
| MSCI USA High Dividend Yield Index (Net) (a) | 6.83 | 9.25 | 8.23 |
(a) | Effective March 28, 2025, the Fund no longer compares its performance to the MSCI USA High Dividend Yield Index (Net). The returns of the MSCI USA High Dividend Yield Index (Net) will be shown for a one-year tran siti on period. |
siti
on period.
columbiathreadneedleus.com/investment-products/mutual-funds
for more recent performance information.
Key Fund Statistics
Fund net assets | $ 2,066,758,424 |
Total number of portfolio holdings | 88 |
Management services fees (represents 0.64% of Fund average net assets) | $ 13,627,946 |
Portfolio turnover for the reporting period | 36% |
Graphical Representation of Fund Holdings
The tables below show the investment makeup of the Fund represented as a percentage of Fund net assets. Derivatives are excluded from the tables unless otherwise noted. The Fund's portfolio composition is subject to
cha
nge.Top Holdings
| Exxon Mobil Corp. | 3.8 % |
| JPMorgan Chase & Co. | 3.5 % |
| Philip Morris International, Inc. | 2.9 % |
| AbbVie, Inc. | 2.8 % |
| International Business Machines Corp. | 2.7 % |
| Cisco Systems, Inc. | 2.6 % |
| Johnson & Johnson | 2.3 % |
| Goldman Sachs Group, Inc. (The) | 2.4 % |
| Coca-Cola Co. (The) | 2.1 % |
| Chevron Corp. | 2.1 % |
Asset Categories

Equity Sector Allocation

Top Holdings
| Exxon Mobil Corp. | 3.8 % |
| JPMorgan Chase & Co. | 3.5 % |
| Philip Morris International, Inc. | 2.9 % |
| AbbVie, Inc. | 2.8 % |
| International Business Machines Corp. | 2.7 % |
| Cisco Systems, Inc. | 2.6 % |
| Johnson & Johnson | 2.3 % |
| Goldman Sachs Group, Inc. (The) | 2.4 % |
| Coca-Cola Co. (The) | 2.1 % |
| Chevron Corp. | 2.1 % |
columbiathreadneedleus.com/resources/literature
. You can also request more information by contacting us at 1-800-345-6611.
What were the Fund costs for the reporting period?
(Based on a hypothetical $10,000 investment)
| Class | Cost of a $10,000 investment | Cost paid as a percentage of a $10,000 investment |
| Class S | $ 49(a) | 0.75 % (b) |
| (a) | Based on operations from October 2, 2024 (commencement of operations) through the stated period end. Had the class been open for the entire reporting period, expenses shown in the table above would have been higher. |
| (b) | Annualized. |
Management's Discussion of Fund Performance
The performance of Class S shares for the period presented is shown in the Average Annual Total Returns table.
Top Performance Contributors
Stock selection
| Selections in the information technology and consumer discretionary sectors boosted the Fund’s relative results most during the annual period.Allocations
| Underweight positions in the materials sector buoyed relative Fund results during the annual period.Individual holdings
| Positions in Philip Morris International, Inc., a tobacco and nicotine company, International Business Machines Corp., an information technology company, and Broadcom, Inc., a semiconductor company, were among the top contributors to Fund relative performance.Top Performance Detractors
Stock selection
Allocations
| Overweight positions in the energy sector detracted from relative performance.Individual holdings
| Positions in Merck & Co., Inc., a health care company, PepsiCo, Inc., a food, snack and beverage company, and Target Corp., a general merchandise company, were among the top detractors to relative performance during the period.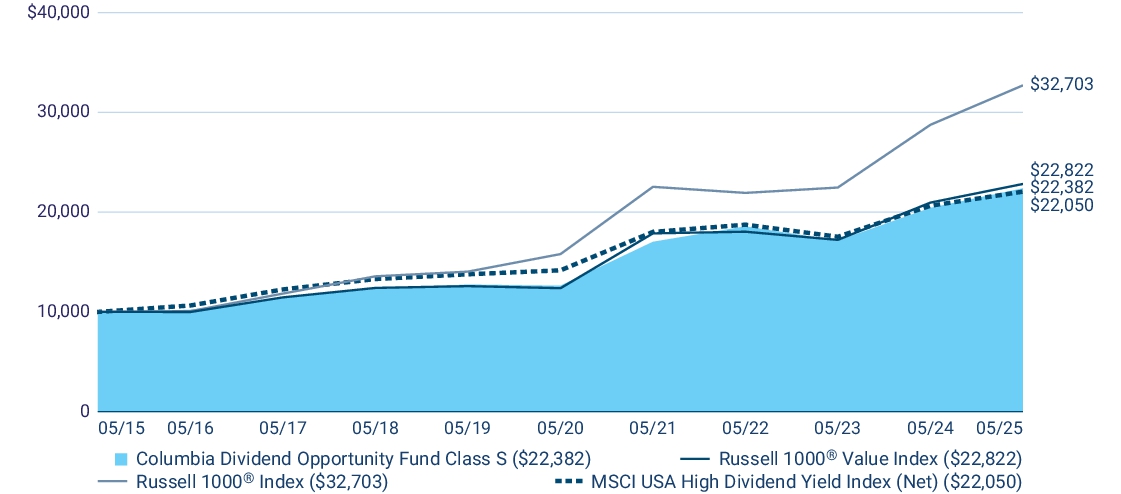
| Average Annual Total Returns (%) | 1 year | 5 years | 10 years |
| Class S (a) | 9.57 | 12.13 | 8.39 |
| Russell 1000® Value Index | 8.91 | 13.02 | 8.60 |
| Russell 1000® Index | 13.73 | 15.66 | 12.58 |
| MSCI USA High Dividend Yield Index (Net) (b) | 6.83 | 9.25 | 8.23 |
(a) | The returns shown for periods prior to October 2, 2024 (including Since Fund Inc e ption returns, if shown) include the returns of Cla ss A. These returns are adjusted to reflect any higher class-related operating expenses of the newer share classes, as applicable. Please visit columbiathreadneedleus.com/investment-products/mutual-funds/appended-performance for more information. |
(b) | Effective March 28, 2025, the Fund no longer compares its performance to the MSCI USA High Dividend Yield Index (Net). The returns of the MSCI USA High Dividend Yield Index (Net) will be shown for a one-year transition period. |
columbiathreadneedleus.com/investment-products/mutual-funds
for more recent performance information.
Key Fund Statistics
Fund net assets | $ 2,066,758,424 |
Total number of portfolio holdings | 88 |
Management services fees (represents 0.64% of Fund average net assets) | $ 13,627,946 |
Portfolio turnover for the reporting period | 36% |
Graphical Representation of Fund Holdings
The tables below show the investment makeup of the Fund repr
ese
nted as a percentag
e of Fund net assets. Derivatives are excluded from the tables unless otherwise noted. The Fund's portfolio composition is subject to change.Top Holdings
| Exxon Mobil Corp. | 3.8 % |
| JPMorgan Chase & Co. | 3.5 % |
| Philip Morris International, Inc. | 2.9 % |
| AbbVie, Inc. | 2.8 % |
| International Business Machines Corp. | 2.7 % |
| Cisco Systems, Inc. | 2.6 % |
| Johnson & Johnson | 2.3 % |
| Goldman Sachs Group, Inc. (The) | 2.4 % |
| Coca-Cola Co. (The) | 2.1 % |
| Chevron Corp. | 2.1 % |
Asset Categories
Equity Sector Allocation

Top Holdings
| Exxon Mobil Corp. | 3.8 % |
| JPMorgan Chase & Co. | 3.5 % |
| Philip Morris International, Inc. | 2.9 % |
| AbbVie, Inc. | 2.8 % |
| International Business Machines Corp. | 2.7 % |
| Cisco Systems, Inc. | 2.6 % |
| Johnson & Johnson | 2.3 % |
| Goldman Sachs Group, Inc. (The) | 2.4 % |
| Coca-Cola Co. (The) | 2.1 % |
| Chevron Corp. | 2.1 % |
| [1] | Based on operations from October 2, 2024 (commencement of operations) through the stated period end. Had the class been open for the entire reporting period, expenses shown in the table above would have been higher. |
| [2] | Annualized. |