Shareholder Report
|
6 Months Ended |
|
May 31, 2025
USD ($)
Holding
|
|---|
| Shareholder Report [Line Items] |
|
| Document Type |
N-CSRS
|
| Amendment Flag |
false
|
| Registrant Name |
Ultimus Managers Trust
|
| Entity Central Index Key |
0001545440
|
| Entity Investment Company Type |
N-1A
|
| Document Period End Date |
May 31, 2025
|
| C000123053 |
|
| Shareholder Report [Line Items] |
|
| Fund Name |
Lyrical U.S. Value Equity Fund
|
| Class Name |
Institutional Class
|
| Trading Symbol |
LYRIX
|
| Annual or Semi-Annual Statement [Text Block] |
This semi-annual shareholder report contains important information about Lyrical U.S. Value Equity Fund for the period of December 1, 2024 to May 31, 2025.
|
| Shareholder Report Annual or Semi-Annual |
Semi-Annual Shareholder Report
|
| Additional Information [Text Block] |
You can find additional information about the Fund at www.lyricalvaluefunds.com. You can also request this information by contacting us at (888) 884-8099.
|
| Additional Information Phone Number |
(888) 884-8099
|
| Additional Information Website |
www.lyricalvaluefunds.com
|
| Expenses [Text Block] |
What were the Fund’s annualized costs for the last six months?(based on a hypothetical $10,000 investment)Class Name | Costs of a $10,000 investment | Costs paid as a percentage of a $10,000 investment |
|---|
Institutional Class | $49 | 0.99% |
|---|
|
| Expenses Paid, Amount |
$ 49
|
| Expense Ratio, Percent |
0.99%
|
| Factors Affecting Performance [Text Block] |
How did the Fund perform during the reporting period? The Fund performed well during the reporting period, especially given the market environment. Our returns exceeded those of the S&P 500® Index, which was no easy task given how much of the index's returns were driven by mega cap growth stocks. In fact, mega cap growth stocks had such a large impact on the S&P 500® Index return; it outperformed the S&P 500® Equal Weight index by 3.6 percentage points. For the reporting period, the three positions that most positively impacted performance were: NRG Energy, Inc. (NRG) up 55%, Johnson Controls International plc (JCI) up 22%, and Uber Technologies, Inc. (UBER) up 17%. On the other side, the three positions that most negatively impacted performance were: Global Payments, Inc. (GPN) down 36%, United Rentals, Inc. (URI) down 18%, and Corpay, Inc. (CNC) down 15%. The portfolio remains attractively valued with a price-to-earnings (P/E) ratio of 12.4 times next twelve months consensus earnings at period end. On this same basis the S&P 500® Index had a valuation of 21.5 times earnings, a premium of 73% to the Fund. What is uncommon about our portfolio is not only its low valuation but also its attractive growth. Throughout our history our portfolios have had a discounted P/E to the S&P 500® Index with comparable growth. Currently, our growth profile is much better than that, with not just comparable growth, but superior growth. In fact, this continues to be one of the best growth profiles in our firm’s history. |
| Performance Past Does Not Indicate Future [Text] |
Past performance is not necessarily indicative of future results.
|
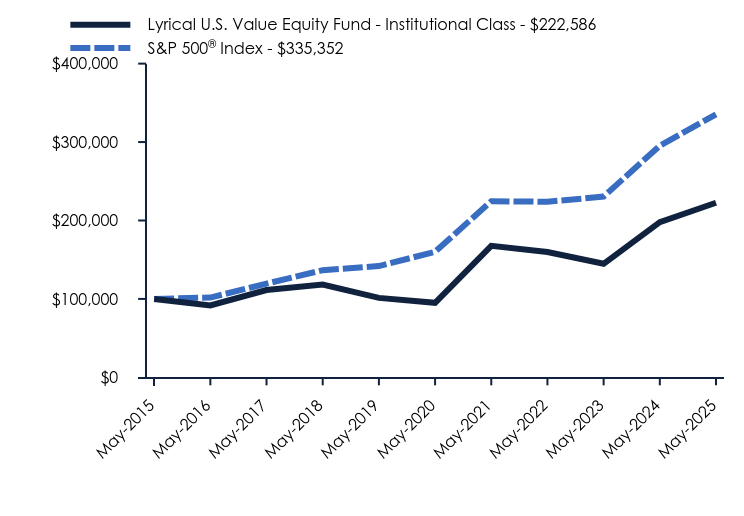
| Line Graph [Table Text Block] |
| Lyrical U.S. Value Equity Fund - Institutional Class | S&P 500® Index |
|---|
May-2015 | $100,000 | $100,000 |
|---|
May-2016 | $91,763 | $101,716 |
|---|
May-2017 | $111,329 | $119,484 |
|---|
May-2018 | $118,234 | $136,671 |
|---|
May-2019 | $101,331 | $141,841 |
|---|
May-2020 | $94,978 | $160,050 |
|---|
May-2021 | $167,650 | $224,579 |
|---|
May-2022 | $159,827 | $223,907 |
|---|
May-2023 | $144,770 | $230,448 |
|---|
May-2024 | $197,845 | $295,404 |
|---|
May-2025 | $222,586 | $335,352 |
|---|
|
| Average Annual Return [Table Text Block] |
| 1 Year | 5 Years | 10 Years |
|---|
Lyrical U.S. Value Equity Fund - Institutional Class | 12.51% | 18.57% | 8.33% |
|---|
S&P 500® Index | 13.52% | 15.94% | 12.86% |
|---|
|
| No Deduction of Taxes [Text Block] |
The graph and table do not reflect the deduction of taxes that a shareholder would pay on fund distributions or redemption of fund shares.
|
| AssetsNet |
$ 1,050,349,358
|
| Holdings Count | Holding |
34
|
| Advisory Fees Paid, Amount |
$ 4,518,656
|
| InvestmentCompanyPortfolioTurnover |
10.00%
|
| Additional Fund Statistics [Text Block] |
- Net Assets$1,050,349,358
- Number of Portfolio Holdings34
- Advisory Fee (net of waivers & recoupments)$4,518,656
- Portfolio Turnover10%
|
| Holdings [Text Block] |
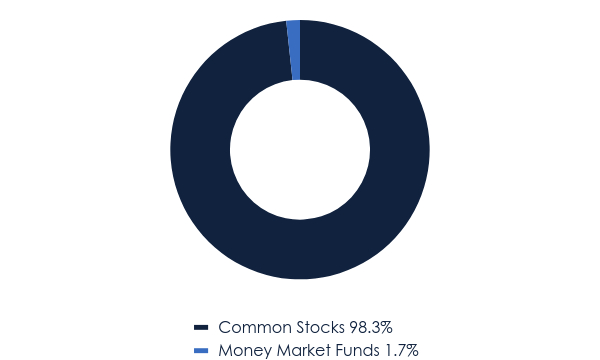
Asset Weighting (% of total investments)Value | Value |
|---|
Common Stocks | 98.3% | Money Market Funds | 1.7% |
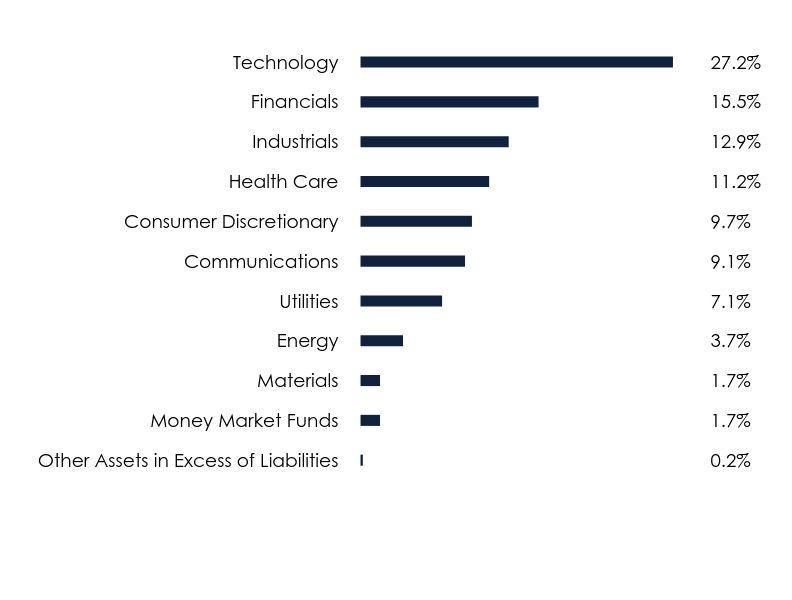
Sector Weighting (% of net assets)Value | Value |
|---|
Other Assets in Excess of Liabilities | 0.2% | Money Market Funds | 1.7% | Materials | 1.7% | Energy | 3.7% | Utilities | 7.1% | Communications | 9.1% | Consumer Discretionary | 9.7% | Health Care | 11.2% | Industrials | 12.9% | Financials | 15.5% | Technology | 27.2% |
Top 10 Holdings (% of net assets)Holding Name | % of Net Assets |
|---|
NRG Energy, Inc. | 7.1% |
|---|
United Rentals, Inc. | 5.7% |
|---|
Johnson Controls International plc | 5.5% |
|---|
Uber Technologies, Inc. | 4.9% |
|---|
Fidelity National Information Services, Inc. | 4.8% |
|---|
eBay, Inc. | 4.6% |
|---|
Corpay, Inc. | 4.4% |
|---|
Ameriprise Financial, Inc. | 4.3% |
|---|
AerCap Holdings N.V. | 4.3% |
|---|
Expedia Group, Inc. | 4.2% |
|---|
|
| Material Fund Change [Text Block] |
No material changes occurred during the period ended May 31, 2025. |
| C000138389 |
|
| Shareholder Report [Line Items] |
|
| Fund Name |
Lyrical U.S. Value Equity Fund
|
| Class Name |
Investor Class
|
| Trading Symbol |
LYRBX
|
| Annual or Semi-Annual Statement [Text Block] |
This semi-annual shareholder report contains important information about Lyrical U.S. Value Equity Fund for the period of December 1, 2024 to May 31, 2025.
|
| Shareholder Report Annual or Semi-Annual |
Semi-Annual Shareholder Report
|
| Additional Information [Text Block] |
You can find additional information about the Fund at www.lyricalvaluefunds.com. You can also request this information by contacting us at (888) 884-8099.
|
| Additional Information Phone Number |
(888) 884-8099
|
| Additional Information Website |
www.lyricalvaluefunds.com
|
| Expenses [Text Block] |
What were the Fund’s annualized costs for the last six months?(based on a hypothetical $10,000 investment)Class Name | Costs of a $10,000 investment | Costs paid as a percentage of a $10,000 investment |
|---|
Investor Class | $61 | 1.24% |
|---|
|
| Expenses Paid, Amount |
$ 61
|
| Expense Ratio, Percent |
1.24%
|
| Factors Affecting Performance [Text Block] |
How did the Fund perform during the reporting period? The Fund performed well during the reporting period, especially given the market environment. Our returns exceeded those of the S&P 500® Index, which was no easy task given how much of the index's returns were driven by mega cap growth stocks. In fact, mega cap growth stocks had such a large impact on the S&P 500® Index return; it outperformed the S&P 500® Equal Weight index by 3.6 percentage points. For the reporting period, the three positions that most positively impacted performance were: NRG Energy, Inc. (NRG) up 55%, Johnson Controls International plc (JCI) up 22%, and Uber Technologies, Inc. (UBER) up 17%. On the other side, the three positions that most negatively impacted performance were: Global Payments, Inc. (GPN) down 36%, United Rentals, Inc. (URI) down 18%, and Corpay, Inc. (CNC) down 15%. The portfolio remains attractively valued with a price-to-earnings (P/E) ratio of 12.4 times next twelve months consensus earnings at period end. On this same basis the S&P 500® Index had a valuation of 21.5 times earnings, a premium of 73% to the Fund. What is uncommon about our portfolio is not only its low valuation but also its attractive growth. Throughout our history our portfolios have had a discounted P/E to the S&P 500® Index with comparable growth. Currently, our growth profile is much better than that, with not just comparable growth, but superior growth. In fact, this continues to be one of the best growth profiles in our firm’s history. |
| Performance Past Does Not Indicate Future [Text] |
Past performance is not necessarily indicative of future results.
|
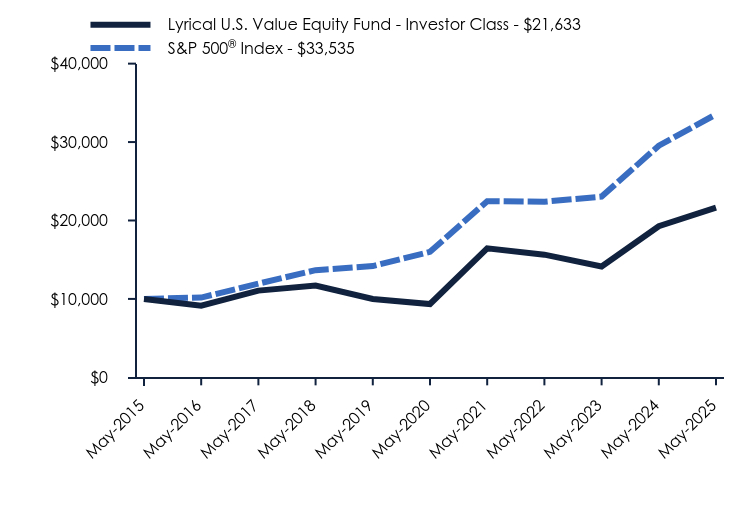
| Line Graph [Table Text Block] |
| Lyrical U.S. Value Equity Fund - Investor Class | S&P 500® Index |
|---|
May-2015 | $10,000 | $10,000 |
|---|
May-2016 | $9,146 | $10,172 |
|---|
May-2017 | $11,058 | $11,948 |
|---|
May-2018 | $11,704 | $13,667 |
|---|
May-2019 | $9,992 | $14,184 |
|---|
May-2020 | $9,348 | $16,005 |
|---|
May-2021 | $16,455 | $22,458 |
|---|
May-2022 | $15,640 | $22,391 |
|---|
May-2023 | $14,132 | $23,045 |
|---|
May-2024 | $19,273 | $29,540 |
|---|
May-2025 | $21,633 | $33,535 |
|---|
|
| Average Annual Return [Table Text Block] |
| 1 Year | 5 Years | 10 Years |
|---|
Lyrical U.S. Value Equity Fund - Investor Class | 12.25% | 18.27% | 8.02% |
|---|
S&P 500® Index | 13.52% | 15.94% | 12.86% |
|---|
|
| No Deduction of Taxes [Text Block] |
The graph and table do not reflect the deduction of taxes that a shareholder would pay on fund distributions or redemption of fund shares.
|
| AssetsNet |
$ 1,050,349,358
|
| Holdings Count | Holding |
34
|
| Advisory Fees Paid, Amount |
$ 4,518,656
|
| InvestmentCompanyPortfolioTurnover |
10.00%
|
| Additional Fund Statistics [Text Block] |
- Net Assets$1,050,349,358
- Number of Portfolio Holdings34
- Advisory Fee (net of waivers & recoupments)$4,518,656
- Portfolio Turnover10%
|
| Holdings [Text Block] |
Asset Weighting (% of total investments)Value | Value |
|---|
Common Stocks | 98.3% | Money Market Funds | 1.7% |
Sector Weighting (% of net assets)Value | Value |
|---|
Other Assets in Excess of Liabilities | 0.2% | Money Market Funds | 1.7% | Materials | 1.7% | Energy | 3.7% | Utilities | 7.1% | Communications | 9.1% | Consumer Discretionary | 9.7% | Health Care | 11.2% | Industrials | 12.9% | Financials | 15.5% | Technology | 27.2% |
Top 10 Holdings (% of net assets)Holding Name | % of Net Assets |
|---|
NRG Energy, Inc. | 7.1% |
|---|
United Rentals, Inc. | 5.7% |
|---|
Johnson Controls International plc | 5.5% |
|---|
Uber Technologies, Inc. | 4.9% |
|---|
Fidelity National Information Services, Inc. | 4.8% |
|---|
eBay, Inc. | 4.6% |
|---|
Corpay, Inc. | 4.4% |
|---|
Ameriprise Financial, Inc. | 4.3% |
|---|
AerCap Holdings N.V. | 4.3% |
|---|
Expedia Group, Inc. | 4.2% |
|---|
|
| Material Fund Change [Text Block] |
No material changes occurred during the period ended May 31, 2025. |
| C000236986 |
|
| Shareholder Report [Line Items] |
|
| Fund Name |
Lyrical U.S. Value Equity Fund
|
| Class Name |
A Class
|
| Trading Symbol |
LYRAX
|
| Annual or Semi-Annual Statement [Text Block] |
This semi-annual shareholder report contains important information about Lyrical U.S. Value Equity Fund for the period of December 1, 2024 to May 31, 2025.
|
| Shareholder Report Annual or Semi-Annual |
Semi-Annual Shareholder Report
|
| Additional Information [Text Block] |
You can find additional information about the Fund at www.lyricalvaluefunds.com. You can also request this information by contacting us at (888) 884-8099.
|
| Additional Information Phone Number |
(888) 884-8099
|
| Additional Information Website |
www.lyricalvaluefunds.com
|
| Expenses [Text Block] |
What were the Fund’s annualized costs for the last six months?(based on a hypothetical $10,000 investment)Class Name | Costs of a $10,000 investment | Costs paid as a percentage of a $10,000 investment |
|---|
A Class | $61 | 1.24% |
|---|
|
| Expenses Paid, Amount |
$ 61
|
| Expense Ratio, Percent |
1.24%
|
| Factors Affecting Performance [Text Block] |
How did the Fund perform during the reporting period? The Fund performed well during the reporting period, especially given the market environment. Our returns exceeded those of the S&P 500® Index, which was no easy task given how much of the index's returns were driven by mega cap growth stocks. In fact, mega cap growth stocks had such a large impact on the S&P 500® Index return; it outperformed the S&P 500® Equal Weight index by 3.6 percentage points. For the reporting period, the three positions that most positively impacted performance were: NRG Energy, Inc. (NRG) up 55%, Johnson Controls International plc (JCI) up 22%, and Uber Technologies, Inc. (UBER) up 17%. On the other side, the three positions that most negatively impacted performance were: Global Payments, Inc. (GPN) down 36%, United Rentals, Inc. (URI) down 18%, and Corpay, Inc. (CNC) down 15%. The portfolio remains attractively valued with a price-to-earnings (P/E) ratio of 12.4 times next twelve months consensus earnings at period end. On this same basis the S&P 500® Index had a valuation of 21.5 times earnings, a premium of 73% to the Fund. What is uncommon about our portfolio is not only its low valuation but also its attractive growth. Throughout our history our portfolios have had a discounted P/E to the S&P 500® Index with comparable growth. Currently, our growth profile is much better than that, with not just comparable growth, but superior growth. In fact, this continues to be one of the best growth profiles in our firm’s history. |
| Performance Past Does Not Indicate Future [Text] |
Past performance is not necessarily indicative of future results.
|
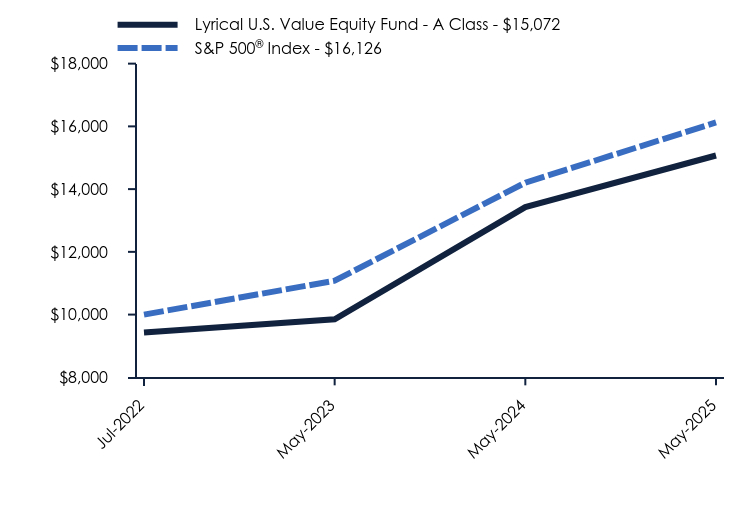
| Line Graph [Table Text Block] |
| Lyrical U.S. Value Equity Fund - A Class | S&P 500® Index |
|---|
Jul-2022 | $9,426 | $10,000 |
|---|
May-2023 | $9,851 | $11,081 |
|---|
May-2024 | $13,428 | $14,205 |
|---|
May-2025 | $15,072 | $16,126 |
|---|
|
| Average Annual Return [Table Text Block] |
| 1 Year | Since Inception (July 5, 2022) |
|---|
Lyrical U.S. Value Equity Fund - A Class | | |
|---|
Without Load | 12.24% | 17.54% |
|---|
With Load* | 5.78% | 15.17% |
|---|
S&P 500® Index | 13.52% | 17.88% |
|---|
|
| Performance Inception Date |
Jul. 05, 2022
|
| No Deduction of Taxes [Text Block] |
The graph and table do not reflect the deduction of taxes that a shareholder would pay on fund
distributions or redemption of fund shares.
|
| AssetsNet |
$ 1,050,349,358
|
| Holdings Count | Holding |
34
|
| Advisory Fees Paid, Amount |
$ 4,518,656
|
| InvestmentCompanyPortfolioTurnover |
10.00%
|
| Additional Fund Statistics [Text Block] |
- Net Assets$1,050,349,358
- Number of Portfolio Holdings34
- Advisory Fee (net of waivers & recoupments)$4,518,656
- Portfolio Turnover10%
|
| Holdings [Text Block] |
Asset Weighting (% of total investments)Value | Value |
|---|
Common Stocks | 98.3% | Money Market Funds | 1.7% |
Sector Weighting (% of net assets)Value | Value |
|---|
Other Assets in Excess of Liabilities | 0.2% | Money Market Funds | 1.7% | Materials | 1.7% | Energy | 3.7% | Utilities | 7.1% | Communications | 9.1% | Consumer Discretionary | 9.7% | Health Care | 11.2% | Industrials | 12.9% | Financials | 15.5% | Technology | 27.2% |
Top 10 Holdings (% of net assets)Holding Name | % of Net Assets |
|---|
NRG Energy, Inc. | 7.1% |
|---|
United Rentals, Inc. | 5.7% |
|---|
Johnson Controls International plc | 5.5% |
|---|
Uber Technologies, Inc. | 4.9% |
|---|
Fidelity National Information Services, Inc. | 4.8% |
|---|
eBay, Inc. | 4.6% |
|---|
Corpay, Inc. | 4.4% |
|---|
Ameriprise Financial, Inc. | 4.3% |
|---|
AerCap Holdings N.V. | 4.3% |
|---|
Expedia Group, Inc. | 4.2% |
|---|
|
| Material Fund Change [Text Block] |
No material changes occurred during the period ended May 31, 2025. |
| C000236985 |
|
| Shareholder Report [Line Items] |
|
| Fund Name |
Lyrical U.S. Value Equity Fund
|
| Class Name |
C Class
|
| Trading Symbol |
LYRCX
|
| Annual or Semi-Annual Statement [Text Block] |
This semi-annual shareholder report contains important information about Lyrical U.S. Value Equity Fund for the period of December 1, 2024 to May 31, 2025.
|
| Shareholder Report Annual or Semi-Annual |
Semi-Annual Shareholder Report
|
| Additional Information [Text Block] |
You can find additional information about the Fund at www.lyricalvaluefunds.com. You can also request this information by contacting us at (888) 884-8099.
|
| Additional Information Phone Number |
(888) 884-8099
|
| Additional Information Website |
www.lyricalvaluefunds.com
|
| Expenses [Text Block] |
What were the Fund’s annualized costs for the last six months?(based on a hypothetical $10,000 investment)Class Name | Costs of a $10,000 investment | Costs paid as a percentage of a $10,000 investment |
|---|
C Class | $98 | 1.99% |
|---|
|
| Expenses Paid, Amount |
$ 98
|
| Expense Ratio, Percent |
1.99%
|
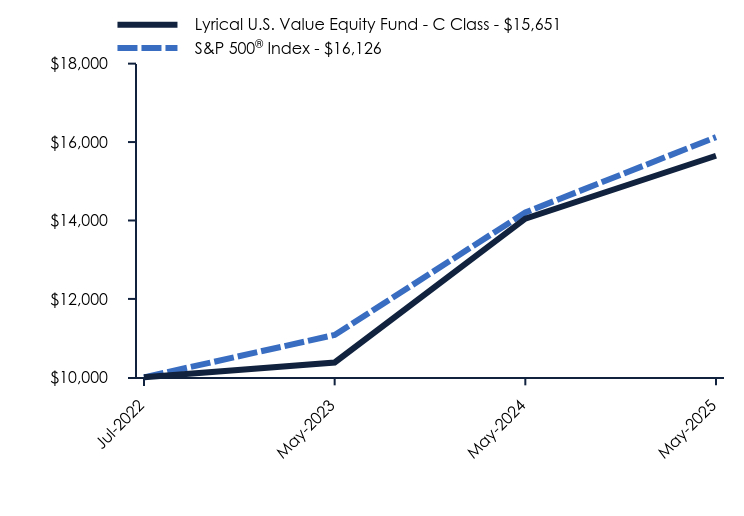
| Factors Affecting Performance [Text Block] |
How did the Fund perform during the reporting period? The Fund performed well during the reporting period, especially given the market environment. Our returns exceeded those of the S&P 500® Index, which was no easy task given how much of the index's returns were driven by mega cap growth stocks. In fact, mega cap growth stocks had such a large impact on the S&P 500® Index return; it outperformed the S&P 500® Equal Weight index by 3.6 percentage points. For the reporting period, the three positions that most positively impacted performance were: NRG Energy, Inc. (NRG) up 55%, Johnson Controls International plc (JCI) up 22%, and Uber Technologies, Inc. (UBER) up 17%. On the other side, the three positions that most negatively impacted performance were: Global Payments, Inc. (GPN) down 36%, United Rentals, Inc. (URI) down 18%, and Corpay, Inc. (CNC) down 15%. The portfolio remains attractively valued with a price-to-earnings (P/E) ratio of 12.4 times next twelve months consensus earnings at period end. On this same basis the S&P 500® Index had a valuation of 21.5 times earnings, a premium of 73% to the Fund. What is uncommon about our portfolio is not only its low valuation but also its attractive growth. Throughout our history our portfolios have had a discounted P/E to the S&P 500® Index with comparable growth. Currently, our growth profile is much better than that, with not just comparable growth, but superior growth. In fact, this continues to be one of the best growth profiles in our firm’s history. |
| Performance Past Does Not Indicate Future [Text] |
Past performance is not necessarily indicative of future results.
|
| Line Graph [Table Text Block] |
| Lyrical U.S. Value Equity Fund - C Class | S&P 500® Index |
|---|
Jul-2022 | $10,000 | $10,000 |
|---|
May-2023 | $10,378 | $11,081 |
|---|
May-2024 | $14,047 | $14,205 |
|---|
May-2025 | $15,651 | $16,126 |
|---|
|
| Average Annual Return [Table Text Block] |
| 1 Year | Since Inception (July 5, 2022) |
|---|
Lyrical U.S. Value Equity Fund - C Class | | |
|---|
Without CDSC | 11.42% | 16.68% |
|---|
With CDSC | 10.42% | 16.68% |
|---|
S&P 500® Index | 13.52% | 17.88% |
|---|
|
| Performance Inception Date |
Jul. 05, 2022
|
| No Deduction of Taxes [Text Block] |
The graph and table do not reflect the deduction of taxes that a shareholder would pay on fund distributions or redemption of fund shares.
|
| AssetsNet |
$ 1,050,349,358
|
| Holdings Count | Holding |
34
|
| Advisory Fees Paid, Amount |
$ 4,518,656
|
| InvestmentCompanyPortfolioTurnover |
10.00%
|
| Additional Fund Statistics [Text Block] |
- Net Assets$1,050,349,358
- Number of Portfolio Holdings34
- Advisory Fee (net of waivers & recoupments)$4,518,656
- Portfolio Turnover10%
|
| Holdings [Text Block] |
Asset Weighting (% of total investments)Value | Value |
|---|
Common Stocks | 98.3% | Money Market Funds | 1.7% |
Sector Weighting (% of net assets)Value | Value |
|---|
Other Assets in Excess of Liabilities | 0.2% | Money Market Funds | 1.7% | Materials | 1.7% | Energy | 3.7% | Utilities | 7.1% | Communications | 9.1% | Consumer Discretionary | 9.7% | Health Care | 11.2% | Industrials | 12.9% | Financials | 15.5% | Technology | 27.2% |
Top 10 Holdings (% of net assets)Holding Name | % of Net Assets |
|---|
NRG Energy, Inc. | 7.1% |
|---|
United Rentals, Inc. | 5.7% |
|---|
Johnson Controls International plc | 5.5% |
|---|
Uber Technologies, Inc. | 4.9% |
|---|
Fidelity National Information Services, Inc. | 4.8% |
|---|
eBay, Inc. | 4.6% |
|---|
Corpay, Inc. | 4.4% |
|---|
Ameriprise Financial, Inc. | 4.3% |
|---|
AerCap Holdings N.V. | 4.3% |
|---|
Expedia Group, Inc. | 4.2% |
|---|
|
| Material Fund Change [Text Block] |
No material changes occurred during the period ended May 31, 2025. |
| C000218236 |
|
| Shareholder Report [Line Items] |
|
| Fund Name |
Lyrical International Value Equity Fund
|
| Class Name |
Institutional Class
|
| Trading Symbol |
LYRWX
|
| Annual or Semi-Annual Statement [Text Block] |
This semi-annual shareholder report contains important information about Lyrical International Value Equity Fund for the period of December 1, 2024 to May 31, 2025.
|
| Shareholder Report Annual or Semi-Annual |
Semi-Annual Shareholder Report
|
| Additional Information [Text Block] |
You can find additional information about the Fund at www.lyricalvaluefunds.com. You can also request this information by contacting us at (888) 884-8099.
|
| Additional Information Phone Number |
(888) 884-8099
|
| Additional Information Website |
www.lyricalvaluefunds.com
|
| Expenses [Text Block] |
What were the Fund’s annualized costs for the last six months?(based on a hypothetical $10,000 investment)Class Name | Costs of a $10,000 investment | Costs paid as a percentage of a $10,000 investment |
|---|
Institutional Class | $58 | 1.08% |
|---|
|
| Expenses Paid, Amount |
$ 58
|
| Expense Ratio, Percent |
1.08%
|
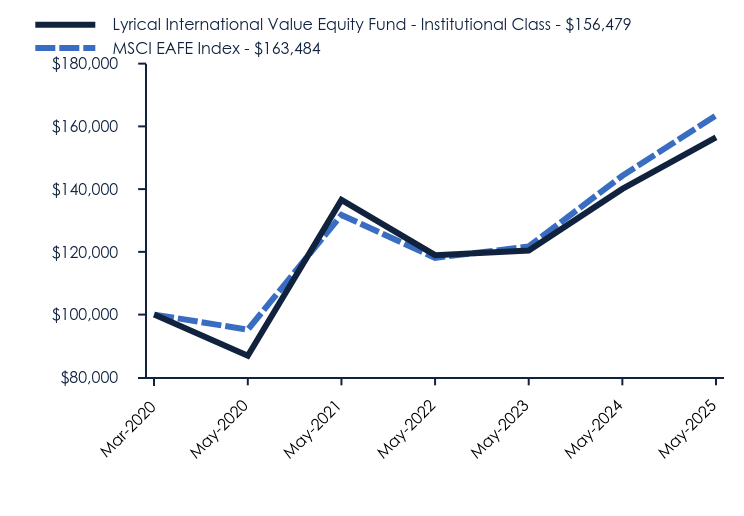
| Factors Affecting Performance [Text Block] |
How did the Fund perform during the reporting period? The Fund was up 16.4% during the reporting period, driven by a combination of multiple expansion and earnings growth. The MSCI EAFE Index was up 14.2% during the period and the MSCI EAFE Equal-Weighted Index was up 14.1%. For the reporting period, the three positions that most positively impacted performance were: Euronext N.V. (ENX-FR) up 49%, Nintendo Company Ltd.(NTDOY-US) up 40%, and SPIE S.A. (SPIE-FR) up 64%. On the other side, the three positions that most negatively impacted performance were: Ashtead Group plc (AHT-LON) down 27%, Evolution AB (EVO-SE) down 18%, and Suncor Energy, Inc. (SU-CA) down 8%. Even after strong returns in the period, the portfolio remains attractively valued. The price-to-earnings (P/E) ratio ended the period at 11.7x times the next twelve months consensus earnings. The MSCI EAFE Index had a valuation of 14.8x times earnings on this same basis, a premium of 26% to the Fund. In addition to an attractive valuation, our Fund also has had superior earnings growth. Since 2012, the companies in our portfolio have grown their EPS at a 7.3% annualized rate, compared to the MSCI EAFE Index at 5.9%. |
| Performance Past Does Not Indicate Future [Text] |
Past performance is not necessarily indicative of future results.
|
| Line Graph [Table Text Block] |
| Lyrical International Value Equity Fund - Institutional Class | MSCI EAFE Index |
|---|
Mar-2020 | $100,000 | $100,000 |
|---|
May-2020 | $86,900 | $95,200 |
|---|
May-2021 | $136,568 | $131,770 |
|---|
May-2022 | $118,957 | $118,093 |
|---|
May-2023 | $120,448 | $121,708 |
|---|
May-2024 | $140,066 | $144,256 |
|---|
May-2025 | $156,479 | $163,484 |
|---|
|
| Average Annual Return [Table Text Block] |
| 1 Year | 5 Years | Since Inception (March 2, 2020) |
|---|
Lyrical International Value Equity Fund - Institutional Class | 11.72% | 12.48% | 8.91% |
|---|
MSCI EAFE Index | 13.33% | 11.42% | 9.82% |
|---|
|
| Performance Inception Date |
Mar. 02, 2020
|
| No Deduction of Taxes [Text Block] |
The graph and table do not reflect the deduction of taxes that a shareholder would pay on fund distributions or redemption of fund shares.
|
| AssetsNet |
$ 2,437,900
|
| Holdings Count | Holding |
31
|
| Advisory Fees Paid, Amount |
$ 0
|
| InvestmentCompanyPortfolioTurnover |
10.00%
|
| Additional Fund Statistics [Text Block] |
- Net Assets$2,437,900
- Number of Portfolio Holdings31
- Advisory Fee (net of waivers)$0
- Portfolio Turnover10%
|
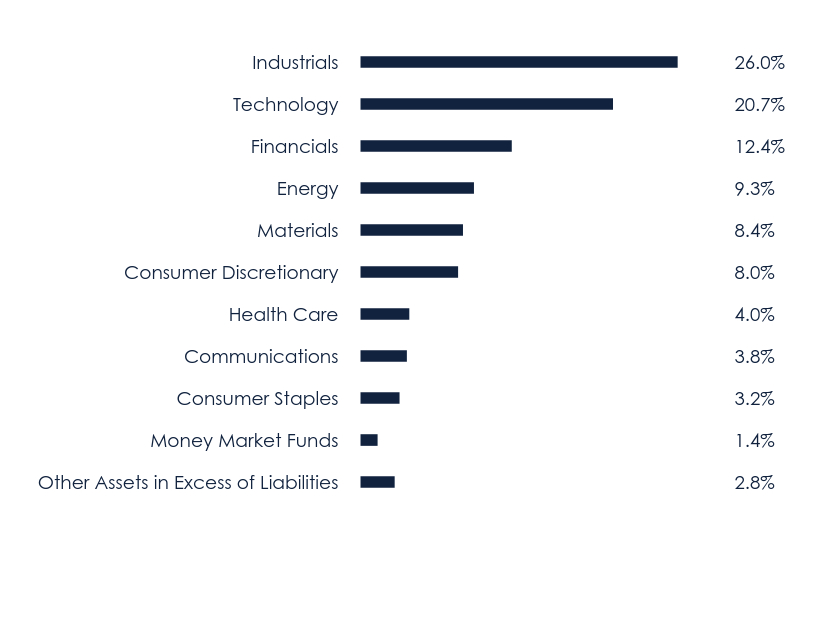
| Holdings [Text Block] |
Sector Weighting (% of net assets)Value | Value |
|---|
Other Assets in Excess of Liabilities | 2.8% | Money Market Funds | 1.4% | Consumer Staples | 3.2% | Communications | 3.8% | Health Care | 4.0% | Consumer Discretionary | 8.0% | Materials | 8.4% | Energy | 9.3% | Financials | 12.4% | Technology | 20.7% | Industrials | 26.0% |
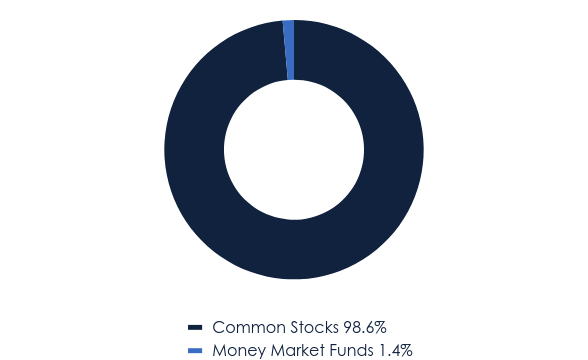
Asset Weighting (% of total investments)Value | Value |
|---|
Common Stocks | 98.6% | Money Market Funds | 1.4% |
Top 10 Holdings (% of net assets)Holding Name | % of Net Assets |
|---|
Johnson Controls International plc | 4.7% |
|---|
AerCap Holdings N.V. | 4.6% |
|---|
Sony Group Corporation | 4.6% |
|---|
Nintendo Company Ltd. - ADR | 4.4% |
|---|
Renesas Electronics Corporation | 4.2% |
|---|
Euronext N.V. | 4.1% |
|---|
SPIE S.A. | 4.0% |
|---|
Fresenius SE & Company KGaA | 4.0% |
|---|
Rexel S.A. | 3.9% |
|---|
Bollore SE | 3.8% |
|---|
|
| Material Fund Change [Text Block] |
No material changes occurred during the period ended May 31, 2025. |
| C000218237 |
|
| Shareholder Report [Line Items] |
|
| Fund Name |
Lyrical International Value Equity Fund
|
| Class Name |
Investor Class
|
| Trading Symbol |
LYRNX
|
| Annual or Semi-Annual Statement [Text Block] |
This semi-annual shareholder report contains important information about Lyrical International Value Equity Fund for the period of December 1, 2024 to May 31, 2025.
|
| Shareholder Report Annual or Semi-Annual |
Semi-Annual Shareholder Report
|
| Additional Information [Text Block] |
You can find additional information about the Fund at www.lyricalvaluefunds.com. You can also request this information by contacting us at (888) 884-8099.
|
| Additional Information Phone Number |
(888) 884-8099
|
| Additional Information Website |
www.lyricalvaluefunds.com
|
| Expenses [Text Block] |
What were the Fund’s annualized costs for the last six months?(based on a hypothetical $10,000 investment)Class Name | Costs of a $10,000 investment | Costs paid as a percentage of a $10,000 investment |
|---|
Investor Class | $77 | 1.42% |
|---|
|
| Expenses Paid, Amount |
$ 77
|
| Expense Ratio, Percent |
1.42%
|
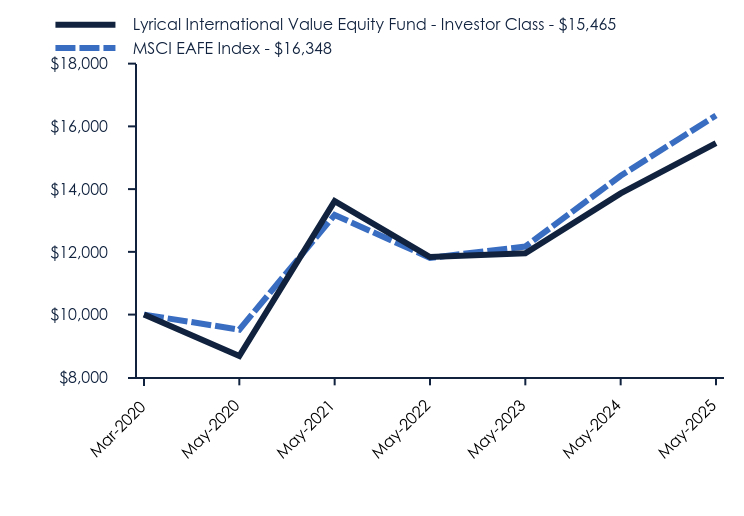
| Factors Affecting Performance [Text Block] |
How did the Fund perform during the reporting period? The Fund was up 16.4% during the reporting period, driven by a combination of multiple expansion and earnings growth. The MSCI EAFE Index was up 14.2% during the period and the MSCI EAFE Equal-Weighted Index was up 14.1%. For the reporting period, the three positions that most positively impacted performance were: Euronext N.V. (ENX-FR) up 49%, Nintendo Company Ltd.(NTDOY-US) up 40%, and SPIE S.A. (SPIE-FR) up 64%. On the other side, the three positions that most negatively impacted performance were: Ashtead Group plc (AHT-LON) down 27%, Evolution AB (EVO-SE) down 18%, and Suncor Energy, Inc. (SU-CA) down 8%. Even after strong returns in the period, the portfolio remains attractively valued. The price-to-earnings (P/E) ratio ended the period at 11.7x times the next twelve months consensus earnings. The MSCI EAFE Index had a valuation of 14.8x times earnings on this same basis, a premium of 26% to the Fund. In addition to an attractive valuation, our Fund also has had superior earnings growth. Since 2012, the companies in our portfolio have grown their EPS at a 7.3% annualized rate, compared to the MSCI EAFE Index at 5.9%. |
| Performance Past Does Not Indicate Future [Text] |
Past performance is not necessarily indicative of future results.
|
| Line Graph [Table Text Block] |
| Lyrical International Value Equity Fund - Investor Class | MSCI EAFE Index |
|---|
Mar-2020 | $10,000 | $10,000 |
|---|
May-2020 | $8,680 | $9,520 |
|---|
May-2021 | $13,615 | $13,177 |
|---|
May-2022 | $11,836 | $11,809 |
|---|
May-2023 | $11,955 | $12,171 |
|---|
May-2024 | $13,863 | $14,426 |
|---|
May-2025 | $15,465 | $16,348 |
|---|
|
| Average Annual Return [Table Text Block] |
| 1 Year | 5 Years | Since Inception (March 2, 2020) |
|---|
Lyrical International Value Equity Fund - Investor Class | 11.56% | 12.24% | 8.66% |
|---|
MSCI EAFE Index | 13.33% | 11.42% | 9.82% |
|---|
|
| Performance Inception Date |
Mar. 02, 2020
|
| No Deduction of Taxes [Text Block] |
The graph and table do not reflect the deduction of taxes that a shareholder would pay on fund distributions or redemption of fund shares.
|
| AssetsNet |
$ 2,437,900
|
| Holdings Count | Holding |
31
|
| Advisory Fees Paid, Amount |
$ 0
|
| InvestmentCompanyPortfolioTurnover |
10.00%
|
| Additional Fund Statistics [Text Block] |
- Net Assets$2,437,900
- Number of Portfolio Holdings31
- Advisory Fee (net of waivers)$0
- Portfolio Turnover10%
|
| Holdings [Text Block] |
Sector Weighting (% of net assets)Value | Value |
|---|
Other Assets in Excess of Liabilities | 2.8% | Money Market Funds | 1.4% | Consumer Staples | 3.2% | Communications | 3.8% | Health Care | 4.0% | Consumer Discretionary | 8.0% | Materials | 8.4% | Energy | 9.3% | Financials | 12.4% | Technology | 20.7% | Industrials | 26.0% |
Asset Weighting (% of total investments)Value | Value |
|---|
Common Stocks | 98.6% | Money Market Funds | 1.4% |
Top 10 Holdings (% of net assets)Holding Name | % of Net Assets |
|---|
Johnson Controls International plc | 4.7% |
|---|
AerCap Holdings N.V. | 4.6% |
|---|
Sony Group Corporation | 4.6% |
|---|
Nintendo Company Ltd. - ADR | 4.4% |
|---|
Renesas Electronics Corporation | 4.2% |
|---|
Euronext N.V. | 4.1% |
|---|
SPIE S.A. | 4.0% |
|---|
Fresenius SE & Company KGaA | 4.0% |
|---|
Rexel S.A. | 3.9% |
|---|
Bollore SE | 3.8% |
|---|
|
| Material Fund Change [Text Block] |
No material changes occurred during the period ended May 31, 2025. |
| C000236988 |
|
| Shareholder Report [Line Items] |
|
| Fund Name |
Lyrical International Value Equity Fund
|
| Class Name |
A Class
|
| Trading Symbol |
LYRVX
|
| Annual or Semi-Annual Statement [Text Block] |
This semi-annual shareholder report contains important information about Lyrical International Value Equity Fund for the period of December 1, 2024 to May 31, 2025.
|
| Shareholder Report Annual or Semi-Annual |
Semi-Annual Shareholder Report
|
| Additional Information [Text Block] |
You can find additional information about the Fund at www.lyricalvaluefunds.com. You can also request this information by contacting us at (888) 884-8099. This report describes changes to the Fund that occurred during the reporting period.
|
| Material Fund Change Notice [Text Block] |
This report describes changes to the Fund that occurred during the reporting period.
|
| Additional Information Phone Number |
(888) 884-8099
|
| Additional Information Website |
www.lyricalvaluefunds.com
|
| Expenses [Text Block] |
What were the Fund’s annualized costs for the last six months?(based on a hypothetical $10,000 investment)Class Name | Costs of a $10,000 investment | Costs paid as a percentage of a $10,000 investment |
|---|
A Class | $77 | 1.42% |
|---|
|
| Expenses Paid, Amount |
$ 77
|
| Expense Ratio, Percent |
1.42%
|
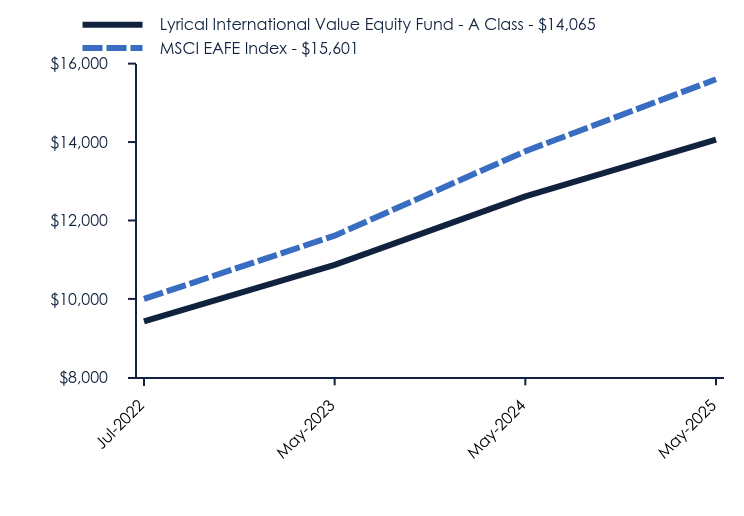
| Factors Affecting Performance [Text Block] |
How did the Fund perform during the reporting period? The Fund was up 16.4% during the reporting period, driven by a combination of multiple expansion and earnings growth. The MSCI EAFE Index was up 14.2% during the period and the MSCI EAFE Equal-Weighted Index was up 14.1%. For the reporting period, the three positions that most positively impacted performance were: Euronext N.V. (ENX-FR) up 49%, Nintendo Company Ltd.(NTDOY-US) up 40%, and SPIE S.A. (SPIE-FR) up 64%. On the other side, the three positions that most negatively impacted performance were: Ashtead Group plc (AHT-LON) down 27%, Evolution AB (EVO-SE) down 18%, and Suncor Energy, Inc. (SU-CA) down 8%. Even after strong returns in the period, the portfolio remains attractively valued. The price-to-earnings (P/E) ratio ended the period at 11.7x times the next twelve months consensus earnings. The MSCI EAFE Index had a valuation of 14.8x times earnings on this same basis, a premium of 26% to the Fund. In addition to an attractive valuation, our Fund also has had superior earnings growth. Since 2012, the companies in our portfolio have grown their EPS at a 7.3% annualized rate, compared to the MSCI EAFE Index at 5.9%. |
| Performance Past Does Not Indicate Future [Text] |
Past performance is not necessarily indicative of future results.
|
| Line Graph [Table Text Block] |
| Lyrical International Value Equity Fund - A Class | MSCI EAFE Index |
|---|
Jul-2022 | $9,424 | $10,000 |
|---|
May-2023 | $10,870 | $11,614 |
|---|
May-2024 | $12,613 | $13,766 |
|---|
May-2025 | $14,065 | $15,601 |
|---|
|
| Average Annual Return [Table Text Block] |
| 1 Year | Since Inception (July 5, 2022) |
|---|
Lyrical International Value Equity Fund - A Class | | |
|---|
Without Load | 11.52% | 14.78% |
|---|
With Load* | 5.09% | 12.46% |
|---|
MSCI EAFE Index | 13.33% | 16.55% |
|---|
|
| Performance Inception Date |
Jul. 05, 2022
|
| No Deduction of Taxes [Text Block] |
The graph and table do not reflect the deduction of taxes that a shareholder would pay on fund distributions or redemption of fund shares.
|
| AssetsNet |
$ 2,437,900
|
| Holdings Count | Holding |
31
|
| Advisory Fees Paid, Amount |
$ 0
|
| InvestmentCompanyPortfolioTurnover |
10.00%
|
| Additional Fund Statistics [Text Block] |
- Net Assets$2,437,900
- Number of Portfolio Holdings31
- Advisory Fee (net of waivers)$0
- Portfolio Turnover10%
|
| Holdings [Text Block] |
Sector Weighting (% of net assets)Value | Value |
|---|
Other Assets in Excess of Liabilities | 2.8% | Money Market Funds | 1.4% | Consumer Staples | 3.2% | Communications | 3.8% | Health Care | 4.0% | Consumer Discretionary | 8.0% | Materials | 8.4% | Energy | 9.3% | Financials | 12.4% | Technology | 20.7% | Industrials | 26.0% |
Asset Weighting (% of total investments)Value | Value |
|---|
Common Stocks | 98.6% | Money Market Funds | 1.4% |
Top 10 Holdings (% of net assets)Holding Name | % of Net Assets |
|---|
Johnson Controls International plc | 4.7% |
|---|
AerCap Holdings N.V. | 4.6% |
|---|
Sony Group Corporation | 4.6% |
|---|
Nintendo Company Ltd. - ADR | 4.4% |
|---|
Renesas Electronics Corporation | 4.2% |
|---|
Euronext N.V. | 4.1% |
|---|
SPIE S.A. | 4.0% |
|---|
Fresenius SE & Company KGaA | 4.0% |
|---|
Rexel S.A. | 3.9% |
|---|
Bollore SE | 3.8% |
|---|
|
| Material Fund Change [Text Block] |
Effective June 5, 2025, the Lyrical International Value Equity Fund terminated the public offering of its A Class and C Class shares and discontinued the operations of the A Class and C Class shares of the Fund effective June 30, 2025. The A Class and C Class shares of the Fund are no longer available for purchase and, at the close of business on June 30, 2025, all outstanding A Class and C Class shares of the Fund were redeemed at the net asset value
per share of A Class and C Class shares, respectively. |
| C000236987 |
|
| Shareholder Report [Line Items] |
|
| Fund Name |
Lyrical International Value Equity Fund
|
| Class Name |
C Class
|
| Trading Symbol |
LYRZX
|
| Annual or Semi-Annual Statement [Text Block] |
This semi-annual shareholder report contains important information about Lyrical International Value Equity Fund for the period of December 1, 2024 to May 31, 2025.
|
| Shareholder Report Annual or Semi-Annual |
Semi-Annual Shareholder Report
|
| Additional Information [Text Block] |
You can find additional information about the Fund at www.lyricalvaluefunds.com. You can also request this information by contacting us at (888) 884-8099. This report describes changes to the Fund that occurred during the reporting period.
|
| Material Fund Change Notice [Text Block] |
This report describes changes to the Fund that occurred during the reporting period.
|
| Additional Information Phone Number |
(888) 884-8099
|
| Additional Information Website |
www.lyricalvaluefunds.com
|
| Expenses [Text Block] |
What were the Fund’s annualized costs for the last six months?(based on a hypothetical $10,000 investment)Class Name | Costs of a $10,000 investment | Costs paid as a percentage of a $10,000 investment |
|---|
C Class | $117 | 2.17% |
|---|
|
| Expenses Paid, Amount |
$ 117
|
| Expense Ratio, Percent |
2.17%
|
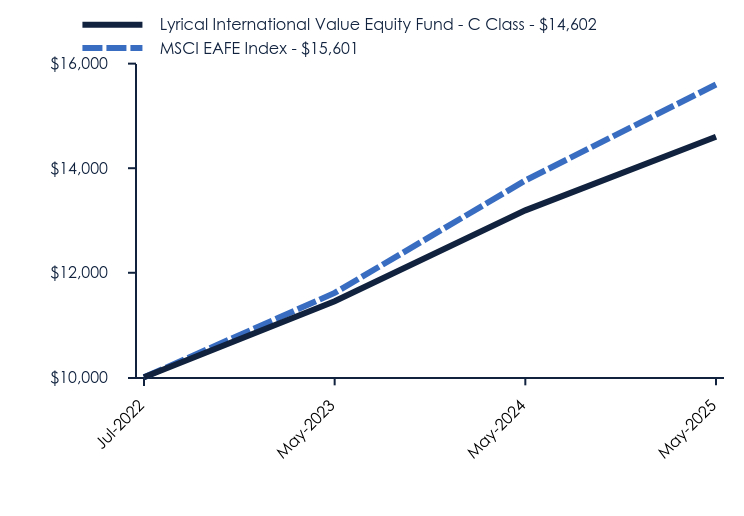
| Factors Affecting Performance [Text Block] |
How did the Fund perform during the reporting period? The Fund was up 16.4% during the reporting period, driven by a combination of multiple expansion and earnings growth. The MSCI EAFE Index was up 14.2% during the period and the MSCI EAFE Equal-Weighted Index was up 14.1%. For the reporting period, the three positions that most positively impacted performance were: Euronext N.V. (ENX-FR) up 49%, Nintendo Company Ltd.(NTDOY-US) up 40%, and SPIE S.A. (SPIE-FR) up 64%. On the other side, the three positions that most negatively impacted performance were: Ashtead Group plc (AHT-LON) down 27%, Evolution AB (EVO-SE) down 18%, and Suncor Energy, Inc. (SU-CA) down 8%. Even after strong returns in the period, the portfolio remains attractively valued. The price-to-earnings (P/E) ratio ended the period at 11.7x times the next twelve months consensus earnings. The MSCI EAFE Index had a valuation of 14.8x times earnings on this same basis, a premium of 26% to the Fund. In addition to an attractive valuation, our Fund also has had superior earnings growth. Since 2012, the companies in our portfolio have grown their EPS at a 7.3% annualized rate, compared to the MSCI EAFE Index at 5.9%. |
| Performance Past Does Not Indicate Future [Text] |
Past performance is not necessarily indicative of future results.
|
| Line Graph [Table Text Block] |
| Lyrical International Value Equity Fund - C Class | MSCI EAFE Index |
|---|
Jul-2022 | $10,000 | $10,000 |
|---|
May-2023 | $11,454 | $11,614 |
|---|
May-2024 | $13,194 | $13,766 |
|---|
May-2025 | $14,602 | $15,601 |
|---|
|
| Average Annual Return [Table Text Block] |
| 1 Year | Since Inception (July 5, 2022) |
|---|
Lyrical International Value Equity Fund - C Class | | |
|---|
Without CDSC | 10.68% | 13.92% |
|---|
With CDSC | 9.68% | 13.92% |
|---|
MSCI EAFE Index | 13.33% | 16.55% |
|---|
|
| Performance Inception Date |
Jul. 05, 2022
|
| No Deduction of Taxes [Text Block] |
The graph and table do not reflect the deduction of taxes that a shareholder would pay on fund distributions or redemption of fund shares.
|
| AssetsNet |
$ 2,437,900
|
| Holdings Count | Holding |
31
|
| Advisory Fees Paid, Amount |
$ 0
|
| InvestmentCompanyPortfolioTurnover |
10.00%
|
| Additional Fund Statistics [Text Block] |
- Net Assets$2,437,900
- Number of Portfolio Holdings31
- Advisory Fee (net of waivers)$0
- Portfolio Turnover10%
|
| Holdings [Text Block] |
Sector Weighting (% of net assets)Value | Value |
|---|
Other Assets in Excess of Liabilities | 2.8% | Money Market Funds | 1.4% | Consumer Staples | 3.2% | Communications | 3.8% | Health Care | 4.0% | Consumer Discretionary | 8.0% | Materials | 8.4% | Energy | 9.3% | Financials | 12.4% | Technology | 20.7% | Industrials | 26.0% |
Asset Weighting (% of total investments)Value | Value |
|---|
Common Stocks | 98.6% | Money Market Funds | 1.4% |
Top 10 Holdings (% of net assets)Holding Name | % of Net Assets |
|---|
Johnson Controls International plc | 4.7% |
|---|
AerCap Holdings N.V. | 4.6% |
|---|
Sony Group Corporation | 4.6% |
|---|
Nintendo Company Ltd. - ADR | 4.4% |
|---|
Renesas Electronics Corporation | 4.2% |
|---|
Euronext N.V. | 4.1% |
|---|
SPIE S.A. | 4.0% |
|---|
Fresenius SE & Company KGaA | 4.0% |
|---|
Rexel S.A. | 3.9% |
|---|
Bollore SE | 3.8% |
|---|
|
| Material Fund Change [Text Block] |
Effective June 5, 2025, the Lyrical International Value Equity Fund terminated the public offering of its A Class and C Class shares and discontinued the operations of the A Class and C Class shares of the Fund effective June 30, 2025. The A Class and C Class shares of the Fund are no longer available for purchase and, at the close of business on June 30, 2025, all outstanding A Class and C Class shares of the Fund were redeemed at the net asset value per share of A Class and C Class shares, respectively. |
| C000216823 |
|
| Shareholder Report [Line Items] |
|
| Fund Name |
Q3 All-Season Systematic Opportunities Fund
|
| Class Name |
Institutional Class
|
| Trading Symbol |
QASOX
|
| Annual or Semi-Annual Statement [Text Block] |
This semi-annual shareholder report contains important information about Q3 All-Season Systematic Opportunities Fund (the "Fund") for the period of December 1, 2024 to May 31, 2025.
|
| Shareholder Report Annual or Semi-Annual |
Semi-Annual Shareholder Report
|
| Additional Information [Text Block] |
You can find additional information about the Fund at https://www.q3allseasonfunds.com/funds/. You can also request this information by contacting us at (855) 784-2399.
|
| Additional Information Phone Number |
(855) 784-2399
|
| Additional Information Website |
<span style="font-weight: 700; box-sizing: border-box; color: rgb(0, 0, 0); display: inline; flex-wrap: nowrap; font-size: 12px; grid-area: auto; line-height: 18px; margin: 0px; overflow: visible; text-align: left; text-align-last: left; white-space-collapse: preserve-breaks;">https://www.q3allseasonfunds.com/funds/</span>
|
| Expenses [Text Block] |
What were the Fund’s annualized costs for the last six months?(based on a hypothetical $10,000 investment)Class Name | Costs of a $10,000 investment | Costs paid as a percentage of a $10,000 investment |
|---|
Institutional Class | $67 | 1.29% |
|---|
|
| Expenses Paid, Amount |
$ 67
|
| Expense Ratio, Percent |
1.29%
|
| Factors Affecting Performance [Text Block] |
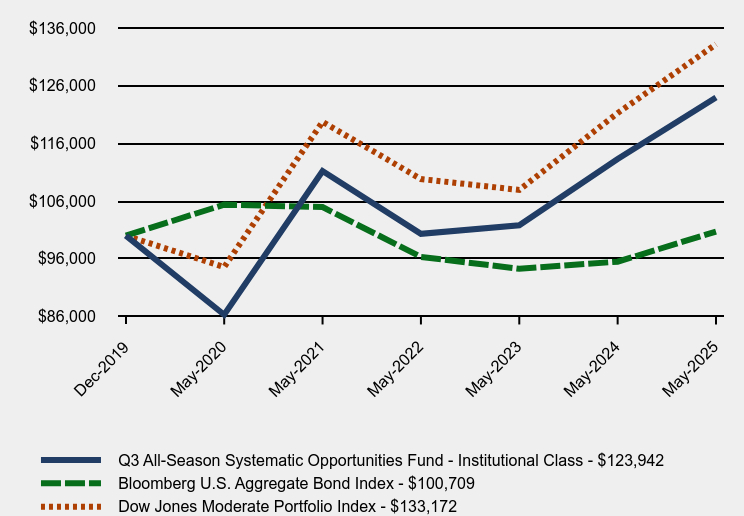
How did the Fund perform during the reporting period? The Q3 All-Season Systematic Opportunities Fund continues to perform as designed – generating positive returns over any market environment. For the most recent six-month period, the Fund was able to harness volatility in the equity markets by entering into short-term trades as equities dipped. The Fund attempts to take advantage of this “mean-reversion” in the markets, as such dips are often followed by significant, short-term, upward bounces. Over the last six months, the Fund was invested in equities (S&P 500® and NASDAQ 100 Index positions) approximately 40% of the time, and registered gains with considerably less risk than the equity markets as a whole. Equity positions consisted of holdings in the S&P 500® and NASDAQ 100 Index futures. During sustained, bullish moves in equities, the Fund will tend to have fewer trades as it looks for buying opportunities on short-term moves to the downside. Given that there were fewer meaningful pullbacks in equities over the period, the Fund maintained larger than normal defensive positions (money market funds) while it waited for opportunities to enter the equity markets. Currently, these defensive positions are generating an annual yield of just under 4.0%. As such, the Fund has the ability to earn healthy yields when it is waiting for potential equity trades. |
| Performance Past Does Not Indicate Future [Text] |
The Fund's past performance is not a good predictor of how the Fund will perform in the future.
|
| Line Graph [Table Text Block] |
| Q3 All-Season Systematic Opportunities Fund - Institutional Class | Bloomberg U.S. Aggregate Bond Index | Dow Jones Moderate Portfolio Index |
|---|
Dec-2019 | $100,000 | $100,000 | $100,000 |
|---|
May-2020 | $86,300 | $105,385 | $94,569 |
|---|
May-2021 | $111,200 | $104,959 | $119,739 |
|---|
May-2022 | $100,327 | $96,329 | $109,822 |
|---|
May-2023 | $101,814 | $94,265 | $107,927 |
|---|
May-2024 | $113,292 | $95,495 | $121,258 |
|---|
May-2025 | $123,942 | $100,709 | $133,172 |
|---|
|
| Average Annual Return [Table Text Block] |
| 1 Year | 5 Years | Since Inception (December 30, 2019) |
|---|
Q3 All-Season Systematic Opportunities Fund - Institutional Class | 9.40% | 7.51% | 4.04% |
|---|
Bloomberg U.S. Aggregate Bond Index | 5.46% | -0.90% | 0.13% |
|---|
Dow Jones Moderate Portfolio Index | 9.83% | 7.09% | 5.43% |
|---|
|
| Performance Inception Date |
Dec. 30, 2019
|
| No Deduction of Taxes [Text Block] |
The graph and table do not reflect the deduction of taxes that a shareholder would pay on fund distributions or redemption of fund shares.
|
| AssetsNet |
$ 186,116,837
|
| Holdings Count | Holding |
2
|
| Advisory Fees Paid, Amount |
$ 879,221
|
| InvestmentCompanyPortfolioTurnover |
2676.00%
|
| Additional Fund Statistics [Text Block] |
- Net Assets$186,116,837
- Number of Portfolio Holdings2
- Advisory Fee (net of recoupments)$879,221
- Portfolio Turnover2,676%
|
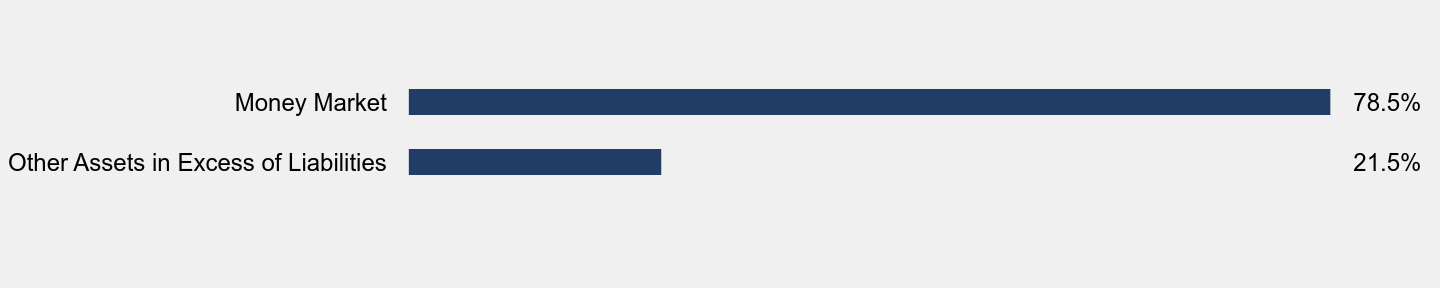
| Holdings [Text Block] |
Sector Weighting (% of net assets)Value | Value |
|---|
Other Assets in Excess of Liabilities | 21.5% | Money Market | 78.5% |
|
| Material Fund Change [Text Block] |
No material changes occurred during the period ended May 31, 2025. |
| C000256096 |
|
| Shareholder Report [Line Items] |
|
| Fund Name |
Q3 All-Season Systematic Opportunities Fund
|
| Class Name |
C Class
|
| Trading Symbol |
QCSOX
|
| Annual or Semi-Annual Statement [Text Block] |
This semi-annual shareholder report contains important information about Q3 All-Season Systematic Opportunities Fund (the "Fund") for the period of December 1, 2024 to May 31, 2025.
|
| Shareholder Report Annual or Semi-Annual |
Semi-Annual Shareholder Report
|
| Additional Information [Text Block] |
You can find additional information about the Fund at https://www.q3allseasonfunds.com/funds/. You can also request this information by contacting us at (855) 784-2399.
|
| Additional Information Phone Number |
(855) 784-2399
|
| Additional Information Website |
<span style="font-weight: 700; box-sizing: border-box; color: rgb(0, 0, 0); display: inline; flex-wrap: nowrap; font-size: 12px; grid-area: auto; line-height: 18px; margin: 0px; overflow: visible; text-align: left; text-align-last: left; white-space-collapse: preserve-breaks;">https://www.q3allseasonfunds.com/funds/</span>
|
| Expenses [Text Block] |
What were the Fund’s annualized costs for the last six months?(based on a hypothetical $10,000 investment)Class Name | Costs of a $10,000 investment | Costs paid as a percentage of a $10,000 investment |
|---|
C Class | $142 | 2.74% |
|---|
|
| Expenses Paid, Amount |
$ 142
|
| Expense Ratio, Percent |
2.74%
|
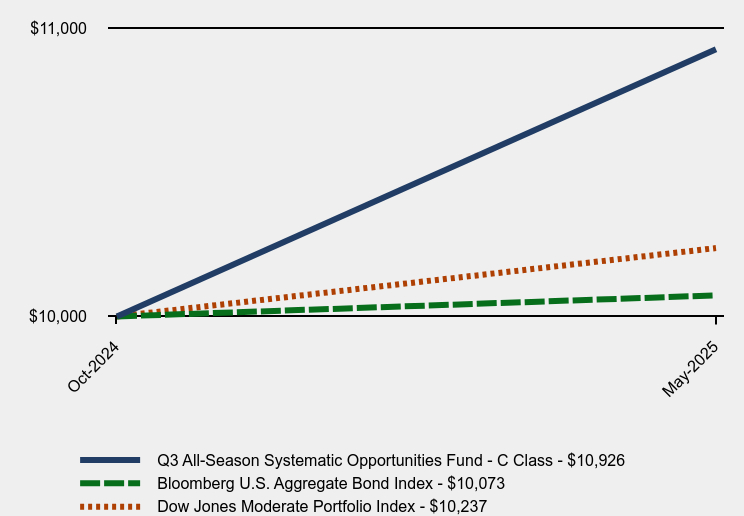
| Factors Affecting Performance [Text Block] |
How did the Fund perform during the reporting period? The Q3 All-Season Systematic Opportunities Fund continues to perform as designed – generating positive returns over any market environment. For the most recent six-month period, the Fund was able to harness volatility in the equity markets by entering into short-term trades as equities dipped. The Fund attempts to take advantage of this “mean-reversion” in the markets, as such dips are often followed by significant, short-term, upward bounces. Over the last six months, the Fund was invested in equities (S&P 500® and NASDAQ 100 Index positions) approximately 40% of the time, and registered gains with considerably less risk than the equity markets as a whole. Equity positions consisted of holdings in the S&P 500® and NASDAQ 100 Index futures. During sustained, bullish moves in equities, the Fund will tend to have fewer trades as it looks for buying opportunities on short-term moves to the downside. Given that there were fewer meaningful pullbacks in equities over the period, the Fund maintained larger than normal defensive positions (money market funds) while it waited for opportunities to enter the equity markets. Currently, these defensive positions are generating an annual yield of just under 4.0%. As such, the Fund has the ability to earn healthy yields when it is waiting for potential equity trades. |
| Performance Past Does Not Indicate Future [Text] |
The Fund's past performance is not a good predictor of how the Fund will perform in the future.
|
| Line Graph [Table Text Block] |
| Q3 All-Season Systematic Opportunities Fund - C Class | Bloomberg U.S. Aggregate Bond Index | Dow Jones Moderate Portfolio Index |
|---|
Oct-2024 | $10,000 | $10,000 | $10,000 |
|---|
May-2025 | $10,926 | $10,073 | $10,237 |
|---|
|
| Average Annual Return [Table Text Block] |
| Since Inception (October 18, 2024) |
|---|
Q3 All-Season Systematic Opportunities Fund - C Class | 9.26% |
|---|
Bloomberg U.S. Aggregate Bond Index | 0.73% |
|---|
Dow Jones Moderate Portfolio Index | 2.37% |
|---|
|
| Performance Inception Date |
Oct. 18, 2024
|
| No Deduction of Taxes [Text Block] |
The graph and table do not reflect the deduction of taxes that a shareholder would pay on fund distributions or redemption of fund shares.
|
| AssetsNet |
$ 186,116,837
|
| Holdings Count | Holding |
2
|
| Advisory Fees Paid, Amount |
$ 879,221
|
| InvestmentCompanyPortfolioTurnover |
2676.00%
|
| Additional Fund Statistics [Text Block] |
- Net Assets$186,116,837
- Number of Portfolio Holdings2
- Advisory Fee (net of recoupments)$879,221
- Portfolio Turnover2,676%
|
| Holdings [Text Block] |
Sector Weighting (% of net assets)Value | Value |
|---|
Other Assets in Excess of Liabilities | 21.5% | Money Market | 78.5% |
|
| Material Fund Change [Text Block] |
No material changes occurred during the period ended May 31, 2025. |
| C000216825 |
|
| Shareholder Report [Line Items] |
|
| Fund Name |
Q3 All-Season Tactical Fund
|
| Class Name |
Institutional Class
|
| Trading Symbol |
QAITX
|
| Annual or Semi-Annual Statement [Text Block] |
This semi-annual shareholder report contains important information about Q3 All-Season Tactical Fund (the "Fund") for the period of December 1, 2024 to May 31, 2025.
|
| Shareholder Report Annual or Semi-Annual |
Semi-Annual Shareholder Report
|
| Additional Information [Text Block] |
You can find additional information about the Fund at https://www.q3allseasonfunds.com/funds/. You can also request this information by contacting us at (855) 784-2399.
|
| Additional Information Phone Number |
(855) 784-2399
|
| Additional Information Website |
<span style="font-weight: 700; box-sizing: border-box; color: rgb(0, 0, 0); display: inline; flex-wrap: nowrap; font-size: 12px; grid-area: auto; line-height: 18px; margin: 0px; overflow: visible; text-align: left; text-align-last: left; white-space-collapse: preserve-breaks;">https://www.q3allseasonfunds.com/funds/</span>
|
| Expenses [Text Block] |
What were the Fund’s annualized costs for the last six months?(based on a hypothetical $10,000 investment)Class Name | Costs of a $10,000 investment | Costs paid as a percentage of a $10,000 investment |
|---|
Institutional Class | $83 | 1.73% |
|---|
|
| Expenses Paid, Amount |
$ 83
|
| Expense Ratio, Percent |
1.73%
|
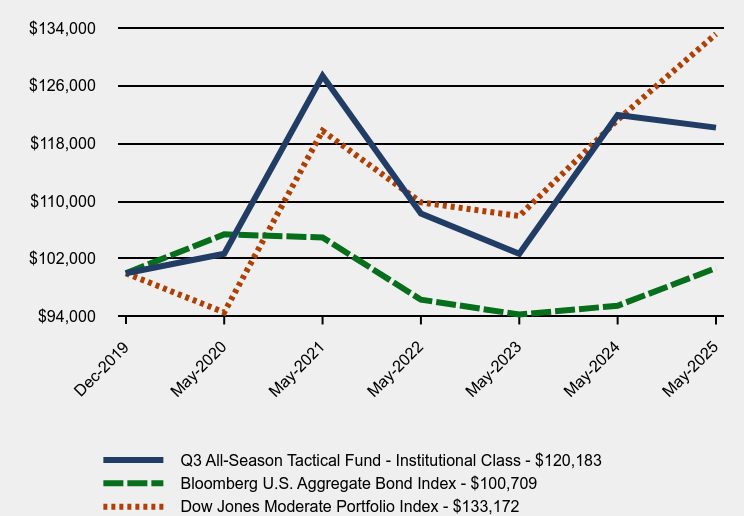
| Factors Affecting Performance [Text Block] |
How did the Fund perform during the reporting period? For the last six months, performance for the Q3 All-Season Tactical Fund was primarily due to the exposure it had to NASDAQ 100 Index funds. The Fund’s quantitative indicators strongly suggested a continuation of the uptrend in that index which had developed during the second half of 2024. Strength in the technology sector propelled the NASDAQ to new highs into February. As such, the Fund maintained significant exposure to the index for the first few months of the year. As the technology sector began to struggle in late February, the Fund remained invested since the overall trend was deemed to still be intact. After several weeks of volatility and largely downside moves in the NASDAQ, the Fund began to lighten its exposure and shift a portion of its assets to Treasury bond positions (long and inverse) and money markets. This proved to be a prescient move as the NASDAQ continued to decline into mid-April. Just as quickly as the market fell, though, it shot back up from its lows in April and moved strongly higher into the end of May. Due to the depth of the decline, and the accompanying volatility, the Fund’s indicators turned decidedly negative. During such an environment, the Fund tends to be cautious and seeks safety over potential upside. The subsequent 20% rise in the NASDAQ 100 Index was one of the fastest in its history. Having only a partial exposure during this time, the Fund trailed the Index from a return standpoint. While the defensive positions of the Fund were modestly profitable over the last few months, their returns trailed the NASDAQ 100 which contributed to the Fund’s underperformance. |
| Performance Past Does Not Indicate Future [Text] |
The Fund's past performance is not a good predictor of how the Fund will perform in the future.
|
| Line Graph [Table Text Block] |
| Q3 All-Season Tactical Fund - Institutional Class | Bloomberg U.S. Aggregate Bond Index | Dow Jones Moderate Portfolio Index |
|---|
Dec-2019 | $100,000 | $100,000 | $100,000 |
|---|
May-2020 | $102,700 | $105,385 | $94,569 |
|---|
May-2021 | $127,377 | $104,959 | $119,739 |
|---|
May-2022 | $108,264 | $96,329 | $109,822 |
|---|
May-2023 | $102,700 | $94,265 | $107,927 |
|---|
May-2024 | $121,942 | $95,495 | $121,258 |
|---|
May-2025 | $120,183 | $100,709 | $133,172 |
|---|
|
| Average Annual Return [Table Text Block] |
| 1 Year | 5 Years | Since Inception (December 30, 2019) |
|---|
Q3 All-Season Tactical Fund - Institutional Class | -1.44% | 3.19% | 3.45% |
|---|
Bloomberg U.S. Aggregate Bond Index | 5.46% | -0.90% | 0.13% |
|---|
Dow Jones Moderate Portfolio Index | 9.83% | 7.09% | 5.43% |
|---|
|
| Performance Inception Date |
Dec. 30, 2019
|
| No Deduction of Taxes [Text Block] |
The graph and table do not reflect the deduction of taxes that a shareholder would pay on fund distributions or redemption of fund shares.
|
| AssetsNet |
$ 33,053,126
|
| Holdings Count | Holding |
3
|
| Advisory Fees Paid, Amount |
$ 229,853
|
| InvestmentCompanyPortfolioTurnover |
0.00%
|
| Additional Fund Statistics [Text Block] |
- Net Assets$33,053,126
- Number of Portfolio Holdings3
- Advisory Fee (net of waivers)$229,853
- Portfolio Turnover0%
|
| Holdings [Text Block] |
Sector Weighting (% of net assets)Value | Value |
|---|
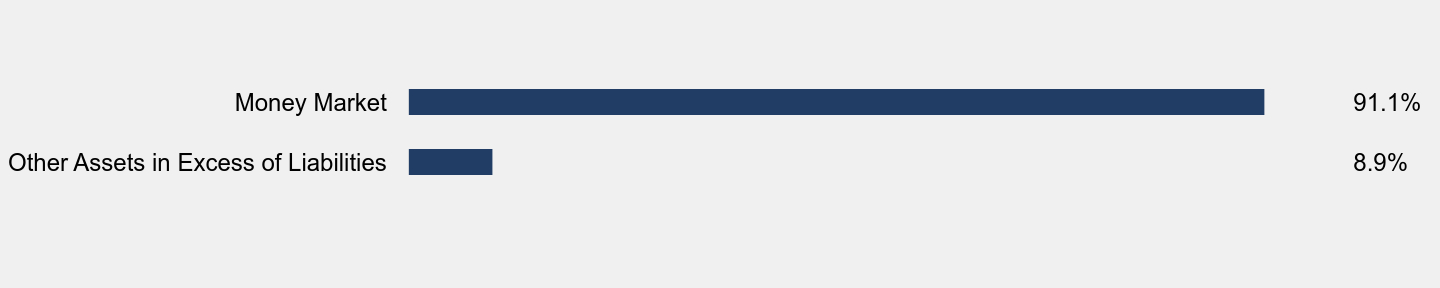
Other Assets in Excess of Liabilities | 8.9% | Money Market | 91.1% |
|
| Material Fund Change [Text Block] |
No material changes occurred during the period ended May 31, 2025. |
| C000226152 |
|
| Shareholder Report [Line Items] |
|
| Fund Name |
Q3 All-Season Tactical Fund
|
| Class Name |
C Class
|
| Trading Symbol |
QACTX
|
| Annual or Semi-Annual Statement [Text Block] |
This semi-annual shareholder report contains important information about Q3 All-Season Tactical Fund (the "Fund") for the period of December 1, 2024 to May 31, 2025.
|
| Shareholder Report Annual or Semi-Annual |
Semi-Annual Shareholder Report
|
| Additional Information [Text Block] |
You can find additional information about the Fund at https://www.q3allseasonfunds.com/funds/. You can also request this information by contacting us at (855) 784-2399.
|
| Additional Information Phone Number |
(855) 784-2399
|
| Additional Information Website |
<span style="font-weight: 700; box-sizing: border-box; color: rgb(0, 0, 0); display: inline; flex-wrap: nowrap; font-size: 12px; grid-area: auto; line-height: 18px; margin: 0px; overflow: visible; text-align: left; text-align-last: left; white-space-collapse: preserve-breaks;">https://www.q3allseasonfunds.com/funds/</span>
|
| Expenses [Text Block] |
What were the Fund’s annualized costs for the last six months?(based on a hypothetical $10,000 investment)Class Name | Costs of a $10,000 investment | Costs paid as a percentage of a $10,000 investment |
|---|
C Class | $141 | 2.95% |
|---|
|
| Expenses Paid, Amount |
$ 141
|
| Expense Ratio, Percent |
2.95%
|
| Factors Affecting Performance [Text Block] |
How did the Fund perform during the reporting period? For the last six months, performance for the Q3 All-Season Tactical Fund was primarily due to the exposure it had to NASDAQ 100 Index funds. The Fund’s quantitative indicators strongly suggested a continuation of the uptrend in that index which had developed during the second half of 2024. Strength in the technology sector propelled the NASDAQ to new highs into February. As such, the Fund maintained significant exposure to the index for the first few months of the year. As the technology sector began to struggle in late February, the Fund remained invested since the overall trend was deemed to still be intact. After several weeks of volatility and largely downside moves in the NASDAQ, the Fund began to lighten its exposure and shift a portion of its assets to Treasury bond positions (long and inverse) and money markets. This proved to be a prescient move as the NASDAQ continued to decline into mid-April. Just as quickly as the market fell, though, it shot back up from its lows in April and moved strongly higher into the end of May. Due to the depth of the decline, and the accompanying volatility, the Fund’s indicators turned decidedly negative. During such an environment, the Fund tends to be cautious and seeks safety over potential upside. The subsequent 20% rise in the NASDAQ 100 Index was one of the fastest in its history. Having only a partial exposure during this time, the Fund trailed the Index from a return standpoint. While the defensive positions of the Fund were modestly profitable over the last few months, their returns trailed the NASDAQ 100 which contributed to the Fund’s underperformance. |
| Performance Past Does Not Indicate Future [Text] |
The Fund's past performance is not a good predictor of how the Fund will perform in the future.
|
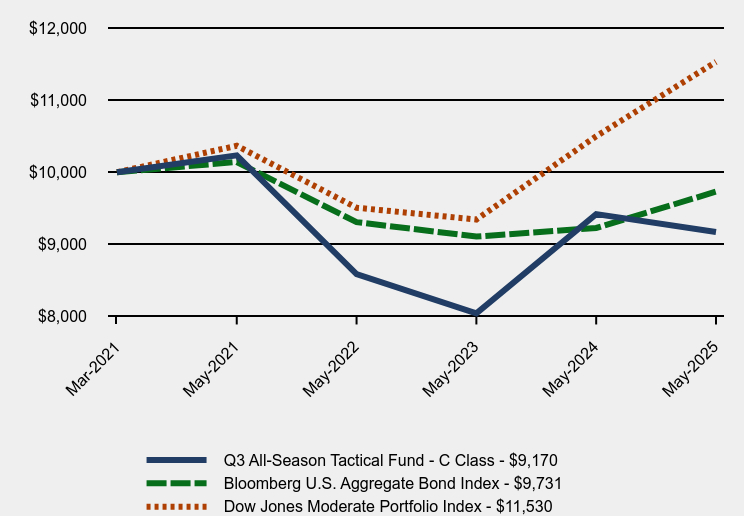
| Line Graph [Table Text Block] |
| Q3 All-Season Tactical Fund - C Class | Bloomberg U.S. Aggregate Bond Index | Dow Jones Moderate Portfolio Index |
|---|
Mar-2021 | $10,000 | $10,000 | $10,000 |
|---|
May-2021 | $10,234 | $10,142 | $10,367 |
|---|
May-2022 | $8,586 | $9,308 | $9,508 |
|---|
May-2023 | $8,044 | $9,108 | $9,344 |
|---|
May-2024 | $9,419 | $9,227 | $10,499 |
|---|
May-2025 | $9,170 | $9,731 | $11,530 |
|---|
|
| Average Annual Return [Table Text Block] |
| 1 Year | Since Inception (March 18, 2021) |
|---|
Q3 All-Season Tactical Fund - C Class | -2.64% | -2.04% |
|---|
Bloomberg U.S. Aggregate Bond Index | 5.46% | -0.65% |
|---|
Dow Jones Moderate Portfolio Index | 9.83% | 3.45% |
|---|
|
| Performance Inception Date |
Mar. 18, 2021
|
| No Deduction of Taxes [Text Block] |
The graph and table do not reflect the deduction of taxes that a shareholder would pay on fund distributions or redemption of fund shares.
|
| AssetsNet |
$ 33,053,126
|
| Holdings Count | Holding |
3
|
| Advisory Fees Paid, Amount |
$ 229,853
|
| InvestmentCompanyPortfolioTurnover |
0.00%
|
| Additional Fund Statistics [Text Block] |
- Net Assets$33,053,126
- Number of Portfolio Holdings3
- Advisory Fee (net of waivers)$229,853
- Portfolio Turnover0%
|
| Holdings [Text Block] |
Sector Weighting (% of net assets)Value | Value |
|---|
Other Assets in Excess of Liabilities | 8.9% | Money Market | 91.1% |
|
| Material Fund Change [Text Block] |
No material changes occurred during the period ended May 31, 2025. |
| C000238715 |
|
| Shareholder Report [Line Items] |
|
| Fund Name |
Q3 All-Season Active Rotation ETF
|
| Trading Symbol |
QVOY
|
| Security Exchange Name |
CboeBZX
|
| Annual or Semi-Annual Statement [Text Block] |
This semi-annual shareholder report contains important information about Q3 All-Season Active Rotation ETF (the "Fund") for the period of December 1, 2024 to May 31, 2025.
|
| Shareholder Report Annual or Semi-Annual |
Semi-Annual Shareholder Report
|
| Additional Information [Text Block] |
You can find additional information about the Fund at https://www.q3allseasonfunds.com/etf/. You can also request this information by contacting us at (888) 348-1255.
|
| Additional Information Phone Number |
(888) 348-1255
|
| Additional Information Website |
<span style="font-weight: 700; box-sizing: border-box; color: rgb(0, 0, 0); display: inline; flex-wrap: nowrap; font-size: 12px; grid-area: auto; line-height: 18px; margin: 0px; overflow: visible; text-align: left; text-align-last: left; white-space-collapse: preserve-breaks;">https://www.q3allseasonfunds.com/etf/</span>
|
| Expenses [Text Block] |
What were the Fund’s annualized costs for the last six months?(based on a hypothetical $10,000 investment)Fund Name | Costs of a $10,000 investment | Costs paid as a percentage of a $10,000 investment |
|---|
Q3 All-Season Active Rotation ETF | $55 | 1.13% |
|---|
|
| Expenses Paid, Amount |
$ 55
|
| Expense Ratio, Percent |
1.13%
|
| Factors Affecting Performance [Text Block] |
How did the Fund perform during the reporting period? Over the last six months, the Q3 All-Season Active Rotation ETF has held equity positions across all market capitalizations and the growth/value spectrum. During the period, large-cap growth stocks and international equities emerged as the leaders. The Fund’s performance lagged due to underexposure to international stocks and growth-based sectors. Such exposure generally comes from the Fund’s “active equity” sleeve. This portion of the portfolio, about 50%, will often be the driver of performance since it tends to hold positions which exhibit higher levels of volatility such as international, sector, and factor-based funds. Recently, the Fund had limited exposure to international markets, though the positions tended more towards the value end of the spectrum at a time when growth proved to be the stronger of the two. In addition, holdings in value-oriented sectors such as financials and gold miners proved to be a drag on returns as those sectors did not demonstrate sustained strength. The Fund’s minimal exposure to the fixed income market proved to have little overall effect on performance. As the bond markets were largely directionless over the last six months, the Fund’s positions in fixed income rotated from sector to sector including short-term bonds, emerging bonds, and corporate bonds. This rotation generated small gains throughout the period. The 15% allocation to an “alternative” sleeve of ETFs was able to contribute positively to the Fund’s performance. Positions in gold and platinum proved to be profitable as those metals hit multi-year highs during the period. Holdings in these positions, and others that tend to have low correlation to equities, help lower overall risk in the portfolio while providing upside potential. |
| Performance Past Does Not Indicate Future [Text] |
The Fund's past performance is not a good predictor of how the Fund will perform in the future.
|
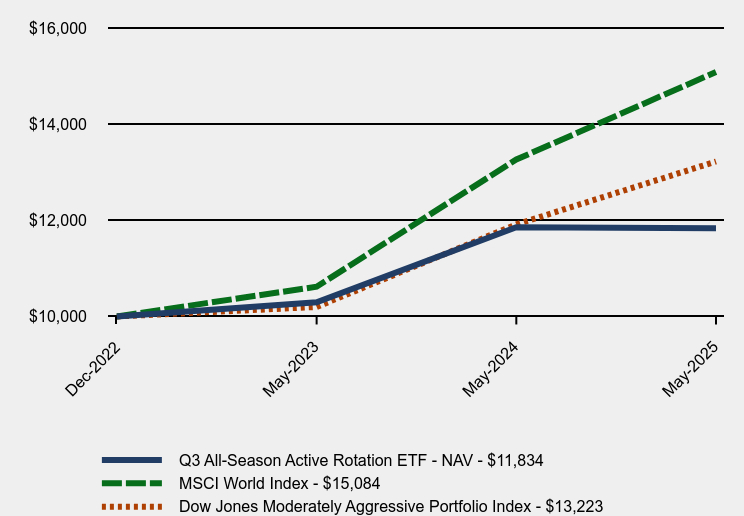
| Line Graph [Table Text Block] |
| Q3 All-Season Active Rotation ETF - NAV | MSCI World Index | Dow Jones Moderately Aggressive Portfolio Index |
|---|
Dec-2022 | $10,000 | $10,000 | $10,000 |
|---|
May-2023 | $10,295 | $10,619 | $10,197 |
|---|
May-2024 | $11,856 | $13,265 | $11,915 |
|---|
May-2025 | $11,834 | $15,084 | $13,223 |
|---|
|
| Average Annual Return [Table Text Block] |
| 1 Year | Since Inception (December 6, 2022) |
|---|
Q3 All-Season Active Rotation ETF | -0.18% | 7.02% |
|---|
MSCI World Index | 13.72% | 18.01% |
|---|
Dow Jones Moderately Aggressive Portfolio Index
| 10.99% | 11.91% |
|---|
|
| Performance Inception Date |
Dec. 06, 2022
|
| No Deduction of Taxes [Text Block] |
The graph and table do not reflect the deduction of taxes that a shareholder would pay on fund distributions or redemption of fund shares.
|
| Updated Performance Information Location [Text Block] |
Call (888) 348-1255 or visit https://www.q3allseasonfunds.com/etf/ for updated performance information.
|
| AssetsNet |
$ 43,938,723
|
| Holdings Count | Holding |
12
|
| Advisory Fees Paid, Amount |
$ 158,843
|
| InvestmentCompanyPortfolioTurnover |
328.00%
|
| Additional Fund Statistics [Text Block] |
- Net Assets$43,938,723
- Number of Portfolio Holdings12
- Advisory Fee (net of waivers)$158,843
- Portfolio Turnover328%
|
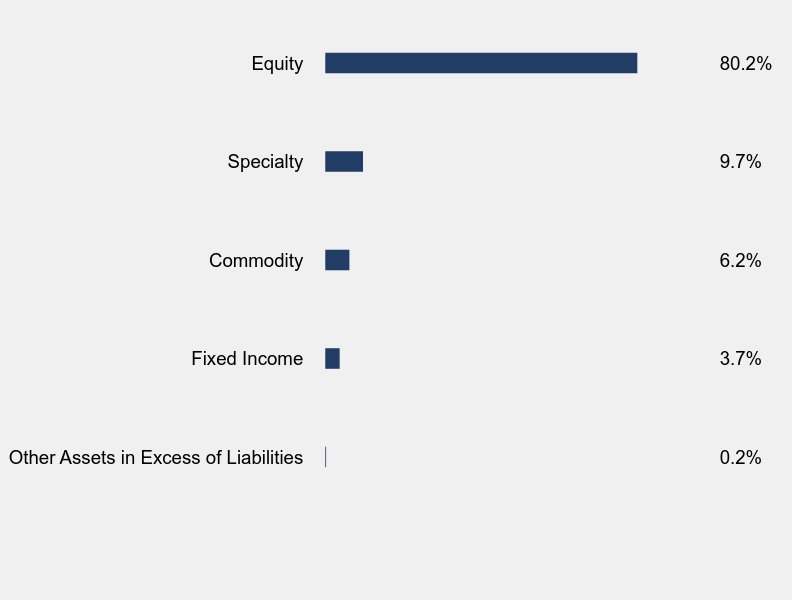
| Holdings [Text Block] |
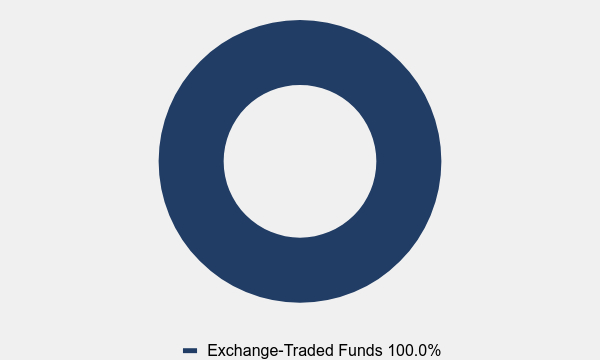
Asset Weighting (% of total investments)Value | Value |
|---|
Exchange-Traded Funds | 100.0% |
Sector Weighting (% of net assets)Value | Value |
|---|
Other Assets in Excess of Liabilities | 0.2% | Fixed Income | 3.7% | Commodity | 6.2% | Specialty | 9.7% | Equity | 80.2% |
Top 10 Holdings (% of net assets)Holding Name | % of Net Assets |
|---|
Vanguard FTSE Europe ETF | 14.5% |
|---|
Vanguard Mid-Cap Growth ETF | 14.1% |
|---|
iShares MSCI USA Momentum Factor ETF | 13.2% |
|---|
Invesco QQQ Trust, Series 1 | 13.1% |
|---|
Vanguard FTSE Pacific ETF | 12.8% |
|---|
SPDR Portfolio Developed World ex-US ETF | 12.5% |
|---|
SPDR Gold MiniShares Trust | 6.2% |
|---|
Invesco CurrencyShares Euro Currency Trust | 4.9% |
|---|
Invesco CurrencyShares Japanese Yen Trust | 4.8% |
|---|
SPDR Bloomberg International Treasury Bond ETF | 1.3% |
|---|
|
| Material Fund Change [Text Block] |
No material changes occurred during the period ended May 31, 2025. |