Shareholder Report
|
|
12 Months Ended |
Jun. 01, 2024 |
May 31, 2025
USD ($)
Holding
|
| Shareholder Report [Line Items] |
|
|
|
| Document Type |
|
|
N-CSR
|
| Amendment Flag |
|
|
false
|
| Registrant Name |
|
|
DBX ETF TRUST
|
| Entity Central Index Key |
|
|
0001503123
|
| Entity Investment Company Type |
|
|
N-1A
|
| Document Period End Date |
|
|
May 31, 2025
|
| C000250300 |
|
|
|
| Shareholder Report [Line Items] |
|
|
|
| Fund Name |
|
|
Xtrackers Artificial Intelligence and Big Data ETF
|
| Class Name |
|
|
Xtrackers Artificial Intelligence and Big Data ETF
|
| Trading Symbol |
|
|
XAIX
|
| Security Exchange Name |
|
|
NASDAQ
|
| Annual or Semi-Annual Statement [Text Block] |
|
|
This annual shareholder report contains important information about the Xtrackers Artificial Intelligence and Big Data ETF (the "Fund") for the period August 2, 2024 (commencement of operations) to May 31, 2025.
|
| Shareholder Report Annual or Semi-Annual |
|
|
Annual Shareholder Report
|
| Additional Information [Text Block] |
|
|
This annual shareholder report contains important information about the Xtrackers Artificial Intelligence and Big Data ETF (the "Fund") for the period August 2, 2024 (commencement of operations) to May 31, 2025. You can find additional information about the Fund at dws.com/etfreports. You can also request this information by contacting us at (844) 851‐4255.
|
| Additional Information Phone Number |
|
|
(844) 851‐4255
|
| Additional Information Website |
|
|
dws.com/etfreports
|
| Expenses [Text Block] |
|
|
What were the Fund costs for the reporting period?(Based on a hypothetical $10,000 investment)
Fund |
Costs of a $10,000 investment |
Costs paid as a percentage of a $10,000 investment |
XAIX |
$32Footnote Reference(a) |
0.35%Footnote Reference(b) | (a) Based on the period August 2, 2024 (commencement of operations) through May 31, 2025. Expenses would have been higher if the Fund had been in existence for the full reporting period. (b) Annualized. Gross expense ratio as of the latest prospectus: 0.35%. See prospectus for any contractual or voluntary waivers; without a waiver, costs would have been higher.
| Footnote |
Description |
Footnote(a) |
Based on the period August 2, 2024 (commencement of operations) through May 31, 2025. Expenses would have been higher if the Fund had been in existence for the full reporting period. |
Footnote(b) |
Annualized. | |
| Expenses Paid, Amount |
[1] |
|
$ 32
|
| Expense Ratio, Percent |
[2] |
|
0.35%
|
| Factors Affecting Performance [Text Block] |
|
|
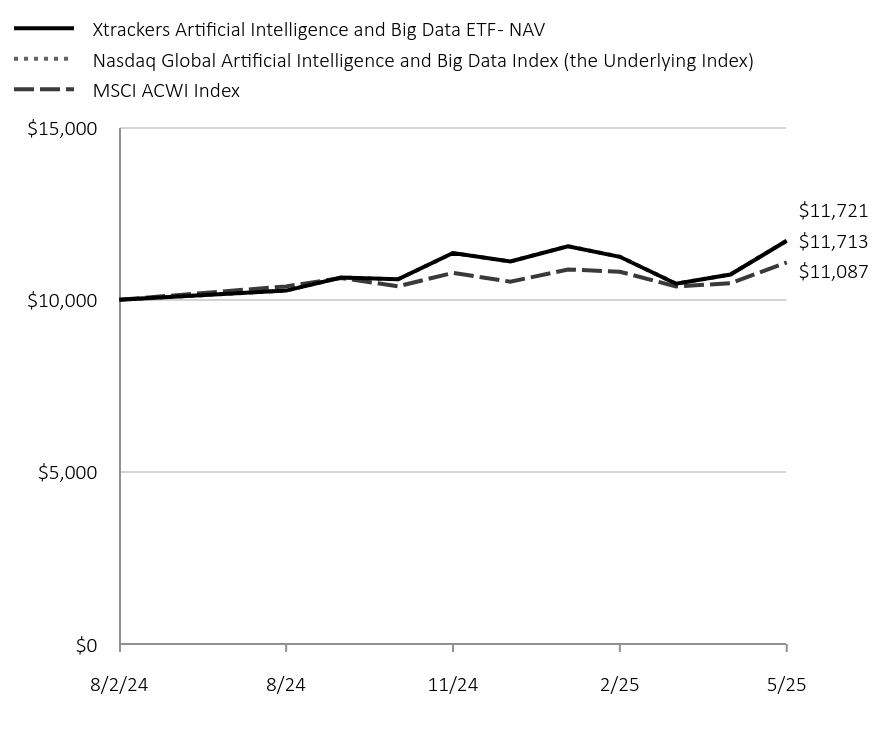
How did the fund perform last year and what affected its performance?The fund seeks investment results that correspond generally to the performance, before fees and expenses, of the Nasdaq Global Artificial Intelligence and Big Data Index (the Underlying Index). The Underlying Index is designed to track the performance of a selection of companies from global developed and emerging markets engaged in the following themes and sub-themes, each as defined by Nasdaq, Inc. (“Nasdaq” or “Index Provider”). The Fund returned 17.13% for the period ended May 31, 2025. The Fund's underlying index returned 17.21% and the Fund's broad-based index the MSCI ACWI Index returned 10.87% during the same period. All sectors contributed positively to performance during the period with the greatest contribution coming from Information Technology, Communication Services and Consumer Discretionary. From a geographical perspective, the United States, Germany and Japan were the major positive contributors, while Korea was the only that contributed negatively to performance. |
| Line Graph [Table Text Block] |
|
|
|
Xtrackers Artificial Intelligence and Big Data ETF - NAV |
Nasdaq Global Artificial Intelligence and Big Data Index (the Underlying Index) |
MSCI ACWI Index |
8/2/24 |
$10,000 |
$10,000 |
$10,000 |
8/31/24 |
$10,267 |
$10,268 |
$10,390 |
9/30/24 |
$10,645 |
$10,648 |
$10,632 |
10/31/24 |
$10,595 |
$10,594 |
$10,393 |
11/30/24 |
$11,359 |
$11,357 |
$10,782 |
12/31/24 |
$11,114 |
$11,113 |
$10,527 |
1/31/25 |
$11,557 |
$11,559 |
$10,880 |
2/28/25 |
$11,249 |
$11,252 |
$10,815 |
3/31/25 |
$10,467 |
$10,469 |
$10,387 |
4/30/25 |
$10,733 |
$10,735 |
$10,484 |
5/31/25 |
$11,713 |
$11,721 |
$11,087 |
|
| Average Annual Return [Table Text Block] |
|
|
Fund/Index |
Since Inception 8/2/24 |
Xtrackers Artificial Intelligence and Big Data ETF - NAV |
17.13% |
Nasdaq Global Artificial Intelligence and Big Data Index |
17.21% |
MSCI ACWI Index |
10.87% | Average Annual Total Returns Performance shown is historical. The Fund's past performance is not a good predictor or guarantee of the Fund's future performance. Investment returns and principal value of an investment will fluctuate so that an investor's shares, when redeemed, may be worth more or less than their original cost. Current performance may be lower or higher than the performance data quoted. The performance graph and returns table do not reflect the deduction of taxes that a shareholder would pay on Fund distributions or the sale of Fund shares. Shares are bought and sold at market price (closing price) not net asset value (NAV) and are not individually redeemed from the Fund. To obtain the most recent month-end performance data visit etf.dws.com/en-us/etf-products or call (844) 851-4255. |
| AssetsNet |
|
|
$ 42,484,460
|
| Holdings Count | Holding |
|
|
94
|
| Advisory Fees Paid, Amount |
|
|
$ 69,255
|
| InvestmentCompanyPortfolioTurnover |
|
|
11.00%
|
| Additional Fund Statistics [Text Block] |
|
|
Net Assets ($) |
42,484,460 |
Number of Portfolio Holdings |
94 |
Portfolio Turnover Rate (%) |
11 |
Total Net Advisory Fees Paid ($) |
69,255 | |
| Holdings [Text Block] |
|
|
Sector |
% of Net Assets |
Software |
38% |
Semiconductors & Semiconductor Equipment |
11% |
Technology Hardware, Storage & Peripherals |
9% |
Interactive Media & Services |
9% |
IT Services |
7% |
Diversified Telecommunication Services |
6% |
Banks |
6% |
Communications Equipment |
6% |
Broadline Retail |
4% |
Financial Services |
1% |
Other |
1% | |
| Largest Holdings [Text Block] |
|
|
Ten Largest Equity Holdings
Holdings |
41.9% of Net Assets |
SAP SE |
4.9% |
Meta Platforms, Inc. |
4.6% |
Microsoft Corp. |
4.6% |
NVIDIA Corp. |
4.2% |
Bank of America Corp. |
4.2% |
Palantir Technologies, Inc. |
4.1% |
Oracle Corp. |
4.1% |
Amazon.com, Inc. |
3.9% |
Alphabet, Inc. |
3.8% |
Cisco Systems, Inc. |
3.5% | |
| Updated Prospectus Phone Number |
|
|
(844) 851-4255
|
| Updated Prospectus Web Address |
|
|
dws.com/en-us/resources/proxy-voting
|
| C000242878 |
|
|
|
| Shareholder Report [Line Items] |
|
|
|
| Fund Name |
|
|
Xtrackers Cybersecurity Select Equity ETF
|
| Class Name |
|
|
Xtrackers Cybersecurity Select Equity ETF
|
| Trading Symbol |
|
|
PSWD
|
| Security Exchange Name |
|
|
NASDAQ
|
| Annual or Semi-Annual Statement [Text Block] |
|
|
This annual shareholder report contains important information about the Xtrackers Cybersecurity Select Equity ETF (the "Fund") for the period June 1, 2024 to May 31, 2025.
|
| Shareholder Report Annual or Semi-Annual |
|
|
Annual Shareholder Report
|
| Additional Information [Text Block] |
|
|
This annual shareholder report contains important information about the Xtrackers Cybersecurity Select Equity ETF (the "Fund") for the period June 1, 2024 to May 31, 2025. You can find additional information about the Fund at dws.com/etfreports. You can also request this information by contacting us at (844) 851‐4255.
|
| Additional Information Phone Number |
|
|
(844) 851‐4255
|
| Additional Information Website |
|
|
dws.com/etfreports
|
| Expenses [Text Block] |
|
|
What were the Fund costs for the last year?(Based on a hypothetical $10,000 investment)
Fund |
Costs of a $10,000 investment |
Costs paid as a percentage of a $10,000 investment |
PSWD |
$22 |
0.20% | Gross expense ratio as of the latest prospectus: 0.20%. See prospectus for any contractual or voluntary waivers; without a waiver, costs would have been higher. |
| Expenses Paid, Amount |
|
|
$ 22
|
| Expense Ratio, Percent |
|
|
0.20%
|
| Factors Affecting Performance [Text Block] |
|
|
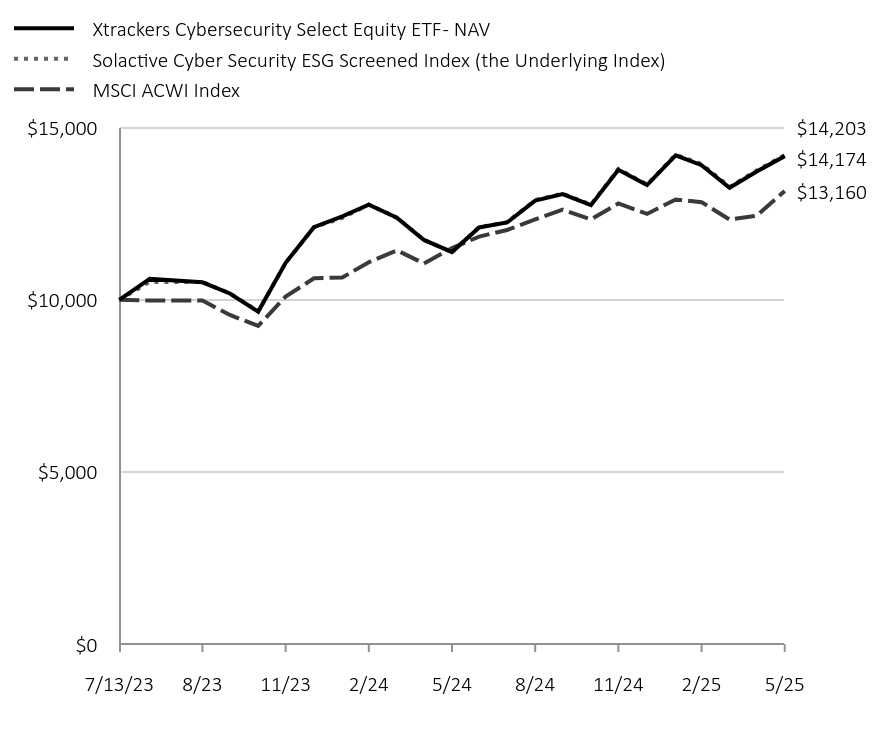
How did the fund perform last year and what affected its performance?The Fund seeks investment results that correspond generally to the performance, before fees and expenses, of the Solactive Cyber Security ESG Screened Index (the Underlying Index). The Underlying Index is comprised of companies that have business operations in the field of cybersecurity and that fulfill certain sustainability criteria. The Fund returned 24.47% for the period ended May 31, 2025. The Fund's underlying index returned 24.67% and the Fund's broad-based index the MSCI ACWI Index returned 13.65% during the same period. The majority of sectors contributed positively to performance during the period with the greatest contribution coming from Systems Software, IT Consulting & Other Services and Communication Equipment. Internet Services & Infrastructure and Research & Consulting Services were the only sectors that detracted from the performance. From a geographical perspective, the United States, Japan and Canada were the major positive contributors, while Australia, Turkey and Malaysia contributed negatively to performance. |
| Line Graph [Table Text Block] |
|
|
|
Xtrackers Cybersecurity Select Equity ETF - NAV |
Solactive Cyber Security ESG Screened Index (the Underlying Index) |
MSCI ACWI Index |
7/13/23 |
$10,000 |
$10,000 |
$10,000 |
7/31/23 |
$10,607 |
$10,520 |
$9,979 |
8/31/23 |
$10,507 |
$10,520 |
$9,979 |
9/30/23 |
$10,184 |
$10,188 |
$9,559 |
10/31/23 |
$9,657 |
$9,663 |
$9,241 |
11/30/23 |
$11,076 |
$11,071 |
$10,095 |
12/31/23 |
$12,109 |
$12,108 |
$10,624 |
1/31/24 |
$12,425 |
$12,378 |
$10,648 |
2/29/24 |
$12,766 |
$12,767 |
$11,093 |
3/31/24 |
$12,388 |
$12,388 |
$11,437 |
4/30/24 |
$11,739 |
$11,737 |
$11,056 |
5/31/24 |
$11,387 |
$11,392 |
$11,503 |
6/30/24 |
$12,102 |
$12,109 |
$11,837 |
7/31/24 |
$12,246 |
$12,255 |
$12,028 |
8/31/24 |
$12,881 |
$12,896 |
$12,334 |
9/30/24 |
$13,072 |
$13,087 |
$12,620 |
10/31/24 |
$12,748 |
$12,765 |
$12,337 |
11/30/24 |
$13,776 |
$13,800 |
$12,798 |
12/31/24 |
$13,334 |
$13,349 |
$12,495 |
1/31/25 |
$14,194 |
$14,216 |
$12,915 |
2/28/25 |
$13,910 |
$13,945 |
$12,837 |
3/31/25 |
$13,253 |
$13,280 |
$12,330 |
4/30/25 |
$13,727 |
$13,758 |
$12,445 |
5/31/25 |
$14,174 |
$14,203 |
$13,160 |
|
| Average Annual Return [Table Text Block] |
|
|
Fund/Index |
1-Year |
Since Inception 7/13/23 |
Xtrackers Cybersecurity Select Equity ETF - NAV |
24.47% |
20.29% |
Solactive Cyber Security ESG Screened Index |
24.67% |
20.43% |
MSCI ACWI Index |
13.65% |
15.66% | Average Annual Total Returns Performance shown is historical. The Fund's past performance is not a good predictor or guarantee of the Fund's future performance. Investment returns and principal value of an investment will fluctuate so that an investor's shares, when redeemed, may be worth more or less than their original cost. Current performance may be lower or higher than the performance data quoted. The performance graph and returns table do not reflect the deduction of taxes that a shareholder would pay on Fund distributions or the sale of Fund shares. Shares are bought and sold at market price (closing price) not net asset value (NAV) and are not individually redeemed from the Fund. To obtain the most recent month-end performance data visit etf.dws.com/en-us/etf-products or call (844) 851-4255. |
| AssetsNet |
|
|
$ 7,815,324
|
| Holdings Count | Holding |
|
|
52
|
| Advisory Fees Paid, Amount |
|
|
$ 13,218
|
| InvestmentCompanyPortfolioTurnover |
|
|
49.00%
|
| Additional Fund Statistics [Text Block] |
|
|
Net Assets ($) |
7,815,324 |
Number of Portfolio Holdings |
52 |
Portfolio Turnover Rate (%) |
49 |
Total Net Advisory Fees Paid ($) |
13,218 | |
| Holdings [Text Block] |
|
|
Sector |
% of Net Assets |
Systems Software |
57% |
Internet Services & Infrastructure |
23% |
IT Consulting & Other Services |
8% |
Application Software |
6% |
Communications Equipment |
2% |
Research & Consulting Services |
2% | |
| Largest Holdings [Text Block] |
|
|
Ten Largest Equity Holdings
Holdings |
47.2% of Net Assets |
NEXTDC Ltd. |
5.6% |
Zscaler, Inc. |
5.5% |
Crowdstrike Holdings, Inc. |
5.0% |
Trend Micro, Inc. |
4.7% |
Varonis Systems, Inc. |
4.6% |
Palo Alto Networks, Inc. |
4.4% |
GDS Holdings Ltd. |
4.4% |
Qualys, Inc. |
4.4% |
CyberArk Software Ltd. |
4.4% |
Check Point Software Technologies Ltd. |
4.2% | |
| Updated Prospectus Phone Number |
|
|
(844) 851-4255
|
| Updated Prospectus Web Address |
|
|
dws.com/en-us/resources/proxy-voting
|
| C000130526 |
|
|
|
| Shareholder Report [Line Items] |
|
|
|
| Fund Name |
|
|
Xtrackers International Real Estate ETF
|
| Class Name |
|
|
Xtrackers International Real Estate ETF
|
| Trading Symbol |
|
|
HAUZ
|
| Security Exchange Name |
|
|
NYSEArca
|
| Annual or Semi-Annual Statement [Text Block] |
|
|
This annual shareholder report contains important information about the Xtrackers International Real Estate ETF (the "Fund") for the period June 1, 2024 to May 31, 2025.
|
| Shareholder Report Annual or Semi-Annual |
|
|
Annual Shareholder Report
|
| Additional Information [Text Block] |
|
|
This annual shareholder report contains important information about the Xtrackers International Real Estate ETF (the "Fund") for the period June 1, 2024 to May 31, 2025. You can find additional information about the Fund at dws.com/etfreports. You can also request this information by contacting us at (844) 851‐4255.
|
| Additional Information Phone Number |
|
|
(844) 851‐4255
|
| Additional Information Website |
|
|
dws.com/etfreports
|
| Expenses [Text Block] |
|
|
What were the Fund costs for the last year?(Based on a hypothetical $10,000 investment)
Fund |
Costs of a $10,000 investment |
Costs paid as a percentage of a $10,000 investment |
HAUZ |
$11 |
0.10% | Gross expense ratio as of the latest prospectus: 0.10%. See prospectus for any contractual or voluntary waivers; without a waiver, costs would have been higher. |
| Expenses Paid, Amount |
|
|
$ 11
|
| Expense Ratio, Percent |
|
|
0.10%
|
| Factors Affecting Performance [Text Block] |
|
|
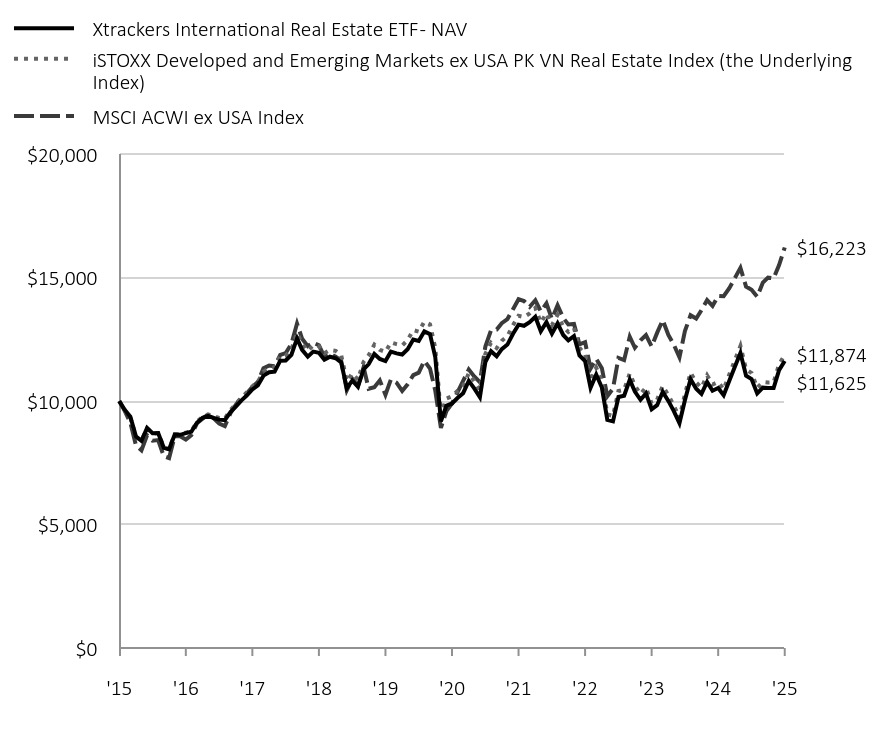
How did the fund perform last year and what affected its performance?The Fund seeks investment results that correspond generally to the performance, before fees and expenses, of the iSTOXX Developed and Emerging Markets ex USA PK VN Real Estate Index (the Underlying Index). The Underlying Index is a free-float capitalization weighted index that provides exposure to publicly traded real estate securities in countries outside the United States, excluding Pakistan and Vietnam. The Fund returned 10.39% for the period ended May 31, 2025. The Fund's underlying index returned 10.16% and the Fund's broad-based index the MSCI ACWI ex USA Index returned 13.75% during the same period. The majority of sectors contributed positively to performance during the period with the greatest contribution coming from Real Estate Operating Companies, Retail REITs and Diversified Real Estate Activities. The Real Estate Development, Industrial REITs and Self-Storage REITs sectors detracted from the performance. From a geographical perspective, the majority of countries contributed positively to performance during the period with the greatest contribution coming from Japan, Australia and Switzerland while Thailand, Taiwan and Philippines contributed negatively to performance. |
| Line Graph [Table Text Block] |
|
|
|
Xtrackers International Real Estate ETF - NAV |
iSTOXX Developed and Emerging Markets ex USA PK VN Real Estate Index (the Underlying Index) |
MSCI ACWI ex USA Index |
'15 |
$10,000 |
$10,000 |
$10,000 |
'15 |
$9,648 |
$9,614 |
$9,607 |
'15 |
$9,372 |
$9,324 |
$9,125 |
'15 |
$8,565 |
$8,558 |
$8,198 |
'15 |
$8,389 |
$8,397 |
$8,009 |
'15 |
$8,915 |
$8,899 |
$8,614 |
'15 |
$8,702 |
$8,682 |
$8,398 |
'15 |
$8,706 |
$8,707 |
$8,423 |
'16 |
$8,112 |
$8,132 |
$7,763 |
'16 |
$8,050 |
$8,061 |
$7,693 |
'16 |
$8,644 |
$8,659 |
$8,582 |
'16 |
$8,636 |
$8,657 |
$8,576 |
'16 |
$8,702 |
$8,724 |
$8,443 |
'16 |
$8,758 |
$8,774 |
$8,622 |
'16 |
$9,124 |
$9,169 |
$9,102 |
'16 |
$9,325 |
$9,365 |
$9,291 |
'16 |
$9,400 |
$9,464 |
$9,457 |
'16 |
$9,317 |
$9,383 |
$9,300 |
'16 |
$9,250 |
$9,319 |
$9,093 |
'16 |
$9,231 |
$9,298 |
$8,991 |
'17 |
$9,554 |
$9,641 |
$9,513 |
'17 |
$9,766 |
$9,871 |
$9,841 |
'17 |
$10,022 |
$10,138 |
$10,144 |
'17 |
$10,226 |
$10,347 |
$10,303 |
'17 |
$10,472 |
$10,598 |
$10,578 |
'17 |
$10,642 |
$10,784 |
$10,773 |
'17 |
$11,033 |
$11,194 |
$11,330 |
'17 |
$11,168 |
$11,339 |
$11,445 |
'17 |
$11,194 |
$11,371 |
$11,412 |
'17 |
$11,638 |
$11,834 |
$11,875 |
'17 |
$11,644 |
$11,846 |
$11,948 |
'17 |
$11,868 |
$12,092 |
$12,317 |
'18 |
$12,538 |
$12,764 |
$13,144 |
'18 |
$12,075 |
$12,314 |
$12,523 |
'18 |
$11,800 |
$12,036 |
$12,228 |
'18 |
$12,005 |
$12,267 |
$12,367 |
'18 |
$11,959 |
$12,219 |
$12,265 |
'18 |
$11,674 |
$11,939 |
$11,804 |
'18 |
$11,798 |
$12,072 |
$11,931 |
'18 |
$11,737 |
$12,037 |
$11,798 |
'18 |
$11,571 |
$11,870 |
$11,635 |
'18 |
$10,524 |
$10,803 |
$10,441 |
'18 |
$10,829 |
$11,119 |
$10,907 |
'18 |
$10,589 |
$10,871 |
$10,602 |
'19 |
$11,281 |
$11,592 |
$11,374 |
'19 |
$11,502 |
$11,857 |
$10,500 |
'19 |
$11,911 |
$12,287 |
$10,562 |
'19 |
$11,710 |
$12,078 |
$10,841 |
'19 |
$11,625 |
$11,995 |
$10,260 |
'19 |
$12,008 |
$12,383 |
$10,877 |
'19 |
$11,935 |
$12,307 |
$10,746 |
'19 |
$11,887 |
$12,251 |
$10,414 |
'19 |
$12,101 |
$12,473 |
$10,682 |
'19 |
$12,492 |
$12,876 |
$11,054 |
'19 |
$12,434 |
$12,816 |
$11,152 |
'19 |
$12,826 |
$13,217 |
$11,635 |
'20 |
$12,716 |
$13,108 |
$11,322 |
'20 |
$11,790 |
$12,152 |
$10,427 |
'20 |
$9,185 |
$9,461 |
$8,918 |
'20 |
$9,814 |
$10,106 |
$9,593 |
'20 |
$9,906 |
$10,198 |
$9,907 |
'20 |
$10,128 |
$10,416 |
$10,355 |
'20 |
$10,323 |
$10,616 |
$10,817 |
'20 |
$10,820 |
$11,127 |
$11,280 |
'20 |
$10,514 |
$10,814 |
$11,002 |
'20 |
$10,158 |
$10,447 |
$10,766 |
'20 |
$11,586 |
$11,919 |
$12,214 |
'20 |
$12,024 |
$12,365 |
$12,874 |
'21 |
$11,816 |
$12,151 |
$12,902 |
'21 |
$12,104 |
$12,445 |
$13,158 |
'21 |
$12,291 |
$12,633 |
$13,324 |
'21 |
$12,717 |
$13,068 |
$13,716 |
'21 |
$13,098 |
$13,459 |
$14,130 |
'21 |
$13,051 |
$13,405 |
$14,054 |
'21 |
$13,196 |
$13,553 |
$13,822 |
'21 |
$13,420 |
$13,777 |
$14,085 |
'21 |
$12,832 |
$13,183 |
$13,634 |
'21 |
$13,200 |
$13,557 |
$13,959 |
'21 |
$12,733 |
$13,081 |
$13,331 |
'21 |
$13,148 |
$13,498 |
$13,881 |
'22 |
$12,679 |
$13,015 |
$13,370 |
'22 |
$12,462 |
$12,802 |
$13,105 |
'22 |
$12,635 |
$12,968 |
$13,126 |
'22 |
$11,851 |
$12,159 |
$12,302 |
'22 |
$11,622 |
$11,916 |
$12,390 |
'22 |
$10,540 |
$10,806 |
$11,324 |
'22 |
$11,077 |
$11,357 |
$11,712 |
'22 |
$10,550 |
$10,818 |
$11,335 |
'22 |
$9,240 |
$9,464 |
$10,203 |
'22 |
$9,179 |
$9,399 |
$10,507 |
'22 |
$10,169 |
$10,412 |
$11,748 |
'22 |
$10,219 |
$10,458 |
$11,660 |
'23 |
$10,867 |
$11,121 |
$12,606 |
'23 |
$10,384 |
$10,625 |
$12,163 |
'23 |
$10,053 |
$10,288 |
$12,461 |
'23 |
$10,311 |
$10,553 |
$12,677 |
'23 |
$9,669 |
$9,893 |
$12,216 |
'23 |
$9,835 |
$10,060 |
$12,764 |
'23 |
$10,375 |
$10,615 |
$13,283 |
'23 |
$10,009 |
$10,239 |
$12,683 |
'23 |
$9,597 |
$9,821 |
$12,283 |
'23 |
$9,107 |
$9,320 |
$11,776 |
'23 |
$10,038 |
$10,277 |
$12,836 |
'23 |
$10,891 |
$11,152 |
$13,481 |
'24 |
$10,499 |
$10,753 |
$13,347 |
'24 |
$10,297 |
$10,547 |
$13,685 |
'24 |
$10,781 |
$11,043 |
$14,092 |
'24 |
$10,422 |
$10,675 |
$13,859 |
'24 |
$10,531 |
$10,778 |
$14,262 |
'24 |
$10,241 |
$10,475 |
$14,248 |
'24 |
$10,827 |
$11,078 |
$14,578 |
'24 |
$11,399 |
$11,663 |
$14,993 |
'24 |
$11,952 |
$12,235 |
$15,397 |
'24 |
$11,027 |
$11,281 |
$14,641 |
'24 |
$10,893 |
$11,141 |
$14,509 |
'24 |
$10,314 |
$10,541 |
$14,227 |
'25 |
$10,545 |
$10,775 |
$14,800 |
'25 |
$10,529 |
$10,751 |
$15,006 |
'25 |
$10,533 |
$10,759 |
$14,971 |
'25 |
$11,254 |
$11,495 |
$15,512 |
'25 |
$11,625 |
$11,874 |
$16,223 |
|
| Average Annual Return [Table Text Block] |
|
|
Fund/Index |
1-Year |
5-Year |
10-Year |
Xtrackers International Real Estate ETF - NAV |
10.39% |
3.25% |
1.52% |
iSTOXX Developed and Emerging Markets ex USA PK VN Real Estate Index |
10.16% |
3.09% |
1.73% |
MSCI ACWI ex USA Index |
13.75% |
10.37% |
5.47% | |
| Material Change Date |
|
Jun. 01, 2024
|
|
| AssetsNet |
|
|
$ 824,687,814
|
| Holdings Count | Holding |
|
|
387
|
| Advisory Fees Paid, Amount |
|
|
$ 737,455
|
| InvestmentCompanyPortfolioTurnover |
|
|
8.00%
|
| Additional Fund Statistics [Text Block] |
|
|
Net Assets ($) |
824,687,814 |
Number of Portfolio Holdings |
387 |
Portfolio Turnover Rate (%) |
8 |
Total Net Advisory Fees Paid ($) |
737,455 | |
| Holdings [Text Block] |
|
|
Sector |
% of Net Assets |
Real Estate Operations/Development |
33% |
Diversified |
14% |
Real Estate Management/Services |
13% |
Warehouse/Industry |
12% |
Shopping Centers |
10% |
Office Property |
5% |
Apartments |
4% |
Regional Malls |
2% |
Health Care |
2% |
E-Commerce/Services |
1% |
Other |
0% | Geographical Diversification
Country |
% of Net Assets |
Japan |
22% |
Australia |
13% |
Hong Kong |
10% |
United Kingdom |
8% |
Canada |
6% |
Singapore |
6% |
Sweden |
4% |
Germany |
4% |
France |
4% |
Switzerland |
3% |
Israel |
2% |
Other |
17% | |
| Largest Holdings [Text Block] |
|
|
Ten Largest Equity Holdings
Holdings |
22.6% of Net Assets |
Goodman Group (Australia) |
4.9% |
Mitsui Fudosan Co. Ltd. (Japan) |
3.0% |
Mitsubishi Estate Co. Ltd. (Japan) |
2.6% |
Vonovia SE (Germany) |
2.6% |
Sumitomo Realty & Development Co. Ltd. (Japan) |
2.1% |
Sun Hung Kai Properties Ltd. (Hong Kong) |
1.8% |
Link (Hong Kong) |
1.6% |
Scentre Group (Australia) |
1.4% |
Segro PLC (United Kingdom) |
1.3% |
Swiss Prime Site AG (Switzerland) |
1.3% | |
| Material Fund Change [Text Block] |
|
|
This is a summary of certain changes of the Fund since June 1, 2024. For more information, review the Fund's current prospectus at dws.com/etfreports, or by calling (844) 851-4255. Effective August 13, 2024, the Fund’s unitary advisory fee was reduced from 0.12% to 0.10%. At the same time, the Board terminated the contractual expense limitation that capped the fund’s operating expenses at the same level because of the redundancy. |
| Material Fund Change Expenses [Text Block] |
|
|
Effective August 13, 2024, the Fund’s unitary advisory fee was reduced from 0.12% to 0.10%. At the same time, the Board terminated the contractual expense limitation that capped the fund’s operating expenses at the same level because of the redundancy.
|
| Updated Prospectus Phone Number |
|
|
(844) 851-4255
|
| Updated Prospectus Web Address |
|
|
dws.com/en-us/resources/proxy-voting
|
| C000242879 |
|
|
|
| Shareholder Report [Line Items] |
|
|
|
| Fund Name |
|
|
Xtrackers Semiconductor Select Equity ETF
|
| Class Name |
|
|
Xtrackers Semiconductor Select Equity ETF
|
| Trading Symbol |
|
|
CHPS
|
| Security Exchange Name |
|
|
NASDAQ
|
| Annual or Semi-Annual Statement [Text Block] |
|
|
This annual shareholder report contains important information about the Xtrackers Semiconductor Select Equity ETF (the "Fund") for the period June 1, 2024 to May 31, 2025.
|
| Shareholder Report Annual or Semi-Annual |
|
|
Annual Shareholder Report
|
| Additional Information [Text Block] |
|
|
This annual shareholder report contains important information about the Xtrackers Semiconductor Select Equity ETF (the "Fund") for the period June 1, 2024 to May 31, 2025. You can find additional information about the Fund at dws.com/etfreports. You can also request this information by contacting us at (844) 851‐4255.
|
| Additional Information Phone Number |
|
|
(844) 851‐4255
|
| Additional Information Website |
|
|
dws.com/etfreports
|
| Expenses [Text Block] |
|
|
What were the Fund costs for the last year?(Based on a hypothetical $10,000 investment)
Fund |
Costs of a $10,000 investment |
Costs paid as a percentage of a $10,000 investment |
CHPS |
$14 |
0.15% | Gross expense ratio as of the latest prospectus: 0.15%. See prospectus for any contractual or voluntary waivers; without a waiver, costs would have been higher. |
| Expenses Paid, Amount |
|
|
$ 14
|
| Expense Ratio, Percent |
|
|
0.15%
|
| Factors Affecting Performance [Text Block] |
|
|
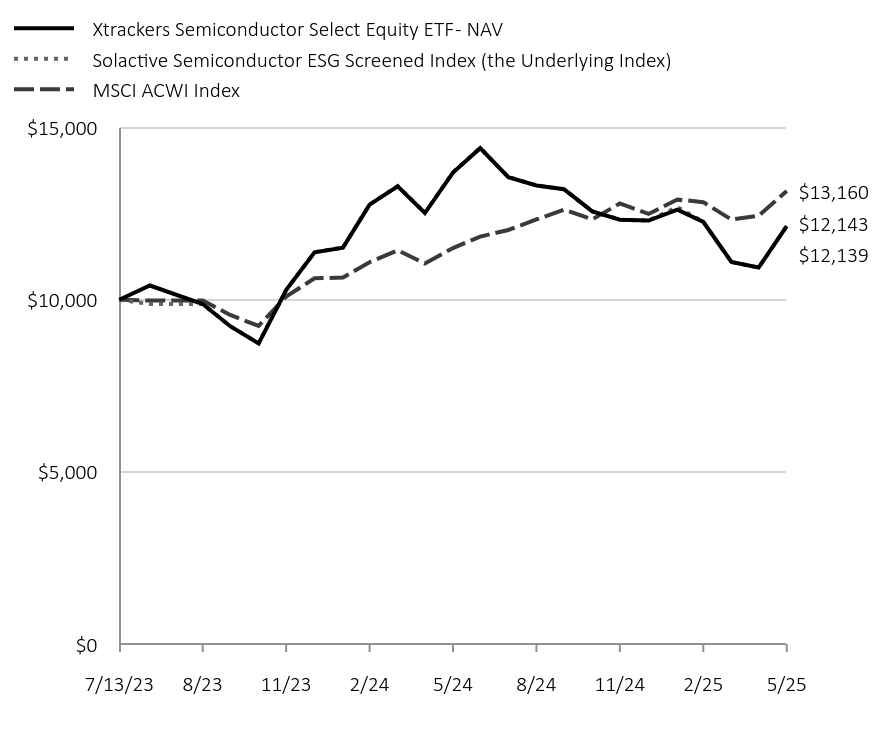
How did the fund perform last year and what affected its performance?The Fund seeks investment results that correspond generally to the performance, before fees and expenses, of the Solactive Semiconductor ESG Screened Index (the Underlying Index). The Underlying Index is comprised of companies that have business operations in the semiconductor industry and that fulfill certain sustainability criteria. The Fund returned -11.35% for the period ended May 31, 2025. The Fund's underlying index returned -11.43% and the Fund's broad-based index the MSCI ACWI Index returned 13.65% during the same period. The Electronic Components was the only sector that contributed positively to performance during the period. The Semiconductor Materials & Equipment, Semiconductors and Industrial Machinery & Supplies & Components sectors detracted from the performance. From a geographical perspective, Taiwan, Korea and Israel were the major positive contributors while the United States, Japan and Netherlands contributed negatively to performance. |
| Line Graph [Table Text Block] |
|
|
|
Xtrackers Semiconductor Select Equity ETF - NAV |
Solactive Semiconductor ESG Screened Index (the Underlying Index) |
MSCI ACWI Index |
7/13/23 |
$10,000 |
$10,000 |
$10,000 |
7/31/23 |
$10,415 |
$9,880 |
$9,979 |
8/31/23 |
$9,876 |
$9,880 |
$9,979 |
9/30/23 |
$9,232 |
$9,234 |
$9,559 |
10/31/23 |
$8,733 |
$8,736 |
$9,241 |
11/30/23 |
$10,280 |
$10,284 |
$10,095 |
12/31/23 |
$11,379 |
$11,383 |
$10,624 |
1/31/24 |
$11,515 |
$11,520 |
$10,648 |
2/29/24 |
$12,764 |
$12,770 |
$11,093 |
3/31/24 |
$13,296 |
$13,302 |
$11,437 |
4/30/24 |
$12,521 |
$12,527 |
$11,056 |
5/31/24 |
$13,698 |
$13,705 |
$11,503 |
6/30/24 |
$14,406 |
$14,413 |
$11,837 |
7/31/24 |
$13,560 |
$13,566 |
$12,028 |
8/31/24 |
$13,323 |
$13,326 |
$12,334 |
9/30/24 |
$13,211 |
$13,210 |
$12,620 |
10/31/24 |
$12,570 |
$12,568 |
$12,337 |
11/30/24 |
$12,328 |
$12,330 |
$12,798 |
12/31/24 |
$12,301 |
$12,301 |
$12,495 |
1/31/25 |
$12,617 |
$12,691 |
$12,915 |
2/28/25 |
$12,265 |
$12,266 |
$12,837 |
3/31/25 |
$11,099 |
$11,095 |
$12,330 |
4/30/25 |
$10,938 |
$10,933 |
$12,445 |
5/31/25 |
$12,143 |
$12,139 |
$13,160 |
|
| Average Annual Return [Table Text Block] |
|
|
Fund/Index |
1-Year |
Since Inception 7/13/23 |
Xtrackers Semiconductor Select Equity ETF - NAV |
-11.35% |
10.83% |
Solactive Semiconductor ESG Screened Index |
-11.43% |
10.81% |
MSCI ACWI Index |
13.65% |
15.66% | Average Annual Total Returns Performance shown is historical. The Fund's past performance is not a good predictor or guarantee of the Fund's future performance. Investment returns and principal value of an investment will fluctuate so that an investor's shares, when redeemed, may be worth more or less than their original cost. Current performance may be lower or higher than the performance data quoted. The performance graph and returns table do not reflect the deduction of taxes that a shareholder would pay on Fund distributions or the sale of Fund shares. Shares are bought and sold at market price (closing price) not net asset value (NAV) and are not individually redeemed from the Fund. To obtain the most recent month-end performance data visit etf.dws.com/en-us/etf-products or call (844) 851-4255. |
| AssetsNet |
|
|
$ 6,975,779
|
| Holdings Count | Holding |
|
|
54
|
| Advisory Fees Paid, Amount |
|
|
$ 10,872
|
| InvestmentCompanyPortfolioTurnover |
|
|
19.00%
|
| Additional Fund Statistics [Text Block] |
|
|
Net Assets ($) |
6,975,779 |
Number of Portfolio Holdings |
54 |
Portfolio Turnover Rate (%) |
19 |
Total Net Advisory Fees Paid ($) |
10,872 | |
| Holdings [Text Block] |
|
|
Sector |
% of Net Assets |
Semiconductors |
69% |
Semiconductor Materials & Equipment |
29% |
Electronic Components |
1% |
Industrial Machinery & Supplies |
1% |
Electronic Manufacturing Services |
1% | |
| Largest Holdings [Text Block] |
|
|
Ten Largest Equity Holdings
Holdings |
45.3% of Net Assets |
Taiwan Semiconductor Manufacturing Co. Ltd. |
5.2% |
Broadcom, Inc. |
5.0% |
ASML Holding NV |
4.6% |
Micron Technology, Inc. |
4.6% |
NVIDIA Corp. |
4.5% |
SK Hynix, Inc. |
4.4% |
Advanced Micro Devices, Inc. |
4.4% |
Lam Research Corp. |
4.3% |
Analog Devices, Inc. |
4.2% |
Texas Instruments, Inc. |
4.1% | |
| Updated Prospectus Phone Number |
|
|
(844) 851-4255
|
| Updated Prospectus Web Address |
|
|
dws.com/en-us/resources/proxy-voting
|
| C000242880 |
|
|
|
| Shareholder Report [Line Items] |
|
|
|
| Fund Name |
|
|
Xtrackers US Green Infrastructure Select Equity ETF
|
| Class Name |
|
|
Xtrackers US Green Infrastructure Select Equity ETF
|
| Trading Symbol |
|
|
UPGR
|
| Security Exchange Name |
|
|
NASDAQ
|
| Annual or Semi-Annual Statement [Text Block] |
|
|
This annual shareholder report contains important information about the Xtrackers US Green Infrastructure Select Equity ETF (the "Fund") for the period June 1, 2024 to May 31, 2025.
|
| Shareholder Report Annual or Semi-Annual |
|
|
Annual Shareholder Report
|
| Additional Information [Text Block] |
|
|
This annual shareholder report contains important information about the Xtrackers US Green Infrastructure Select Equity ETF (the "Fund") for the period June 1, 2024 to May 31, 2025. You can find additional information about the Fund at dws.com/etfreports. You can also request this information by contacting us at (844) 851‐4255.
|
| Additional Information Phone Number |
|
|
(844) 851‐4255
|
| Additional Information Website |
|
|
dws.com/etfreports
|
| Expenses [Text Block] |
|
|
What were the Fund costs for the last year?(Based on a hypothetical $10,000 investment)
Fund |
Costs of a $10,000 investment |
Costs paid as a percentage of a $10,000 investment |
UPGR |
$32 |
0.35% | Gross expense ratio as of the latest prospectus: 0.35%. See prospectus for any contractual or voluntary waivers; without a waiver, costs would have been higher. |
| Expenses Paid, Amount |
|
|
$ 32
|
| Expense Ratio, Percent |
|
|
0.35%
|
| Factors Affecting Performance [Text Block] |
|
|
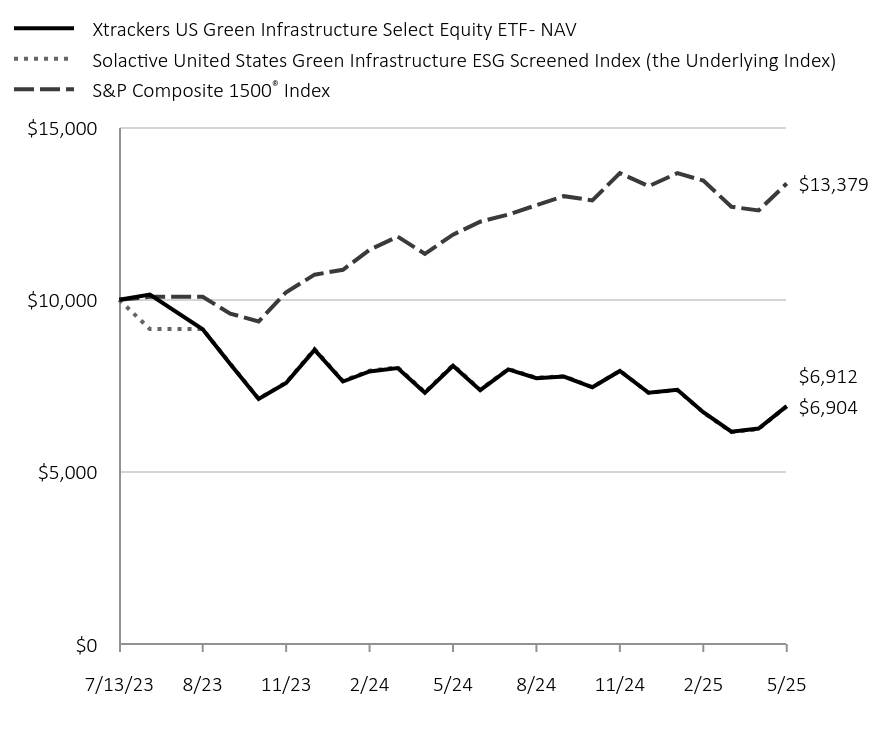
How did the fund perform last year and what affected its performance?The Fund seeks investment results that correspond generally to the performance, before fees and expenses, of the Solactive United States Green Infrastructure ESG Screened Index (the Underlying Index). The Underlying Index is comprised of companies that have business exposure in the production, generation, or distribution of green energy or are engaged in the establishment of a sustainable infrastructure to enable the use of renewable energy and that fulfill certain sustainability criteria. The Fund returned -14.51% for the period ended May 31, 2025. The Fund's underlying index returned -14.82% and the Fund's broad-based index the S&P Composite 1500® Index returned 12.49% during the same period. Consumer Discretionary and Materials were the only sectors that contributed positively to performance. The Industrials, Utilities and Energy sectors detracted from the performance. |
| Line Graph [Table Text Block] |
|
|
|
Xtrackers US Green Infrastructure Select Equity ETF - NAV |
Solactive United States Green Infrastructure ESG Screened Index (the Underlying Index) |
S&P Composite 1500® Index |
7/13/23 |
$10,000 |
$10,000 |
$10,000 |
7/31/23 |
$10,154 |
$9,148 |
$10,085 |
8/31/23 |
$9,142 |
$9,148 |
$10,085 |
9/30/23 |
$8,138 |
$8,145 |
$9,599 |
10/31/23 |
$7,117 |
$7,125 |
$9,370 |
11/30/23 |
$7,581 |
$7,595 |
$10,221 |
12/31/23 |
$8,546 |
$8,566 |
$10,730 |
1/31/24 |
$7,626 |
$7,643 |
$10,873 |
2/29/24 |
$7,917 |
$7,939 |
$11,452 |
3/31/24 |
$8,017 |
$8,039 |
$11,836 |
4/30/24 |
$7,297 |
$7,313 |
$11,335 |
5/31/24 |
$8,085 |
$8,104 |
$11,893 |
6/30/24 |
$7,374 |
$7,389 |
$12,269 |
7/31/24 |
$7,978 |
$7,990 |
$12,477 |
8/31/24 |
$7,721 |
$7,736 |
$12,749 |
9/30/24 |
$7,770 |
$7,781 |
$13,011 |
10/31/24 |
$7,457 |
$7,463 |
$12,888 |
11/30/24 |
$7,934 |
$7,939 |
$13,682 |
12/31/24 |
$7,299 |
$7,297 |
$13,300 |
1/31/25 |
$7,386 |
$7,378 |
$13,678 |
2/28/25 |
$6,736 |
$6,727 |
$13,462 |
3/31/25 |
$6,169 |
$6,157 |
$12,703 |
4/30/25 |
$6,258 |
$6,246 |
$12,595 |
5/31/25 |
$6,912 |
$6,904 |
$13,379 |
|
| Average Annual Return [Table Text Block] |
|
|
Fund/Index |
1-Year |
Since Inception 7/13/23 |
Xtrackers US Green Infrastructure Select Equity ETF - NAV |
-14.51% |
-17.77% |
Solactive United States Green Infrastructure ESG Screened Index |
-14.82% |
-17.82% |
S&P Composite 1500® Index |
12.49% |
16.67% | Average Annual Total Returns Performance shown is historical. The Fund's past performance is not a good predictor or guarantee of the Fund's future performance. Investment returns and principal value of an investment will fluctuate so that an investor's shares, when redeemed, may be worth more or less than their original cost. Current performance may be lower or higher than the performance data quoted. The performance graph and returns table do not reflect the deduction of taxes that a shareholder would pay on Fund distributions or the sale of Fund shares. Shares are bought and sold at market price (closing price) not net asset value (NAV) and are not individually redeemed from the Fund. To obtain the most recent month-end performance data visit etf.dws.com/en-us/etf-products or call (844) 851-4255. |
| AssetsNet |
|
|
$ 3,829,011
|
| Holdings Count | Holding |
|
|
46
|
| Advisory Fees Paid, Amount |
|
|
$ 14,201
|
| InvestmentCompanyPortfolioTurnover |
|
|
60.00%
|
| Additional Fund Statistics [Text Block] |
|
|
Net Assets ($) |
3,829,011 |
Number of Portfolio Holdings |
46 |
Portfolio Turnover Rate (%) |
60 |
Total Net Advisory Fees Paid ($) |
14,201 | |
| Holdings [Text Block] |
|
|
Sector |
% of Net Assets |
Industrials |
63% |
Materials |
14% |
Consumer Discretionary |
12% |
Information Technology |
5% |
Utilities |
4% |
Energy |
2% | |
| Largest Holdings [Text Block] |
|
|
Ten Largest Equity Holdings
Holdings |
30.0% of Net Assets |
Microvast Holdings, Inc. |
4.2% |
EVgo, Inc. |
3.2% |
PureCycle Technologies, Inc. |
3.1% |
Array Technologies, Inc. |
3.0% |
NEXTracker, Inc. |
3.0% |
GE Vernova, Inc. |
3.0% |
Shoals Technologies Group, Inc. |
2.7% |
Tesla, Inc. |
2.7% |
Rivian Automotive, Inc. |
2.6% |
First Solar, Inc. |
2.5% | |
| Updated Prospectus Phone Number |
|
|
(844) 851-4255
|
| Updated Prospectus Web Address |
|
|
dws.com/en-us/resources/proxy-voting
|
| C000245888 |
|
|
|
| Shareholder Report [Line Items] |
|
|
|
| Fund Name |
|
|
Xtrackers US National Critical Technologies ETF
|
| Class Name |
|
|
Xtrackers US National Critical Technologies ETF
|
| Trading Symbol |
|
|
CRTC
|
| Security Exchange Name |
|
|
NYSEArca
|
| Annual or Semi-Annual Statement [Text Block] |
|
|
This annual shareholder report contains important information about the Xtrackers US National Critical Technologies ETF (the "Fund") for the period June 1, 2024 to May 31, 2025.
|
| Shareholder Report Annual or Semi-Annual |
|
|
Annual Shareholder Report
|
| Additional Information [Text Block] |
|
|
This annual shareholder report contains important information about the Xtrackers US National Critical Technologies ETF (the "Fund") for the period June 1, 2024 to May 31, 2025. You can find additional information about the Fund at dws.com/etfreports. You can also request this information by contacting us at (844) 851‐4255.
|
| Additional Information Phone Number |
|
|
(844) 851‐4255
|
| Additional Information Website |
|
|
dws.com/etfreports
|
| Expenses [Text Block] |
|
|
What were the Fund costs for the last year?(Based on a hypothetical $10,000 investment)
Fund |
Costs of a $10,000 investment |
Costs paid as a percentage of a $10,000 investment |
CRTC |
$37 |
0.35% | Gross expense ratio as of the latest prospectus: 0.35%. See prospectus for any contractual or voluntary waivers; without a waiver, costs would have been higher. |
| Expenses Paid, Amount |
|
|
$ 37
|
| Expense Ratio, Percent |
|
|
0.35%
|
| Factors Affecting Performance [Text Block] |
|
|
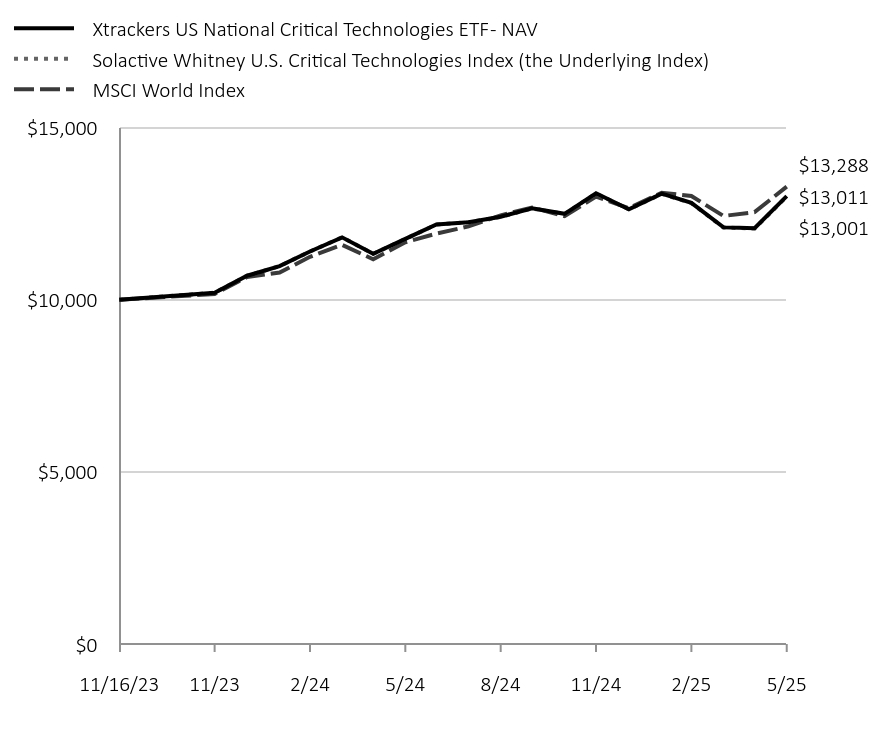
How did the fund perform last year and what affected its performance?The Fund seeks investment results that correspond generally to the performance, before fees and expenses, of the Solactive Whitney U.S. Critical Technologies Index (the Underlying Index). The Underlying Index is a market-capitalization weighted index, subject to caps on the weighting of individual companies, that is designed to track companies that support critical emerging technologies across the U.S. and its allies by selecting companies from a defined investment universe that satisfy key criteria related to their association with critical technology sectors and their geopolitical risk rating. The Fund returned 10.54% for the period ended May 31, 2025. The Fund's underlying index returned 10.48% and the Fund's broad-based index the MSCI World Index returned 13.72% during the same period. The majority of sectors contributed positively to performance during the period with the greatest contribution coming from Information Technology, Industrials and Consumer Discretionary. The Energy, Materials and Real Estate sectors detracted from the performance. From a geographical perspective, the United States, the United Kingdom and Canada were the major positive contributors, while Denmark, Australia and France contributed negatively to performance. |
| Line Graph [Table Text Block] |
|
|
|
Xtrackers US National Critical Technologies ETF - NAV |
Solactive Whitney U.S. Critical Technologies Index (the Underlying Index) |
MSCI World Index |
11/16/23 |
$10,000 |
$10,000 |
$10,000 |
11/30/23 |
$10,207 |
$10,205 |
$10,170 |
12/31/23 |
$10,699 |
$10,699 |
$10,661 |
1/31/24 |
$10,979 |
$10,978 |
$10,794 |
2/29/24 |
$11,402 |
$11,402 |
$11,249 |
3/31/24 |
$11,814 |
$11,816 |
$11,597 |
4/30/24 |
$11,334 |
$11,335 |
$11,177 |
5/31/24 |
$11,770 |
$11,768 |
$11,672 |
6/30/24 |
$12,188 |
$12,187 |
$11,923 |
7/31/24 |
$12,254 |
$12,252 |
$12,133 |
8/31/24 |
$12,412 |
$12,408 |
$12,454 |
9/30/24 |
$12,657 |
$12,653 |
$12,682 |
10/31/24 |
$12,498 |
$12,494 |
$12,431 |
11/30/24 |
$13,096 |
$13,090 |
$13,001 |
12/31/24 |
$12,632 |
$12,626 |
$12,662 |
1/31/25 |
$13,082 |
$13,076 |
$13,109 |
2/28/25 |
$12,815 |
$12,808 |
$13,015 |
3/31/25 |
$12,106 |
$12,100 |
$12,435 |
4/30/25 |
$12,078 |
$12,071 |
$12,546 |
5/31/25 |
$13,011 |
$13,001 |
$13,288 |
|
| Average Annual Return [Table Text Block] |
|
|
Fund/Index |
1-Year |
Since Inception 11/16/23 |
Xtrackers US National Critical Technologies ETF - NAV |
10.54% |
18.60% |
Solactive Whitney U.S. Critical Technologies Index |
10.48% |
18.55% |
MSCI World Index |
13.72% |
20.24% | Average Annual Total Returns Performance shown is historical. The Fund's past performance is not a good predictor or guarantee of the Fund's future performance. Investment returns and principal value of an investment will fluctuate so that an investor's shares, when redeemed, may be worth more or less than their original cost. Current performance may be lower or higher than the performance data quoted. The performance graph and returns table do not reflect the deduction of taxes that a shareholder would pay on Fund distributions or the sale of Fund shares. Shares are bought and sold at market price (closing price) not net asset value (NAV) and are not individually redeemed from the Fund. To obtain the most recent month-end performance data visit etf.dws.com/en-us/etf-products or call (844) 851-4255. |
| AssetsNet |
|
|
$ 112,124,556
|
| Holdings Count | Holding |
|
|
225
|
| Advisory Fees Paid, Amount |
|
|
$ 242,221
|
| InvestmentCompanyPortfolioTurnover |
|
|
29.00%
|
| Additional Fund Statistics [Text Block] |
|
|
Net Assets ($) |
112,124,556 |
Number of Portfolio Holdings |
225 |
Portfolio Turnover Rate (%) |
29 |
Total Net Advisory Fees Paid ($) |
242,221 | |
| Holdings [Text Block] |
|
|
Sector |
% of Net Assets |
Information Technology |
35% |
Health Care |
17% |
Communication Services |
16% |
Industrials |
13% |
Consumer Discretionary |
6% |
Utilities |
5% |
Energy |
5% |
Materials |
2% |
Financials |
1% |
Real Estate |
0% | |
| Largest Holdings [Text Block] |
|
|
Ten Largest Equity Holdings
Holdings |
35.8% of Net Assets |
NVIDIA Corp. |
5.9% |
Meta Platforms, Inc. |
5.7% |
Microsoft Corp. |
5.5% |
Amazon.com, Inc. |
5.2% |
Alphabet, Inc. |
4.9% |
Exxon Mobil Corp. |
2.4% |
AbbVie, Inc. |
1.8% |
Palantir Technologies, Inc. |
1.5% |
Oracle Corp. |
1.5% |
Cisco Systems, Inc. |
1.4% | |
| Updated Prospectus Phone Number |
|
|
(844) 851-4255
|
| Updated Prospectus Web Address |
|
|
dws.com/en-us/resources/proxy-voting
|
| C000125568 |
|
|
|
| Shareholder Report [Line Items] |
|
|
|
| Fund Name |
|
|
Xtrackers Harvest CSI 300 China A‑Shares ETF
|
| Class Name |
|
|
Xtrackers Harvest CSI 300 China A‑Shares ETF
|
| Trading Symbol |
|
|
ASHR
|
| Security Exchange Name |
|
|
NYSEArca
|
| Annual or Semi-Annual Statement [Text Block] |
|
|
This annual shareholder report contains important information about the Xtrackers Harvest CSI 300 China A-Shares ETF (the "Fund") for the period June 1, 2024 to May 31, 2025.
|
| Shareholder Report Annual or Semi-Annual |
|
|
Annual Shareholder Report
|
| Additional Information [Text Block] |
|
|
This annual shareholder report contains important information about the Xtrackers Harvest CSI 300 China A-Shares ETF (the "Fund") for the period June 1, 2024 to May 31, 2025. You can find additional information about the Fund at dws.com/etfreports. You can also request this information by contacting us at (844) 851‐4255.
|
| Additional Information Phone Number |
|
|
(844) 851‐4255
|
| Additional Information Website |
|
|
dws.com/etfreports
|
| Expenses [Text Block] |
|
|
What were the Fund costs for the last year?(Based on a hypothetical $10,000 investment)
Fund |
Costs of a $10,000 investment |
Costs paid as a percentage of a $10,000 investment |
ASHR |
$68 |
0.65% | Gross expense ratio as of the latest prospectus: 0.65%. See prospectus for any contractual or voluntary waivers; without a waiver, costs would have been higher. |
| Expenses Paid, Amount |
|
|
$ 68
|
| Expense Ratio, Percent |
|
|
0.65%
|
| Factors Affecting Performance [Text Block] |
|
|
How did the fund perform last year and what affected its performance?The Fund seeks investment results that correspond generally to the performance, before fees and expenses, of the CSI 300 Index (the Underlying Index). The Underlying Index is designed to reflect the price fluctuation and performance of the China A-Share market and is composed of the 300 largest and most liquid stocks in the China A-Share market. The Fund returned 9.72% for the period ended May 31, 2025. The Fund's underlying index returned 11.30% and the Fund's broad-based index the MSCI ACWI ex USA Index returned 13.75% during the same period. The majority of sectors contributed positively to performance during the period with the greatest contribution coming from Financials, Consumer Discretionary and Industrials. The Consumer Staples, Materials and Energy sectors detracted from performance. |
| Line Graph [Table Text Block] |
|
|

|
Xtrackers Harvest CSI 300 China A-Shares ETF - NAV |
CSI 300 Index (the Underlying Index) |
MSCI ACWI ex USA Index |
'15 |
$10,000 |
$10,000 |
$10,000 |
'15 |
$9,275 |
$9,268 |
$9,721 |
'15 |
$7,911 |
$7,952 |
$9,694 |
'15 |
$6,635 |
$6,831 |
$8,953 |
'15 |
$6,407 |
$6,526 |
$8,538 |
'15 |
$7,170 |
$7,236 |
$9,174 |
'15 |
$7,136 |
$7,222 |
$8,984 |
'15 |
$7,324 |
$7,443 |
$8,815 |
'16 |
$5,699 |
$5,804 |
$8,215 |
'16 |
$5,606 |
$5,695 |
$8,121 |
'16 |
$6,403 |
$6,450 |
$8,782 |
'16 |
$6,250 |
$6,317 |
$9,013 |
'16 |
$6,190 |
$6,253 |
$8,861 |
'16 |
$6,135 |
$6,203 |
$8,725 |
'16 |
$6,349 |
$6,351 |
$9,157 |
'16 |
$6,542 |
$6,580 |
$9,215 |
'16 |
$6,406 |
$6,447 |
$9,328 |
'16 |
$6,461 |
$6,514 |
$9,194 |
'16 |
$6,716 |
$6,792 |
$8,982 |
'16 |
$6,221 |
$6,269 |
$9,211 |
'17 |
$6,504 |
$6,509 |
$9,538 |
'17 |
$6,601 |
$6,647 |
$9,690 |
'17 |
$6,588 |
$6,632 |
$9,935 |
'17 |
$6,536 |
$6,597 |
$10,148 |
'17 |
$6,786 |
$6,785 |
$10,477 |
'17 |
$7,142 |
$7,213 |
$10,510 |
'17 |
$7,384 |
$7,462 |
$10,897 |
'17 |
$7,709 |
$7,792 |
$10,954 |
'17 |
$7,674 |
$7,744 |
$11,158 |
'17 |
$8,027 |
$8,138 |
$11,368 |
'17 |
$8,038 |
$8,162 |
$11,460 |
'17 |
$8,199 |
$8,335 |
$11,716 |
'18 |
$8,981 |
$9,140 |
$12,369 |
'18 |
$8,400 |
$8,561 |
$11,785 |
'18 |
$8,193 |
$8,338 |
$11,560 |
'18 |
$7,839 |
$7,977 |
$11,762 |
'18 |
$7,829 |
$8,013 |
$11,490 |
'18 |
$7,032 |
$7,204 |
$11,275 |
'18 |
$6,918 |
$7,051 |
$11,544 |
'18 |
$6,539 |
$6,693 |
$11,303 |
'18 |
$6,719 |
$6,854 |
$11,354 |
'18 |
$6,072 |
$6,213 |
$10,431 |
'18 |
$6,137 |
$6,273 |
$10,529 |
'18 |
$5,899 |
$6,032 |
$10,052 |
'19 |
$6,413 |
$6,559 |
$10,812 |
'19 |
$7,352 |
$7,537 |
$11,024 |
'19 |
$7,728 |
$7,910 |
$11,089 |
'19 |
$7,793 |
$7,976 |
$11,382 |
'19 |
$7,043 |
$7,247 |
$10,771 |
'19 |
$7,526 |
$7,731 |
$11,420 |
'19 |
$7,549 |
$7,779 |
$11,282 |
'19 |
$7,227 |
$7,434 |
$10,933 |
'19 |
$7,278 |
$7,499 |
$11,215 |
'19 |
$7,509 |
$7,733 |
$11,606 |
'19 |
$7,411 |
$7,627 |
$11,708 |
'19 |
$7,997 |
$8,234 |
$12,215 |
'20 |
$7,024 |
$8,094 |
$11,887 |
'20 |
$7,664 |
$7,881 |
$10,947 |
'20 |
$7,049 |
$7,283 |
$9,362 |
'20 |
$7,495 |
$7,779 |
$10,072 |
'20 |
$7,362 |
$7,600 |
$10,401 |
'20 |
$8,037 |
$8,332 |
$10,872 |
'20 |
$9,217 |
$9,565 |
$11,356 |
'20 |
$9,656 |
$10,016 |
$11,842 |
'20 |
$9,289 |
$9,606 |
$11,551 |
'20 |
$9,628 |
$10,010 |
$11,303 |
'20 |
$10,344 |
$10,739 |
$12,823 |
'20 |
$10,991 |
$11,384 |
$13,516 |
'21 |
$11,356 |
$11,825 |
$13,546 |
'21 |
$11,263 |
$11,782 |
$13,814 |
'21 |
$10,519 |
$10,988 |
$13,989 |
'21 |
$10,827 |
$11,317 |
$14,400 |
'21 |
$11,444 |
$11,941 |
$14,835 |
'21 |
$11,100 |
$11,635 |
$14,755 |
'21 |
$10,282 |
$10,765 |
$14,511 |
'21 |
$10,310 |
$10,776 |
$14,787 |
'21 |
$10,444 |
$10,910 |
$14,314 |
'21 |
$10,613 |
$11,142 |
$14,655 |
'21 |
$10,511 |
$10,999 |
$13,996 |
'21 |
$10,752 |
$11,243 |
$14,574 |
'22 |
$9,911 |
$10,407 |
$14,037 |
'22 |
$10,022 |
$10,530 |
$13,759 |
'22 |
$9,178 |
$9,657 |
$13,781 |
'22 |
$8,346 |
$8,835 |
$12,916 |
'22 |
$8,492 |
$8,934 |
$13,008 |
'22 |
$9,341 |
$9,804 |
$11,889 |
'22 |
$8,666 |
$9,118 |
$12,296 |
'22 |
$8,300 |
$8,732 |
$11,901 |
'22 |
$7,478 |
$7,923 |
$10,712 |
'22 |
$6,702 |
$7,121 |
$11,032 |
'22 |
$7,669 |
$7,964 |
$12,334 |
'22 |
$7,851 |
$8,242 |
$12,242 |
'23 |
$8,633 |
$9,111 |
$13,235 |
'23 |
$8,202 |
$8,684 |
$12,770 |
'23 |
$8,239 |
$8,739 |
$13,082 |
'23 |
$8,102 |
$8,628 |
$13,309 |
'23 |
$7,449 |
$7,936 |
$12,826 |
'23 |
$7,451 |
$7,928 |
$13,401 |
'23 |
$7,974 |
$8,469 |
$13,946 |
'23 |
$7,345 |
$7,802 |
$13,316 |
'23 |
$7,179 |
$7,634 |
$12,895 |
'23 |
$6,901 |
$7,382 |
$12,363 |
'23 |
$6,942 |
$7,421 |
$13,476 |
'23 |
$6,825 |
$7,326 |
$14,153 |
'24 |
$6,325 |
$6,778 |
$14,013 |
'24 |
$6,903 |
$7,400 |
$14,367 |
'24 |
$6,861 |
$7,376 |
$14,795 |
'24 |
$7,039 |
$7,541 |
$14,551 |
'24 |
$6,989 |
$7,506 |
$14,973 |
'24 |
$6,760 |
$7,288 |
$14,959 |
'24 |
$6,858 |
$7,363 |
$15,305 |
'24 |
$6,753 |
$7,258 |
$15,741 |
'24 |
$8,269 |
$8,886 |
$16,165 |
'24 |
$7,842 |
$8,488 |
$15,372 |
'24 |
$7,739 |
$8,418 |
$15,233 |
'24 |
$7,682 |
$8,389 |
$14,937 |
'25 |
$7,489 |
$8,191 |
$15,538 |
'25 |
$7,664 |
$8,324 |
$15,754 |
'25 |
$7,692 |
$8,362 |
$15,718 |
'25 |
$7,458 |
$8,102 |
$16,286 |
'25 |
$7,668 |
$8,354 |
$17,032 |
|
| Average Annual Return [Table Text Block] |
|
|
Fund/Index |
1-Year |
5-Year |
10-Year |
Xtrackers Harvest CSI 300 China A-Shares ETF - NAV |
9.72% |
0.82% |
-2.62% |
CSI 300 Index |
11.30% |
1.91% |
-1.78% |
MSCI ACWI ex USA Index |
13.75% |
10.37% |
5.47% | Average Annual Total Returns Performance shown is historical. The Fund's past performance is not a good predictor or guarantee of the Fund's future performance. Investment returns and principal value of an investment will fluctuate so that an investor's shares, when redeemed, may be worth more or less than their original cost. Current performance may be lower or higher than the performance data quoted. The performance graph and returns table do not reflect the deduction of taxes that a shareholder would pay on Fund distributions or the sale of Fund shares. Shares are bought and sold at market price (closing price) not net asset value (NAV) and are not individually redeemed from the Fund. To obtain the most recent month-end performance data visit etf.dws.com/en-us/etf-products or call (844) 851-4255. |
| AssetsNet |
|
|
$ 2,014,675,761
|
| Holdings Count | Holding |
|
|
285
|
| Advisory Fees Paid, Amount |
|
|
$ 14,257,775
|
| InvestmentCompanyPortfolioTurnover |
|
|
143.00%
|
| Additional Fund Statistics [Text Block] |
|
|
Net Assets ($) |
2,014,675,761 |
Number of Portfolio Holdings |
285 |
Portfolio Turnover Rate (%) |
143 |
Total Net Advisory Fees Paid ($) |
14,257,775 | |
| Holdings [Text Block] |
|
|
Sector |
% of Net Assets |
Financials |
26% |
Industrials |
16% |
Information Technology |
16% |
Consumer Staples |
11% |
Consumer Discretionary |
9% |
Materials |
8% |
Health Care |
6% |
Utilities |
4% |
Energy |
2% |
Real Estate |
1% |
Communication Services |
1% | |
| Largest Holdings [Text Block] |
|
|
Ten Largest Equity Holdings
Holdings |
23.4% of Net Assets |
Kweichow Moutai Co. Ltd. |
4.7% |
Contemporary Amperex Technology Co. Ltd. |
3.3% |
Ping An Insurance Group Co. of China Ltd. |
2.9% |
China Merchants Bank Co. Ltd. |
2.7% |
Midea Group Co. Ltd. |
1.9% |
China Yangtze Power Co. Ltd. |
1.9% |
Industrial Bank Co. Ltd. |
1.6% |
BYD Co. Ltd. |
1.6% |
Zijin Mining Group Co. Ltd. |
1.5% |
East Money Information Co. Ltd. |
1.3% | |
| Updated Prospectus Phone Number |
|
|
(844) 851-4255
|
| Updated Prospectus Web Address |
|
|
dws.com/en-us/resources/proxy-voting
|
| C000138395 |
|
|
|
| Shareholder Report [Line Items] |
|
|
|
| Fund Name |
|
|
Xtrackers Harvest CSI 500 China A‑Shares Small Cap ETF
|
| Class Name |
|
|
Xtrackers Harvest CSI 500 China A‑Shares Small Cap ETF
|
| Trading Symbol |
|
|
ASHS
|
| Security Exchange Name |
|
|
NYSEArca
|
| Annual or Semi-Annual Statement [Text Block] |
|
|
This annual shareholder report contains important information about the Xtrackers Harvest CSI 500 China A-Shares Small Cap ETF (the "Fund") for the period June 1, 2024 to May 31, 2025.
|
| Shareholder Report Annual or Semi-Annual |
|
|
Annual Shareholder Report
|
| Additional Information [Text Block] |
|
|
This annual shareholder report contains important information about the Xtrackers Harvest CSI 500 China A-Shares Small Cap ETF (the "Fund") for the period June 1, 2024 to May 31, 2025. You can find additional information about the Fund at dws.com/etfreports. You can also request this information by contacting us at (844) 851‐4255.
|
| Additional Information Phone Number |
|
|
(844) 851‐4255
|
| Additional Information Website |
|
|
dws.com/etfreports
|
| Expenses [Text Block] |
|
|
What were the Fund costs for the last year?(Based on a hypothetical $10,000 investment)
Fund |
Costs of a $10,000 investment |
Costs paid as a percentage of a $10,000 investment |
ASHS |
$68 |
0.65% | Gross expense ratio as of the latest prospectus: 0.65%. See prospectus for any contractual or voluntary waivers; without a waiver, costs would have been higher. |
| Expenses Paid, Amount |
|
|
$ 68
|
| Expense Ratio, Percent |
|
|
0.65%
|
| Factors Affecting Performance [Text Block] |
|
|
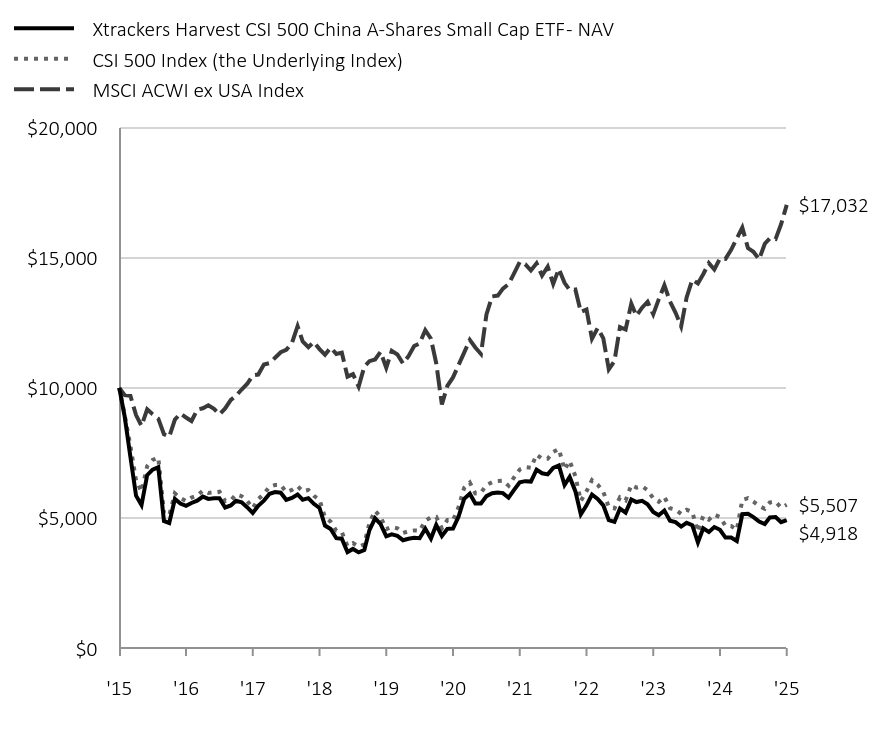
How did the fund perform last year and what affected its performance?The Fund seeks investment results that correspond generally to the performance, before fees and expenses, of the CSI 500 Index (the Underlying Index). The Underlying Index is designed to reflect the price fluctuation and performance of small-cap companies in the China A-Share market and is composed of the 500 smallest and most liquid stocks in the China A-Share market. The Fund returned 8.21% for the period ended May 31, 2025. The Fund's underlying index returned 9.48% and the Fund's broad-based index the MSCI ACWI ex USA Index returned 13.75% during the same period. The majority of sectors contributed positively to performance during the period with the greatest contribution coming from Information Technology, Consumer Discretionary and Communication Services. The Energy, Materials and Utilities sectors detracted from performance. |
| Line Graph [Table Text Block] |
|
|
|
Xtrackers Harvest CSI 500 China A-Shares Small Cap ETF - NAV |
CSI 500 Index (the Underlying Index) |
MSCI ACWI ex USA Index |
'15 |
$10,000 |
$10,000 |
$10,000 |
'15 |
$8,884 |
$8,944 |
$9,721 |
'15 |
$7,351 |
$7,762 |
$9,694 |
'15 |
$5,856 |
$6,436 |
$8,953 |
'15 |
$5,495 |
$6,011 |
$8,538 |
'15 |
$6,643 |
$6,987 |
$9,174 |
'15 |
$6,854 |
$7,227 |
$8,984 |
'15 |
$6,951 |
$7,321 |
$8,815 |
'16 |
$4,882 |
$5,190 |
$8,215 |
'16 |
$4,805 |
$5,100 |
$8,121 |
'16 |
$5,729 |
$5,942 |
$8,782 |
'16 |
$5,554 |
$5,767 |
$9,013 |
'16 |
$5,463 |
$5,648 |
$8,861 |
'16 |
$5,574 |
$5,782 |
$8,725 |
'16 |
$5,665 |
$5,856 |
$9,157 |
'16 |
$5,822 |
$6,050 |
$9,215 |
'16 |
$5,732 |
$5,959 |
$9,328 |
'16 |
$5,752 |
$5,986 |
$9,194 |
'16 |
$5,757 |
$6,008 |
$8,982 |
'16 |
$5,401 |
$5,648 |
$9,211 |
'17 |
$5,479 |
$5,682 |
$9,538 |
'17 |
$5,661 |
$5,901 |
$9,690 |
'17 |
$5,603 |
$5,836 |
$9,935 |
'17 |
$5,414 |
$5,661 |
$10,148 |
'17 |
$5,191 |
$5,374 |
$10,477 |
'17 |
$5,468 |
$5,722 |
$10,510 |
'17 |
$5,665 |
$5,924 |
$10,897 |
'17 |
$5,930 |
$6,205 |
$10,954 |
'17 |
$5,994 |
$6,266 |
$11,158 |
'17 |
$5,968 |
$6,263 |
$11,368 |
'17 |
$5,696 |
$5,998 |
$11,460 |
'17 |
$5,770 |
$6,077 |
$11,716 |
'18 |
$5,903 |
$6,219 |
$12,369 |
'18 |
$5,700 |
$6,024 |
$11,785 |
'18 |
$5,759 |
$6,074 |
$11,560 |
'18 |
$5,543 |
$5,851 |
$11,762 |
'18 |
$5,384 |
$5,703 |
$11,490 |
'18 |
$4,706 |
$5,019 |
$11,275 |
'18 |
$4,572 |
$4,854 |
$11,544 |
'18 |
$4,221 |
$4,505 |
$11,303 |
'18 |
$4,200 |
$4,457 |
$11,354 |
'18 |
$3,687 |
$3,920 |
$10,431 |
'18 |
$3,808 |
$4,030 |
$10,529 |
'18 |
$3,676 |
$3,889 |
$10,052 |
'19 |
$3,768 |
$3,985 |
$10,812 |
'19 |
$4,532 |
$4,806 |
$11,024 |
'19 |
$4,984 |
$5,276 |
$11,089 |
'19 |
$4,760 |
$5,038 |
$11,382 |
'19 |
$4,292 |
$4,566 |
$10,771 |
'19 |
$4,366 |
$4,653 |
$11,420 |
'19 |
$4,310 |
$4,604 |
$11,282 |
'19 |
$4,144 |
$4,420 |
$10,933 |
'19 |
$4,200 |
$4,487 |
$11,215 |
'19 |
$4,233 |
$4,520 |
$11,606 |
'19 |
$4,222 |
$4,505 |
$11,708 |
'19 |
$4,589 |
$4,891 |
$12,215 |
'20 |
$4,209 |
$5,022 |
$11,887 |
'20 |
$4,731 |
$5,038 |
$10,947 |
'20 |
$4,303 |
$4,602 |
$9,362 |
'20 |
$4,579 |
$4,918 |
$10,072 |
'20 |
$4,593 |
$4,907 |
$10,401 |
'20 |
$5,044 |
$5,406 |
$10,872 |
'20 |
$5,734 |
$6,153 |
$11,356 |
'20 |
$5,929 |
$6,359 |
$11,842 |
'20 |
$5,558 |
$5,943 |
$11,551 |
'20 |
$5,554 |
$5,971 |
$11,303 |
'20 |
$5,839 |
$6,269 |
$12,823 |
'20 |
$5,947 |
$6,371 |
$13,516 |
'21 |
$5,976 |
$6,423 |
$13,546 |
'21 |
$5,955 |
$6,436 |
$13,814 |
'21 |
$5,778 |
$6,236 |
$13,989 |
'21 |
$6,076 |
$6,560 |
$14,400 |
'21 |
$6,369 |
$6,861 |
$14,835 |
'21 |
$6,413 |
$6,952 |
$14,755 |
'21 |
$6,396 |
$6,929 |
$14,511 |
'21 |
$6,854 |
$7,432 |
$14,787 |
'21 |
$6,717 |
$7,275 |
$14,314 |
'21 |
$6,673 |
$7,276 |
$14,655 |
'21 |
$6,919 |
$7,539 |
$13,996 |
'21 |
$7,015 |
$7,649 |
$14,574 |
'22 |
$6,267 |
$6,853 |
$14,037 |
'22 |
$6,576 |
$7,193 |
$13,759 |
'22 |
$6,029 |
$6,606 |
$13,781 |
'22 |
$5,134 |
$5,654 |
$12,916 |
'22 |
$5,485 |
$6,020 |
$13,008 |
'22 |
$5,901 |
$6,453 |
$11,889 |
'22 |
$5,727 |
$6,277 |
$12,296 |
'22 |
$5,481 |
$6,003 |
$11,901 |
'22 |
$4,916 |
$5,418 |
$10,712 |
'22 |
$4,847 |
$5,364 |
$11,032 |
'22 |
$5,360 |
$5,791 |
$12,334 |
'22 |
$5,203 |
$5,675 |
$12,242 |
'23 |
$5,712 |
$6,265 |
$13,235 |
'23 |
$5,610 |
$6,165 |
$12,770 |
'23 |
$5,654 |
$6,216 |
$13,082 |
'23 |
$5,526 |
$6,073 |
$13,309 |
'23 |
$5,226 |
$5,756 |
$12,826 |
'23 |
$5,100 |
$5,624 |
$13,401 |
'23 |
$5,285 |
$5,809 |
$13,946 |
'23 |
$4,892 |
$5,373 |
$13,316 |
'23 |
$4,837 |
$5,318 |
$12,895 |
'23 |
$4,669 |
$5,157 |
$12,363 |
'23 |
$4,813 |
$5,313 |
$13,476 |
'23 |
$4,723 |
$5,228 |
$14,153 |
'24 |
$4,054 |
$4,466 |
$14,013 |
'24 |
$4,601 |
$5,075 |
$14,367 |
'24 |
$4,459 |
$4,935 |
$14,795 |
'24 |
$4,650 |
$5,131 |
$14,551 |
'24 |
$4,545 |
$5,030 |
$14,973 |
'24 |
$4,244 |
$4,700 |
$14,959 |
'24 |
$4,247 |
$4,690 |
$15,305 |
'24 |
$4,113 |
$4,541 |
$15,741 |
'24 |
$5,142 |
$5,688 |
$16,165 |
'24 |
$5,156 |
$5,761 |
$15,372 |
'24 |
$5,030 |
$5,626 |
$15,233 |
'24 |
$4,862 |
$5,457 |
$14,937 |
'25 |
$4,763 |
$5,353 |
$15,538 |
'25 |
$5,020 |
$5,597 |
$15,754 |
'25 |
$5,037 |
$5,625 |
$15,718 |
'25 |
$4,837 |
$5,396 |
$16,286 |
'25 |
$4,918 |
$5,507 |
$17,032 |
|
| Average Annual Return [Table Text Block] |
|
|
Fund/Index |
1-Year |
5-Year |
10-Year |
Xtrackers Harvest CSI 500 China A-Shares Small Cap ETF - NAV |
8.21% |
1.38% |
-6.85% |
CSI 500 Index |
9.48% |
2.34% |
-5.79% |
MSCI ACWI ex USA Index |
13.75% |
10.37% |
5.47% | Average Annual Total Returns Performance shown is historical. The Fund's past performance is not a good predictor or guarantee of the Fund's future performance. Investment returns and principal value of an investment will fluctuate so that an investor's shares, when redeemed, may be worth more or less than their original cost. Current performance may be lower or higher than the performance data quoted. The performance graph and returns table do not reflect the deduction of taxes that a shareholder would pay on Fund distributions or the sale of Fund shares. Shares are bought and sold at market price (closing price) not net asset value (NAV) and are not individually redeemed from the Fund. To obtain the most recent month-end performance data visit etf.dws.com/en-us/etf-products or call (844) 851-4255. |
| AssetsNet |
|
|
$ 26,870,539
|
| Holdings Count | Holding |
|
|
489
|
| Advisory Fees Paid, Amount |
|
|
$ 181,855
|
| InvestmentCompanyPortfolioTurnover |
|
|
79.00%
|
| Additional Fund Statistics [Text Block] |
|
|
Net Assets ($) |
26,870,539 |
Number of Portfolio Holdings |
489 |
Portfolio Turnover Rate (%) |
79 |
Total Net Advisory Fees Paid ($) |
181,855 | |
| Holdings [Text Block] |
|
|
Sector |
% of Net Assets |
Information Technology |
24% |
Materials |
16% |
Industrials |
16% |
Health Care |
11% |
Financials |
10% |
Consumer Discretionary |
9% |
Consumer Staples |
4% |
Utilities |
3% |
Communication Services |
3% |
Real Estate |
2% |
Energy |
2% | |
| Largest Holdings [Text Block] |
|
|
Ten Largest Equity Holdings
Holdings |
6.9% of Net Assets |
Kuang-Chi Technologies Co. Ltd. |
1.0% |
Anhui Jianghuai Automobile Group Corp. Ltd. |
1.0% |
Victory Giant Technology Huizhou Co. Ltd. |
0.8% |
Chifeng Jilong Gold Mining Co. Ltd. |
0.7% |
Huagong Tech Co. Ltd. |
0.6% |
Jiangsu Hoperun Software Co. Ltd. |
0.6% |
Bank of Suzhou Co. Ltd. |
0.6% |
Suzhou Dongshan Precision Manufacturing Co. Ltd. |
0.6% |
Sichuan Changhong Electric Co. Ltd. |
0.5% |
Ninebot Ltd. |
0.5% | |
| Updated Prospectus Phone Number |
|
|
(844) 851-4255
|
| Updated Prospectus Web Address |
|
|
dws.com/en-us/resources/proxy-voting
|
| C000135616 |
|
|
|
| Shareholder Report [Line Items] |
|
|
|
| Fund Name |
|
|
Xtrackers MSCI All World ex US Hedged Equity ETF
|
| Class Name |
|
|
Xtrackers MSCI All World ex US Hedged Equity ETF
|
| Trading Symbol |
|
|
DBAW
|
| Security Exchange Name |
|
|
NYSEArca
|
| Annual or Semi-Annual Statement [Text Block] |
|
|
This annual shareholder report contains important information about the Xtrackers MSCI All World ex US Hedged Equity ETF (the "Fund") for the period June 1, 2024 to May 31, 2025.
|
| Shareholder Report Annual or Semi-Annual |
|
|
Annual Shareholder Report
|
| Additional Information [Text Block] |
|
|
This annual shareholder report contains important information about the Xtrackers MSCI All World ex US Hedged Equity ETF (the "Fund") for the period June 1, 2024 to May 31, 2025. You can find additional information about the Fund at dws.com/etfreports. You can also request this information by contacting us at (844) 851‐4255.
|
| Additional Information Phone Number |
|
|
(844) 851‐4255
|
| Additional Information Website |
|
|
dws.com/etfreports
|
| Expenses [Text Block] |
|
|
What were the Fund costs for the last year?(Based on a hypothetical $10,000 investment)
Fund |
Costs of a $10,000 investment |
Costs paid as a percentage of a $10,000 investment |
DBAW |
$42 |
0.40% | Gross expense ratio as of the latest prospectus: 0.40%. See prospectus for any contractual or voluntary waivers; without a waiver, costs would have been higher. |
| Expenses Paid, Amount |
|
|
$ 42
|
| Expense Ratio, Percent |
|
|
0.40%
|
| Factors Affecting Performance [Text Block] |
|
|
How did the fund perform last year and what affected its performance?The Fund seeks investment results that correspond generally to the performance, before fees and expenses, of the MSCI ACWI ex USA US Dollar Hedged Index (the Underlying Index). The Underlying Index is designed to track the performance of equity securities in developed and emerging stock markets (excluding the United States), while mitigating exposure to fluctuations between the value of the U.S. dollar and the currencies of the countries included in the Underlying Index. The Fund returned 10.95% for the period ended May 31, 2025. The Fund's underlying index returned 11.36% and the Fund's broad-based index the MSCI ACWI ex USA Index returned 13.75% during the same period. The majority of sectors contributed positively to performance during the period with the greatest contribution coming from Financials, Industrials and Communication Services. The Energy and Materials sectors detracted from performance. From a geographical perspective, the majority of countries contributed positively to performance during the period with the greatest contribution coming from Hong Kong, Germany and Japan while Denmark, Korea and Turkey contributed negatively to performance. The Fund entered into forward foreign currency contracts during the period to hedge against changes in the value of the U.S dollar against specified non-U.S currencies. The currency hedging strategy contributed negatively to performance. |
| Line Graph [Table Text Block] |
|
|
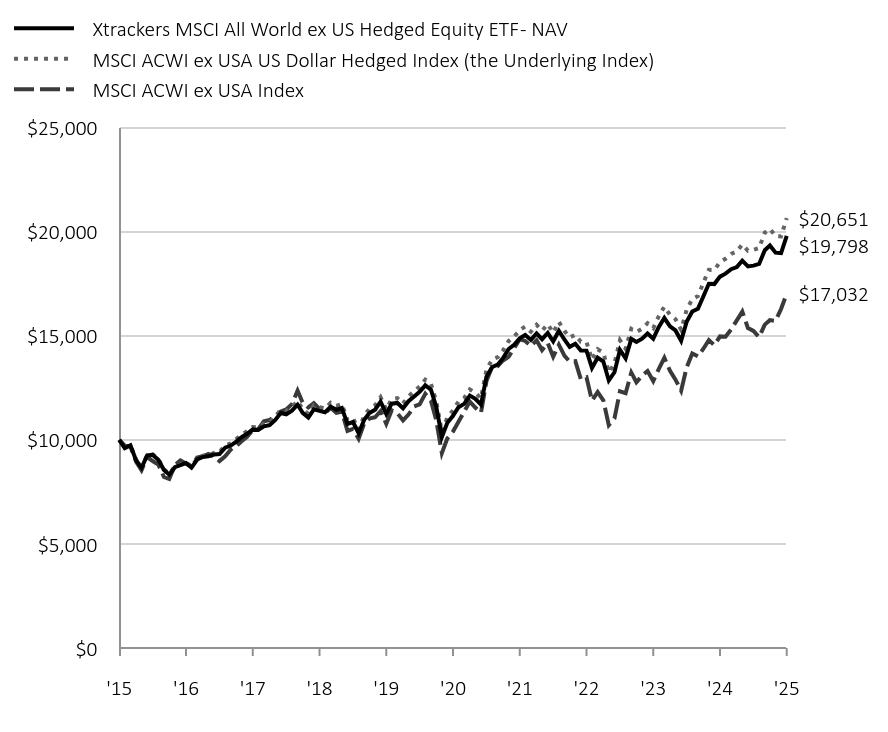
|
Xtrackers MSCI All World ex US Hedged Equity ETF - NAV |
MSCI ACWI ex USA US Dollar Hedged Index (the Underlying Index) |
MSCI ACWI ex USA Index |
'15 |
$10,000 |
$10,000 |
$10,000 |
'15 |
$9,600 |
$9,604 |
$9,721 |
'15 |
$9,741 |
$9,751 |
$9,694 |
'15 |
$9,022 |
$9,046 |
$8,953 |
'15 |
$8,659 |
$8,671 |
$8,538 |
'15 |
$9,256 |
$9,276 |
$9,174 |
'15 |
$9,279 |
$9,307 |
$8,984 |
'15 |
$9,044 |
$9,082 |
$8,815 |
'16 |
$8,553 |
$8,595 |
$8,215 |
'16 |
$8,329 |
$8,368 |
$8,121 |
'16 |
$8,686 |
$8,732 |
$8,782 |
'16 |
$8,784 |
$8,826 |
$9,013 |
'16 |
$8,883 |
$8,933 |
$8,861 |
'16 |
$8,667 |
$8,712 |
$8,725 |
'16 |
$9,057 |
$9,112 |
$9,157 |
'16 |
$9,181 |
$9,235 |
$9,215 |
'16 |
$9,209 |
$9,275 |
$9,328 |
'16 |
$9,297 |
$9,373 |
$9,194 |
'16 |
$9,316 |
$9,418 |
$8,982 |
'16 |
$9,626 |
$9,730 |
$9,211 |
'17 |
$9,726 |
$9,836 |
$9,538 |
'17 |
$9,906 |
$10,022 |
$9,690 |
'17 |
$10,127 |
$10,248 |
$9,935 |
'17 |
$10,293 |
$10,412 |
$10,148 |
'17 |
$10,504 |
$10,622 |
$10,477 |
'17 |
$10,480 |
$10,603 |
$10,510 |
'17 |
$10,653 |
$10,784 |
$10,897 |
'17 |
$10,710 |
$10,846 |
$10,954 |
'17 |
$10,945 |
$11,090 |
$11,157 |
'17 |
$11,292 |
$11,445 |
$11,367 |
'17 |
$11,230 |
$11,390 |
$11,460 |
'17 |
$11,407 |
$11,574 |
$11,716 |
'18 |
$11,692 |
$11,867 |
$12,368 |
'18 |
$11,300 |
$11,477 |
$11,785 |
'18 |
$11,070 |
$11,241 |
$11,560 |
'18 |
$11,469 |
$11,654 |
$11,762 |
'18 |
$11,392 |
$11,574 |
$11,491 |
'18 |
$11,325 |
$11,504 |
$11,275 |
'18 |
$11,598 |
$11,785 |
$11,544 |
'18 |
$11,447 |
$11,637 |
$11,303 |
'18 |
$11,528 |
$11,722 |
$11,354 |
'18 |
$10,768 |
$10,949 |
$10,431 |
'18 |
$10,856 |
$11,039 |
$10,529 |
'18 |
$10,323 |
$10,502 |
$10,052 |
'19 |
$10,975 |
$11,168 |
$10,812 |
'19 |
$11,287 |
$11,495 |
$11,024 |
'19 |
$11,452 |
$11,660 |
$11,089 |
'19 |
$11,833 |
$12,045 |
$11,382 |
'19 |
$11,247 |
$11,456 |
$10,771 |
'19 |
$11,740 |
$11,964 |
$11,420 |
'19 |
$11,775 |
$12,002 |
$11,282 |
'19 |
$11,522 |
$11,745 |
$10,933 |
'19 |
$11,859 |
$12,095 |
$11,215 |
'19 |
$12,088 |
$12,334 |
$11,606 |
'19 |
$12,309 |
$12,564 |
$11,708 |
'19 |
$12,620 |
$12,889 |
$12,215 |
'20 |
$12,409 |
$12,694 |
$11,887 |
'20 |
$11,594 |
$11,855 |
$10,947 |
'20 |
$10,143 |
$10,377 |
$9,362 |
'20 |
$10,826 |
$11,079 |
$10,072 |
'20 |
$11,157 |
$11,414 |
$10,401 |
'20 |
$11,570 |
$11,841 |
$10,872 |
'20 |
$11,730 |
$12,010 |
$11,356 |
'20 |
$12,129 |
$12,422 |
$11,842 |
'20 |
$11,976 |
$12,268 |
$11,551 |
'20 |
$11,697 |
$11,990 |
$11,303 |
'20 |
$13,040 |
$13,372 |
$12,823 |
'20 |
$13,500 |
$13,853 |
$13,516 |
'21 |
$13,622 |
$13,977 |
$13,546 |
'21 |
$13,920 |
$14,289 |
$13,814 |
'21 |
$14,365 |
$14,745 |
$13,989 |
'21 |
$14,570 |
$14,958 |
$14,400 |
'21 |
$14,875 |
$15,276 |
$14,835 |
'21 |
$15,040 |
$15,446 |
$14,755 |
'21 |
$14,804 |
$15,198 |
$14,511 |
'21 |
$15,115 |
$15,528 |
$14,787 |
'21 |
$14,837 |
$15,248 |
$14,314 |
'21 |
$15,136 |
$15,557 |
$14,655 |
'21 |
$14,736 |
$15,150 |
$13,996 |
'21 |
$15,238 |
$15,671 |
$14,574 |
'22 |
$14,812 |
$15,230 |
$14,037 |
'22 |
$14,471 |
$14,921 |
$13,759 |
'22 |
$14,621 |
$15,045 |
$13,781 |
'22 |
$14,299 |
$14,714 |
$12,916 |
'22 |
$14,290 |
$14,696 |
$13,008 |
'22 |
$13,457 |
$13,845 |
$11,889 |
'22 |
$13,949 |
$14,355 |
$12,296 |
'22 |
$13,767 |
$14,192 |
$11,901 |
'22 |
$12,854 |
$13,246 |
$10,712 |
'22 |
$13,248 |
$13,663 |
$11,032 |
'22 |
$14,326 |
$14,786 |
$12,334 |
'22 |
$13,918 |
$14,374 |
$12,242 |
'23 |
$14,853 |
$15,335 |
$13,235 |
'23 |
$14,701 |
$15,188 |
$12,770 |
'23 |
$14,859 |
$15,345 |
$13,082 |
'23 |
$15,108 |
$15,604 |
$13,309 |
'23 |
$14,863 |
$15,364 |
$12,826 |
'23 |
$15,412 |
$15,934 |
$13,401 |
'23 |
$15,854 |
$16,403 |
$13,946 |
'23 |
$15,457 |
$16,004 |
$13,316 |
'23 |
$15,259 |
$15,799 |
$12,895 |
'23 |
$14,762 |
$15,289 |
$12,363 |
'23 |
$15,670 |
$16,245 |
$13,476 |
'23 |
$16,167 |
$16,768 |
$14,153 |
'24 |
$16,299 |
$16,911 |
$14,013 |
'24 |
$16,876 |
$17,524 |
$14,367 |
'24 |
$17,502 |
$18,170 |
$14,795 |
'24 |
$17,486 |
$18,166 |
$14,551 |
'24 |
$17,844 |
$18,544 |
$14,973 |
'24 |
$17,987 |
$18,702 |
$14,959 |
'24 |
$18,200 |
$18,937 |
$15,305 |
'24 |
$18,300 |
$19,060 |
$15,741 |
'24 |
$18,609 |
$19,388 |
$16,165 |
'24 |
$18,333 |
$19,086 |
$15,372 |
'24 |
$18,372 |
$19,128 |
$15,233 |
'24 |
$18,455 |
$19,218 |
$14,937 |
'25 |
$19,116 |
$19,960 |
$15,538 |
'25 |
$19,342 |
$20,140 |
$15,754 |
'25 |
$18,996 |
$19,788 |
$15,718 |
'25 |
$18,969 |
$19,779 |
$16,286 |
'25 |
$19,798 |
$20,651 |
$17,032 |
|
| Average Annual Return [Table Text Block] |
|
|
Fund/Index |
1-Year |
5-Year |
10-Year |
Xtrackers MSCI All World ex US Hedged Equity ETF - NAV |
10.95% |
12.15% |
7.07% |
MSCI ACWI ex USA US Dollar Hedged Index |
11.36% |
12.59% |
7.52% |
MSCI ACWI ex USA Index |
13.75% |
10.37% |
5.47% | |
| AssetsNet |
|
|
$ 176,998,906
|
| Holdings Count | Holding |
|
|
1,846
|
| Advisory Fees Paid, Amount |
|
|
$ 589,586
|
| InvestmentCompanyPortfolioTurnover |
|
|
13.00%
|
| Additional Fund Statistics [Text Block] |
|
|
Net Assets ($) |
176,998,906 |
Number of Portfolio Holdings |
1,846 |
Portfolio Turnover Rate (%) |
13 |
Total Net Advisory Fees Paid ($) |
589,586 | |
| Holdings [Text Block] |
|
|
Sector |
% of Net Assets |
Financials |
24% |
Industrials |
14% |
Information Technology |
12% |
Consumer Discretionary |
10% |
Health Care |
8% |
Consumer Staples |
7% |
Materials |
6% |
Communication Services |
6% |
Energy |
5% |
Utilities |
3% |
Real Estate |
2% |
Other |
0% | Geographical Diversification
Country |
% of Net Assets |
Japan |
14% |
United Kingdom |
9% |
Canada |
8% |
China |
7% |
France |
7% |
Germany |
6% |
Switzerland |
6% |
Taiwan |
5% |
India |
5% |
Australia |
4% |
Netherlands |
3% |
Other |
20% | |
| Largest Holdings [Text Block] |
|
|
Ten Largest Equity Holdings
Holdings |
10.9% of Net Assets |
Taiwan Semiconductor Manufacturing Co. Ltd. (Taiwan) |
2.7% |
Tencent Holdings Ltd. (China) |
1.4% |
SAP SE (Germany) |
1.1% |
ASML Holding NV (Netherlands) |
1.0% |
Nestle SA (Switzerland) |
0.9% |
Alibaba Group Holding Ltd. (China) |
0.8% |
Roche Holding AG (Switzerland) |
0.8% |
AstraZeneca PLC (United Kingdom) |
0.8% |
Novo Nordisk A/S (Denmark) |
0.7% |
Samsung Electronics Co. Ltd. (South Korea) |
0.7% | |
| Material Fund Change [Text Block] |
|
|
|
| Updated Prospectus Phone Number |
|
|
(844) 851-4255
|
| Updated Prospectus Web Address |
|
|
dws.com/en-us/resources/proxy-voting
|
| C000096055 |
|
|
|
| Shareholder Report [Line Items] |
|
|
|
| Fund Name |
|
|
Xtrackers MSCI EAFE Hedged Equity ETF
|
| Class Name |
|
|
Xtrackers MSCI EAFE Hedged Equity ETF
|
| Trading Symbol |
|
|
DBEF
|
| Security Exchange Name |
|
|
NYSEArca
|
| Annual or Semi-Annual Statement [Text Block] |
|
|
This annual shareholder report contains important information about the Xtrackers MSCI EAFE Hedged Equity ETF (the "Fund") for the period June 1, 2024 to May 31, 2025.
|
| Shareholder Report Annual or Semi-Annual |
|
|
Annual Shareholder Report
|
| Additional Information [Text Block] |
|
|
This annual shareholder report contains important information about the Xtrackers MSCI EAFE Hedged Equity ETF (the "Fund") for the period June 1, 2024 to May 31, 2025. You can find additional information about the Fund at dws.com/etfreports. You can also request this information by contacting us at (844) 851‐4255.
|
| Additional Information Phone Number |
|
|
(844) 851‐4255
|
| Additional Information Website |
|
|
dws.com/etfreports
|
| Expenses [Text Block] |
|
|
What were the Fund costs for the last year?(Based on a hypothetical $10,000 investment)
Fund |
Costs of a $10,000 investment |
Costs paid as a percentage of a $10,000 investment |
DBEF |
$37 |
0.35% | Gross expense ratio as of the latest prospectus: 0.35%. See prospectus for any contractual or voluntary waivers; without a waiver, costs would have been higher. |
| Expenses Paid, Amount |
|
|
$ 37
|
| Expense Ratio, Percent |
|
|
0.35%
|
| Factors Affecting Performance [Text Block] |
|
|
How did the fund perform last year and what affected its performance?The Fund seeks investment results that correspond generally to the performance, before fees and expenses, of the MSCI EAFE US Dollar Hedged Index (the Underlying Index). The Underlying Index is designed to track developed market performance while mitigating exposure to fluctuations between the value of the U.S. dollar and the currencies of the countries included in the Underlying Index. The Fund returned 9.53% for the period ended May 31, 2025. The Fund's underlying index returned 9.69% and the Fund's broad-based index the MSCI EAFE Index returned 13.33% during the same period. The majority of sectors contributed positively to performance during the period with the greatest contribution coming from Financials, Industrials and Communication Services. The Energy, Materials and Health Care sectors detracted from performance. From a geographical perspective, the majority of countries contributed positively to performance during the period with the greatest contribution coming from Germany, Japan and the United Kingdom while Denmark, Netherlands and Portugal contributed negatively to performance. The Fund entered into forward foreign currency contracts during the period to hedge against changes in the value of the U.S dollar against specified non-U.S currencies. The currency hedging strategy contributed negatively to performance. |
| Line Graph [Table Text Block] |
|
|
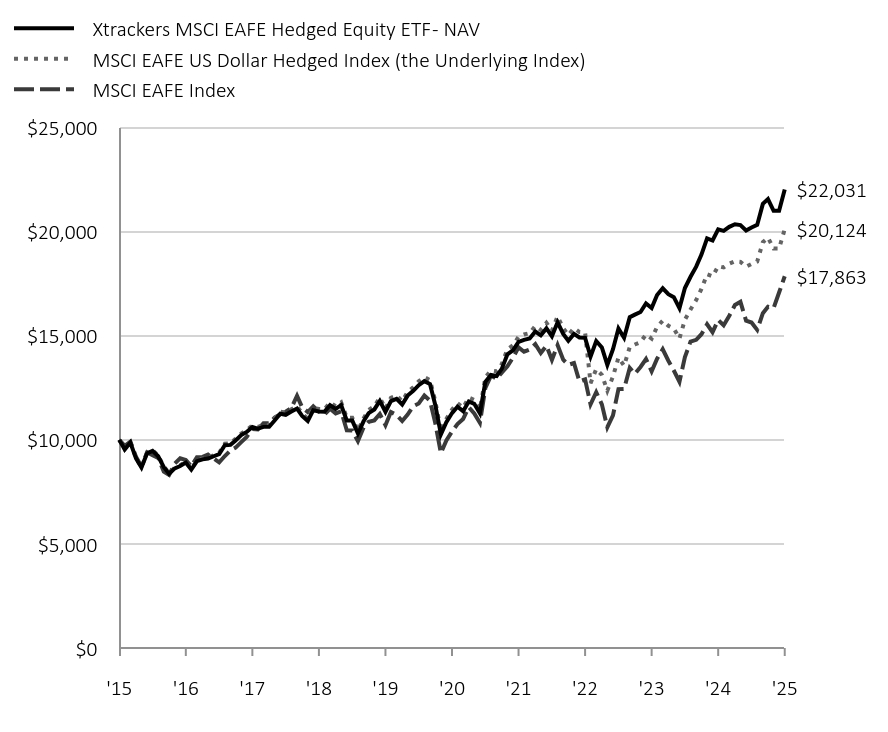
|
Xtrackers MSCI EAFE Hedged Equity ETF - NAV |
MSCI EAFE US Dollar Hedged Index (the Underlying Index) |
MSCI EAFE Index |
'15 |
$10,000 |
$10,000 |
$10,000 |
'15 |
$9,535 |
$9,549 |
$9,717 |
'15 |
$9,869 |
$9,884 |
$9,918 |
'15 |
$9,111 |
$9,127 |
$9,189 |
'15 |
$8,677 |
$8,693 |
$8,722 |
'15 |
$9,355 |
$9,381 |
$9,404 |
'15 |
$9,472 |
$9,502 |
$9,258 |
'15 |
$9,213 |
$9,245 |
$9,134 |
'16 |
$8,685 |
$8,719 |
$8,473 |
'16 |
$8,372 |
$8,408 |
$8,318 |
'16 |
$8,631 |
$8,668 |
$8,859 |
'16 |
$8,742 |
$8,779 |
$9,116 |
'16 |
$8,911 |
$8,948 |
$9,033 |
'16 |
$8,570 |
$8,604 |
$8,730 |
'16 |
$8,981 |
$9,020 |
$9,172 |
'16 |
$9,064 |
$9,112 |
$9,179 |
'16 |
$9,102 |
$9,150 |
$9,291 |
'16 |
$9,213 |
$9,266 |
$9,101 |
'16 |
$9,320 |
$9,381 |
$8,920 |
'16 |
$9,743 |
$9,814 |
$9,225 |
'17 |
$9,760 |
$9,835 |
$9,493 |
'17 |
$9,971 |
$10,052 |
$9,628 |
'17 |
$10,227 |
$10,307 |
$9,893 |
'17 |
$10,383 |
$10,464 |
$10,145 |
'17 |
$10,618 |
$10,698 |
$10,518 |
'17 |
$10,544 |
$10,626 |
$10,499 |
'17 |
$10,625 |
$10,711 |
$10,802 |
'17 |
$10,631 |
$10,721 |
$10,798 |
'17 |
$10,929 |
$11,023 |
$11,066 |
'17 |
$11,259 |
$11,359 |
$11,234 |
'17 |
$11,206 |
$11,312 |
$11,352 |
'17 |
$11,358 |
$11,467 |
$11,534 |
'18 |
$11,507 |
$11,623 |
$12,113 |
'18 |
$11,148 |
$11,265 |
$11,566 |
'18 |
$10,906 |
$11,016 |
$11,338 |
'18 |
$11,425 |
$11,539 |
$11,617 |
'18 |
$11,366 |
$11,483 |
$11,356 |
'18 |
$11,350 |
$11,470 |
$11,217 |
'18 |
$11,664 |
$11,794 |
$11,493 |
'18 |
$11,487 |
$11,618 |
$11,271 |
'18 |
$11,667 |
$11,804 |
$11,369 |
'18 |
$10,934 |
$11,068 |
$10,464 |
'18 |
$10,927 |
$11,066 |
$10,451 |
'18 |
$10,307 |
$10,439 |
$9,944 |
'19 |
$10,892 |
$11,036 |
$10,597 |
'19 |
$11,285 |
$11,438 |
$10,867 |
'19 |
$11,462 |
$11,615 |
$10,936 |
'19 |
$11,872 |
$12,029 |
$11,243 |
'19 |
$11,351 |
$11,499 |
$10,704 |
'19 |
$11,865 |
$12,022 |
$11,338 |
'19 |
$11,967 |
$12,129 |
$11,195 |
'19 |
$11,699 |
$11,861 |
$10,905 |
'19 |
$12,128 |
$12,299 |
$11,217 |
'19 |
$12,356 |
$12,532 |
$11,620 |
'19 |
$12,626 |
$12,811 |
$11,751 |
'19 |
$12,822 |
$13,011 |
$12,133 |
'20 |
$12,680 |
$12,872 |
$11,879 |
'20 |
$11,678 |
$11,863 |
$10,806 |
'20 |
$10,263 |
$10,420 |
$9,363 |
'20 |
$10,845 |
$11,003 |
$9,968 |
'20 |
$11,288 |
$11,455 |
$10,402 |
'20 |
$11,592 |
$11,765 |
$10,757 |
'20 |
$11,379 |
$11,552 |
$11,007 |
'20 |
$11,846 |
$12,032 |
$11,573 |
'20 |
$11,734 |
$11,922 |
$11,272 |
'20 |
$11,278 |
$11,461 |
$10,822 |
'20 |
$12,791 |
$13,001 |
$12,500 |
'20 |
$13,120 |
$13,337 |
$13,081 |
'21 |
$13,071 |
$13,293 |
$12,942 |
'21 |
$13,411 |
$13,644 |
$13,232 |
'21 |
$14,108 |
$14,353 |
$13,536 |
'21 |
$14,298 |
$14,543 |
$13,944 |
'21 |
$14,705 |
$14,953 |
$14,444 |
'21 |
$14,809 |
$15,063 |
$14,236 |
'21 |
$14,871 |
$15,129 |
$14,344 |
'21 |
$15,204 |
$15,474 |
$14,597 |
'21 |
$15,022 |
$15,284 |
$14,173 |
'21 |
$15,355 |
$15,628 |
$14,522 |
'21 |
$14,979 |
$15,249 |
$13,846 |
'21 |
$15,648 |
$15,928 |
$14,555 |
'22 |
$15,088 |
$15,364 |
$13,851 |
'22 |
$14,762 |
$15,035 |
$13,606 |
'22 |
$15,092 |
$15,369 |
$13,694 |
'22 |
$14,918 |
$15,182 |
$12,808 |
'22 |
$14,902 |
$15,164 |
$12,904 |
'22 |
$14,003 |
$12,721 |
$11,706 |
'22 |
$14,749 |
$13,400 |
$12,289 |
'22 |
$14,439 |
$13,123 |
$11,706 |
'22 |
$13,603 |
$12,363 |
$10,611 |
'22 |
$14,357 |
$13,046 |
$11,181 |
'22 |
$15,347 |
$13,956 |
$12,441 |
'22 |
$14,905 |
$13,563 |
$12,451 |
'23 |
$15,895 |
$14,464 |
$13,459 |
'23 |
$16,018 |
$14,583 |
$13,178 |
'23 |
$16,144 |
$14,692 |
$13,505 |
'23 |
$16,554 |
$15,063 |
$13,886 |
'23 |
$16,337 |
$14,865 |
$13,298 |
'23 |
$16,963 |
$15,432 |
$13,904 |
'23 |
$17,283 |
$15,730 |
$14,353 |
'23 |
$16,999 |
$15,481 |
$13,804 |
'23 |
$16,856 |
$15,348 |
$13,332 |
'23 |
$16,327 |
$14,873 |
$12,792 |
'23 |
$17,297 |
$15,771 |
$13,979 |
'23 |
$17,839 |
$16,268 |
$14,722 |
'24 |
$18,324 |
$16,716 |
$14,806 |
'24 |
$18,902 |
$17,253 |
$15,077 |
'24 |
$19,681 |
$17,957 |
$15,556 |
'24 |
$19,580 |
$17,862 |
$15,174 |
'24 |
$20,114 |
$18,346 |
$15,762 |
'24 |
$20,043 |
$18,284 |
$15,508 |
'24 |
$20,236 |
$18,467 |
$15,963 |
'24 |
$20,359 |
$18,585 |
$16,482 |
'24 |
$20,323 |
$18,553 |
$16,634 |
'24 |
$20,058 |
$18,320 |
$15,729 |
'24 |
$20,204 |
$18,457 |
$15,640 |
'24 |
$20,328 |
$18,569 |
$15,284 |
'25 |
$21,340 |
$19,499 |
$16,088 |
'25 |
$21,572 |
$19,717 |
$16,400 |
'25 |
$21,005 |
$19,193 |
$16,333 |
'25 |
$21,007 |
$19,194 |
$17,082 |
'25 |
$22,031 |
$20,124 |
$17,863 |
|
| Average Annual Return [Table Text Block] |
|
|
Fund/Index |
1-Year |
5-Year |
10-Year |
Xtrackers MSCI EAFE Hedged Equity ETF - NAV |
9.53% |
14.31% |
8.22% |
MSCI EAFE US Dollar Hedged Index |
9.69% |
14.50% |
8.47% |
MSCI EAFE Index |
13.33% |
11.42% |
5.97% | |
| AssetsNet |
|
|
$ 8,031,260,664
|
| Holdings Count | Holding |
|
|
698
|
| Advisory Fees Paid, Amount |
|
|
$ 23,771,276
|
| InvestmentCompanyPortfolioTurnover |
|
|
12.00%
|
| Additional Fund Statistics [Text Block] |
|
|
Net Assets ($) |
8,031,260,664 |
Number of Portfolio Holdings |
698 |
Portfolio Turnover Rate (%) |
12 |
Total Net Advisory Fees Paid ($) |
23,771,276 | |
| Holdings [Text Block] |
|
|
Sector |
% of Net Assets |
Financials |
23% |
Industrials |
18% |
Health Care |
11% |
Consumer Discretionary |
10% |
Consumer Staples |
8% |
Information Technology |
8% |
Materials |
6% |
Communication Services |
5% |
Utilities |
4% |
Energy |
3% |
Real Estate |
2% | Geographical Diversification
Country |
% of Net Assets |
Japan |
21% |
United Kingdom |
14% |
France |
11% |
Germany |
10% |
Switzerland |
10% |
Australia |
6% |
Netherlands |
5% |
Sweden |
4% |
Spain |
3% |
Italy |
3% |
Denmark |
2% |
Other |
9% | |
| Largest Holdings [Text Block] |
|
|
Ten Largest Equity Holdings
Holdings |
12.8% of Net Assets |
SAP SE (Germany) |
1.7% |
ASML Holding NV (Netherlands) |
1.6% |
Nestle SA (Switzerland) |
1.5% |
Roche Holding AG (Switzerland) |
1.3% |
AstraZeneca PLC (United Kingdom) |
1.2% |
Novo Nordisk A/S (Denmark) |
1.2% |
Novartis AG (Switzerland) |
1.2% |
HSBC Holdings PLC (United Kingdom) |
1.1% |
Shell PLC (United Kingdom) |
1.0% |
Commonwealth Bank of Australia (Australia) |
1.0% | |
| Material Fund Change [Text Block] |
|
|
|
| Updated Prospectus Phone Number |
|
|
(844) 851-4255
|
| Updated Prospectus Web Address |
|
|
dws.com/en-us/resources/proxy-voting
|
| C000096054 |
|
|
|
| Shareholder Report [Line Items] |
|
|
|
| Fund Name |
|
|
Xtrackers MSCI Emerging Markets Hedged Equity ETF
|
| Class Name |
|
|
Xtrackers MSCI Emerging Markets Hedged Equity ETF
|
| Trading Symbol |
|
|
DBEM
|
| Security Exchange Name |
|
|
NYSEArca
|
| Annual or Semi-Annual Statement [Text Block] |
|
|
This annual shareholder report contains important information about the Xtrackers MSCI Emerging Markets Hedged Equity ETF (the "Fund") for the period June 1, 2024 to May 31, 2025.
|
| Shareholder Report Annual or Semi-Annual |
|
|
Annual Shareholder Report
|
| Additional Information [Text Block] |
|
|
This annual shareholder report contains important information about the Xtrackers MSCI Emerging Markets Hedged Equity ETF (the "Fund") for the period June 1, 2024 to May 31, 2025. You can find additional information about the Fund at dws.com/etfreports. You can also request this information by contacting us at (844) 851‐4255.
|
| Additional Information Phone Number |
|
|
(844) 851‐4255
|
| Additional Information Website |
|
|
dws.com/etfreports
|
| Expenses [Text Block] |
|
|
What were the Fund costs for the last year?(Based on a hypothetical $10,000 investment)
Fund |
Costs of a $10,000 investment |
Costs paid as a percentage of a $10,000 investment |
DBEM |
$70 |
0.66% | Gross expense ratio as of the latest prospectus: 0.67%. See prospectus for any contractual or voluntary waivers; without a waiver, costs would have been higher. |
| Expenses Paid, Amount |
|
|
$ 70
|
| Expense Ratio, Percent |
|
|
0.66%
|
| Factors Affecting Performance [Text Block] |
|
|
How did the fund perform last year and what affected its performance?The Fund seeks investment results that correspond generally to the performance, before fees and expenses, of the MSCI EM US Dollar Hedged Index (the Underlying Index). The Underlying Index is designed to track emerging market performance while mitigating exposure to fluctuations between the value of the U.S. dollar and the currencies of the countries included in the Underlying Index. The Fund returned 11.47% for the period ended May 31, 2025. The Fund's underlying index returned 12.27% and the Fund's broad-based index the MSCI Emerging Markets Index returned 13.04% during the same period. The majority of sectors contributed positively to performance during the period with the greatest contribution coming from Financials, Information Technology and Communication Services. The Energy, Materials and Utilities sectors detracted from performance. From a geographical perspective, the majority of countries contributed positively to performance during the period with the greatest contribution coming from Hong Kong, Taiwan and South Africa while the United States, Korea and Turkey contributed negatively to performance. The Fund entered into forward foreign currency contracts during the period to hedge against changes in the value of the U.S dollar against specified non-U.S currencies. The currency hedging strategy contributed negatively to performance. |
| Line Graph [Table Text Block] |
|
|
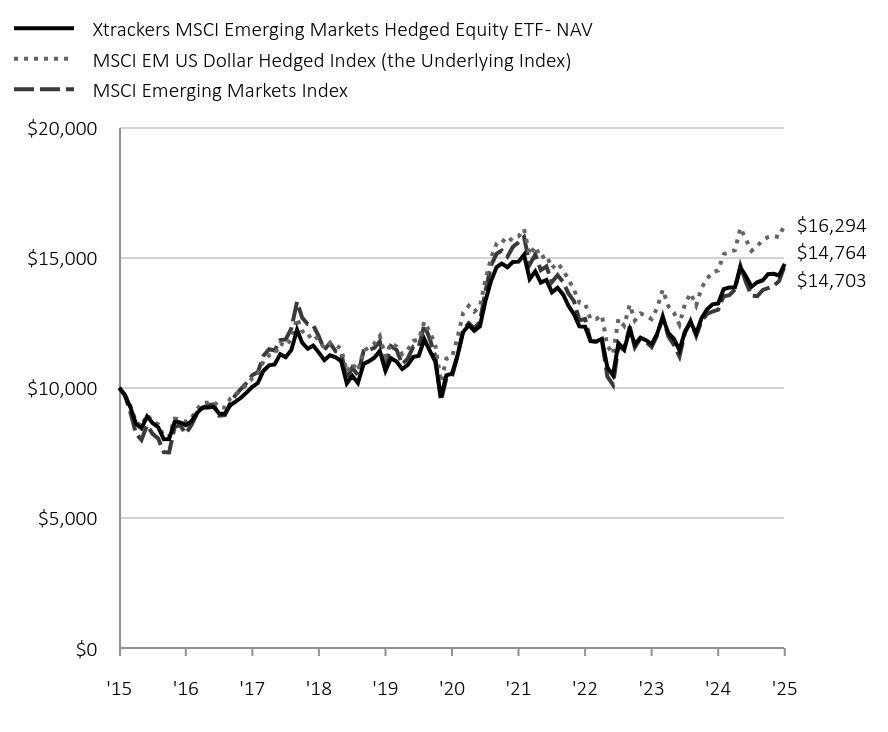
|
Xtrackers MSCI Emerging Markets Hedged Equity ETF - NAV |
MSCI EM US Dollar Hedged Index (the Underlying Index) |
MSCI Emerging Markets Index |
'15 |
$10,000 |
$10,000 |
$10,000 |
'15 |
$9,728 |
$9,751 |
$9,740 |
'15 |
$9,257 |
$9,309 |
$9,065 |
'15 |
$8,619 |
$8,693 |
$8,245 |
'15 |
$8,443 |
$8,521 |
$7,997 |
'15 |
$8,904 |
$8,969 |
$8,568 |
'15 |
$8,646 |
$8,708 |
$8,233 |
'15 |
$8,485 |
$8,598 |
$8,050 |
'16 |
$8,025 |
$8,137 |
$7,528 |
'16 |
$8,030 |
$8,127 |
$7,515 |
'16 |
$8,702 |
$8,817 |
$8,510 |
'16 |
$8,674 |
$8,790 |
$8,556 |
'16 |
$8,568 |
$8,701 |
$8,237 |
'16 |
$8,709 |
$8,825 |
$8,566 |
'16 |
$9,028 |
$9,183 |
$8,997 |
'16 |
$9,246 |
$9,415 |
$9,221 |
'16 |
$9,246 |
$9,436 |
$9,339 |
'16 |
$9,269 |
$9,472 |
$9,362 |
'16 |
$9,010 |
$9,250 |
$8,931 |
'16 |
$9,003 |
$9,243 |
$8,950 |
'17 |
$9,339 |
$9,598 |
$9,440 |
'17 |
$9,470 |
$9,745 |
$9,729 |
'17 |
$9,629 |
$9,918 |
$9,975 |
'17 |
$9,825 |
$10,135 |
$10,193 |
'17 |
$10,040 |
$10,371 |
$10,495 |
'17 |
$10,185 |
$10,526 |
$10,600 |
'17 |
$10,658 |
$11,031 |
$11,232 |
'17 |
$10,867 |
$11,248 |
$11,483 |
'17 |
$10,898 |
$11,286 |
$11,437 |
'17 |
$11,295 |
$11,711 |
$11,838 |
'17 |
$11,180 |
$11,601 |
$11,862 |
'17 |
$11,457 |
$11,882 |
$12,287 |
'18 |
$12,231 |
$12,686 |
$13,311 |
'18 |
$11,736 |
$12,189 |
$12,698 |
'18 |
$11,500 |
$11,936 |
$12,444 |
'18 |
$11,625 |
$12,083 |
$12,406 |
'18 |
$11,354 |
$11,816 |
$11,967 |
'18 |
$11,067 |
$11,524 |
$11,470 |
'18 |
$11,250 |
$11,715 |
$11,722 |
'18 |
$11,171 |
$11,644 |
$11,405 |
'18 |
$11,029 |
$11,502 |
$11,344 |
'18 |
$10,171 |
$10,614 |
$10,356 |
'18 |
$10,463 |
$10,931 |
$10,783 |
'18 |
$10,187 |
$10,653 |
$10,496 |
'19 |
$10,918 |
$11,426 |
$11,416 |
'19 |
$11,017 |
$11,547 |
$11,442 |
'19 |
$11,156 |
$11,701 |
$11,538 |
'19 |
$11,416 |
$11,992 |
$11,781 |
'19 |
$10,653 |
$11,201 |
$10,926 |
'19 |
$11,138 |
$11,715 |
$11,608 |
'19 |
$11,010 |
$11,592 |
$11,466 |
'19 |
$10,727 |
$11,297 |
$10,907 |
'19 |
$10,872 |
$11,457 |
$11,115 |
'19 |
$11,185 |
$11,798 |
$11,584 |
'19 |
$11,236 |
$11,859 |
$11,568 |
'19 |
$11,866 |
$12,540 |
$12,431 |
'20 |
$11,414 |
$12,125 |
$11,852 |
'20 |
$11,009 |
$11,664 |
$11,227 |
'20 |
$9,642 |
$10,218 |
$9,498 |
'20 |
$10,481 |
$11,120 |
$10,367 |
'20 |
$10,545 |
$11,182 |
$10,447 |
'20 |
$11,238 |
$11,918 |
$11,215 |
'20 |
$12,145 |
$12,884 |
$12,217 |
'20 |
$12,411 |
$13,154 |
$12,487 |
'20 |
$12,195 |
$12,930 |
$12,287 |
'20 |
$12,362 |
$13,114 |
$12,540 |
'20 |
$13,328 |
$14,138 |
$13,700 |
'20 |
$14,112 |
$14,996 |
$14,707 |
'21 |
$14,645 |
$15,552 |
$15,158 |
'21 |
$14,775 |
$15,702 |
$15,274 |
'21 |
$14,634 |
$15,554 |
$15,043 |
'21 |
$14,838 |
$15,791 |
$15,417 |
'21 |
$14,852 |
$15,822 |
$15,594 |
'21 |
$15,117 |
$16,104 |
$15,802 |
'21 |
$14,184 |
$15,112 |
$14,739 |
'21 |
$14,478 |
$15,437 |
$15,124 |
'21 |
$14,044 |
$14,990 |
$14,523 |
'21 |
$14,148 |
$15,103 |
$14,667 |
'21 |
$13,670 |
$14,601 |
$14,069 |
'21 |
$13,845 |
$14,796 |
$14,333 |
'22 |
$13,581 |
$14,515 |
$14,062 |
'22 |
$13,161 |
$14,184 |
$13,641 |
'22 |
$12,836 |
$13,768 |
$13,333 |
'22 |
$12,366 |
$13,276 |
$12,592 |
'22 |
$12,348 |
$13,240 |
$12,647 |
'22 |
$11,794 |
$12,641 |
$11,806 |
'22 |
$11,779 |
$12,649 |
$11,777 |
'22 |
$11,884 |
$12,793 |
$11,826 |
'22 |
$10,790 |
$11,610 |
$10,440 |
'22 |
$10,479 |
$11,300 |
$10,116 |
'22 |
$11,721 |
$12,650 |
$11,616 |
'22 |
$11,479 |
$12,387 |
$11,453 |
'23 |
$12,235 |
$13,198 |
$12,357 |
'23 |
$11,672 |
$12,593 |
$11,556 |
'23 |
$11,924 |
$12,863 |
$11,906 |
'23 |
$11,833 |
$12,773 |
$11,771 |
'23 |
$11,681 |
$12,641 |
$11,573 |
'23 |
$12,075 |
$13,072 |
$12,013 |
'23 |
$12,707 |
$13,770 |
$12,761 |
'23 |
$12,103 |
$13,134 |
$11,975 |
'23 |
$11,887 |
$12,901 |
$11,661 |
'23 |
$11,455 |
$12,434 |
$11,208 |
'23 |
$12,161 |
$13,217 |
$12,105 |
'23 |
$12,525 |
$13,635 |
$12,579 |
'24 |
$12,091 |
$13,166 |
$11,994 |
'24 |
$12,674 |
$13,830 |
$12,565 |
'24 |
$13,015 |
$14,203 |
$12,841 |
'24 |
$13,211 |
$14,442 |
$12,934 |
'24 |
$13,245 |
$14,513 |
$13,007 |
'24 |
$13,795 |
$15,135 |
$13,520 |
'24 |
$13,856 |
$15,227 |
$13,560 |
'24 |
$13,866 |
$15,289 |
$13,779 |
'24 |
$14,630 |
$16,149 |
$14,699 |
'24 |
$14,278 |
$15,695 |
$14,046 |
'24 |
$13,885 |
$15,268 |
$13,541 |
'24 |
$14,058 |
$15,447 |
$13,522 |
'25 |
$14,138 |
$15,684 |
$13,764 |
'25 |
$14,372 |
$15,793 |
$13,831 |
'25 |
$14,386 |
$15,837 |
$13,918 |
'25 |
$14,320 |
$15,797 |
$14,101 |
'25 |
$14,764 |
$16,294 |
$14,703 |
|
| Average Annual Return [Table Text Block] |
|
|
Fund/Index |
1-Year |
5-Year |
10-Year |
Xtrackers MSCI Emerging Markets Hedged Equity ETF - NAV |
11.47% |
6.96% |
3.97% |
MSCI EM US Dollar Hedged Index |
12.27% |
7.82% |
5.00% |
MSCI Emerging Markets Index |
13.04% |
7.07% |
3.93% | |
| AssetsNet |
|
|
$ 68,489,246
|
| Holdings Count | Holding |
|
|
1,184
|
| Advisory Fees Paid, Amount |
|
|
$ 473,957
|
| InvestmentCompanyPortfolioTurnover |
|
|
10.00%
|
| Additional Fund Statistics [Text Block] |
|
|
Net Assets ($) |
68,489,246 |
Number of Portfolio Holdings |
1,184 |
Portfolio Turnover Rate (%) |
10 |
Total Net Advisory Fees Paid ($) |
473,957 | |
| Holdings [Text Block] |
|
|
Sector |
% of Net Assets |
Financials |
24% |
Information Technology |
22% |
Consumer Discretionary |
13% |
Communication Services |
10% |
Industrials |
7% |
Consumer Staples |
5% |
Materials |
5% |
Energy |
4% |
Utilities |
3% |
Health Care |
3% |
Real Estate |
2% |
Other |
0% | Geographical Diversification
Country |
% of Net Assets |
China |
26% |
India |
18% |
Taiwan |
18% |
South Korea |
9% |
Brazil |
4% |
Saudi Arabia |
4% |
South Africa |
3% |
Mexico |
2% |
United Arab Emirates |
2% |
Other |
12% | |
| Largest Holdings [Text Block] |
|
|
Ten Largest Equity Holdings
Holdings |
26.8% of Net Assets |
Taiwan Semiconductor Manufacturing Co. Ltd. (Taiwan) |
9.4% |
Tencent Holdings Ltd. (China) |
4.8% |
Alibaba Group Holding Ltd. (China) |
2.9% |
Samsung Electronics Co. Ltd. (South Korea) |
2.6% |
HDFC Bank Ltd. (India) |
1.5% |
Xiaomi Corp. (China) |
1.3% |
Reliance Industries Ltd. (India) |
1.2% |
ICICI Bank Ltd. (India) |
1.1% |
Meituan (China) |
1.0% |
China Construction Bank Corp. (China) |
1.0% | |
| Material Fund Change [Text Block] |
|
|
|
| Updated Prospectus Phone Number |
|
|
(844) 851-4255
|
| Updated Prospectus Web Address |
|
|
dws.com/en-us/resources/proxy-voting
|
| C000130527 |
|
|
|
| Shareholder Report [Line Items] |
|
|
|
| Fund Name |
|
|
Xtrackers MSCI Europe Hedged Equity ETF
|
| Class Name |
|
|
Xtrackers MSCI Europe Hedged Equity ETF
|
| Trading Symbol |
|
|
DBEU
|
| Security Exchange Name |
|
|
NYSEArca
|
| Annual or Semi-Annual Statement [Text Block] |
|
|
This annual shareholder report contains important information about the Xtrackers MSCI Europe Hedged Equity ETF (the "Fund") for the period June 1, 2024 to May 31, 2025.
|
| Shareholder Report Annual or Semi-Annual |
|
|
Annual Shareholder Report
|
| Additional Information [Text Block] |
|
|
This annual shareholder report contains important information about the Xtrackers MSCI Europe Hedged Equity ETF (the "Fund") for the period June 1, 2024 to May 31, 2025. You can find additional information about the Fund at dws.com/etfreports. You can also request this information by contacting us at (844) 851‐4255.
|
| Additional Information Phone Number |
|
|
(844) 851‐4255
|
| Additional Information Website |
|
|
dws.com/etfreports
|
| Expenses [Text Block] |
|
|
What were the Fund costs for the last year?(Based on a hypothetical $10,000 investment)
Fund |
Costs of a $10,000 investment |
Costs paid as a percentage of a $10,000 investment |
DBEU |
$47 |
0.45% | Gross expense ratio as of the latest prospectus: 0.45%. See prospectus for any contractual or voluntary waivers; without a waiver, costs would have been higher. |
| Expenses Paid, Amount |
|
|
$ 47
|
| Expense Ratio, Percent |
|
|
0.45%
|
| Factors Affecting Performance [Text Block] |
|
|
How did the fund perform last year and what affected its performance?The Fund seeks investment results that correspond generally to the performance, before fees and expenses, of the MSCI Europe US Dollar Hedged Index (the Underlying Index). The Underlying Index is designed to track the performance of the developed markets in Europe, while mitigating exposure to fluctuations between the value of the U.S. dollar and the currencies of the countries included in the Underlying Index. The Fund returned 8.86% for the period ended May 31, 2025. The Fund's underlying index returned 9.02% and the Fund's broad-based index the MSCI Europe Index returned 13.39% during the same period. The majority of sectors contributed positively to performance during the period with the greatest contribution coming from Financials, Industrials and Consumer Staples. The Energy, Health Care and Consumer Discretionary sectors detracted from performance. From a geographical perspective, the majority of countries contributed positively to performance during the period with the greatest contribution coming from Germany, the United Kingdom and Switzerland while Denmark, Netherlands and Portugal contributed negatively to performance. The Fund entered into forward foreign currency contracts during the period to hedge against changes in the value of the U.S dollar against specified non-U.S currencies. The currency hedging strategy contributed negatively to performance. |
| Line Graph [Table Text Block] |
|
|
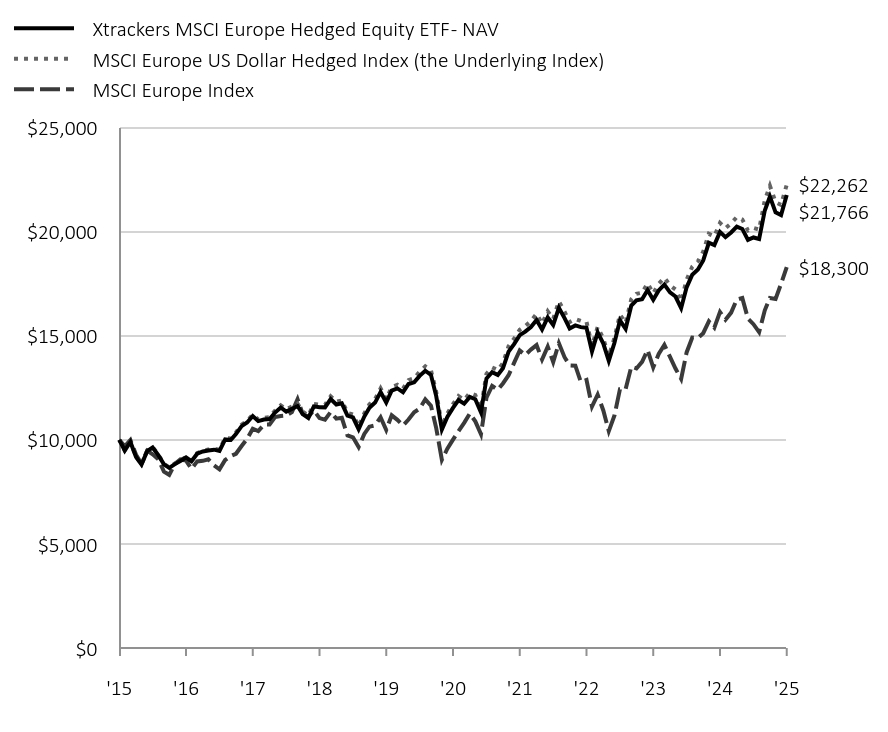
|
Xtrackers MSCI Europe Hedged Equity ETF - NAV |
MSCI Europe US Dollar Hedged Index (the Underlying Index) |
MSCI Europe Index |
'15 |
$10,000 |
$10,000 |
$10,000 |
'15 |
$9,489 |
$9,491 |
$9,693 |
'15 |
$9,900 |
$9,908 |
$9,996 |
'15 |
$9,177 |
$9,188 |
$9,284 |
'15 |
$8,820 |
$8,832 |
$8,850 |
'15 |
$9,457 |
$9,475 |
$9,484 |
'15 |
$9,634 |
$9,656 |
$9,310 |
'15 |
$9,268 |
$9,294 |
$9,071 |
'16 |
$8,822 |
$8,847 |
$8,473 |
'16 |
$8,654 |
$8,685 |
$8,321 |
'16 |
$8,836 |
$8,868 |
$8,843 |
'16 |
$8,986 |
$9,011 |
$9,059 |
'16 |
$9,154 |
$9,180 |
$9,006 |
'16 |
$8,974 |
$8,997 |
$8,605 |
'16 |
$9,335 |
$9,364 |
$8,966 |
'16 |
$9,445 |
$9,483 |
$8,992 |
'16 |
$9,493 |
$9,535 |
$9,071 |
'16 |
$9,530 |
$9,576 |
$8,775 |
'16 |
$9,471 |
$9,526 |
$8,584 |
'16 |
$10,023 |
$10,090 |
$9,034 |
'17 |
$10,000 |
$10,069 |
$9,222 |
'17 |
$10,279 |
$10,355 |
$9,332 |
'17 |
$10,658 |
$10,734 |
$9,707 |
'17 |
$10,834 |
$10,908 |
$10,049 |
'17 |
$11,145 |
$11,216 |
$10,537 |
'17 |
$10,901 |
$10,975 |
$10,422 |
'17 |
$10,980 |
$11,061 |
$10,733 |
'17 |
$11,003 |
$11,090 |
$10,739 |
'17 |
$11,313 |
$11,406 |
$11,093 |
'17 |
$11,557 |
$11,656 |
$11,146 |
'17 |
$11,359 |
$11,466 |
$11,170 |
'17 |
$11,487 |
$11,600 |
$11,338 |
'18 |
$11,627 |
$11,745 |
$11,951 |
'18 |
$11,241 |
$11,362 |
$11,249 |
'18 |
$11,052 |
$11,167 |
$11,113 |
'18 |
$11,612 |
$11,728 |
$11,421 |
'18 |
$11,573 |
$11,690 |
$11,046 |
'18 |
$11,563 |
$11,683 |
$10,972 |
'18 |
$11,960 |
$12,091 |
$11,337 |
'18 |
$11,701 |
$11,832 |
$11,021 |
'18 |
$11,758 |
$11,896 |
$11,060 |
'18 |
$11,168 |
$11,300 |
$10,216 |
'18 |
$11,079 |
$11,218 |
$10,121 |
'18 |
$10,510 |
$10,648 |
$9,653 |
'19 |
$11,121 |
$11,274 |
$10,289 |
'19 |
$11,544 |
$11,706 |
$10,635 |
'19 |
$11,792 |
$11,959 |
$10,700 |
'19 |
$12,303 |
$12,474 |
$11,082 |
'19 |
$11,793 |
$11,951 |
$10,475 |
'19 |
$12,371 |
$12,539 |
$11,179 |
'19 |
$12,472 |
$12,648 |
$10,962 |
'19 |
$12,286 |
$12,464 |
$10,686 |
'19 |
$12,684 |
$12,873 |
$10,977 |
'19 |
$12,766 |
$12,958 |
$11,329 |
'19 |
$13,076 |
$13,278 |
$11,499 |
'19 |
$13,323 |
$13,532 |
$11,948 |
'20 |
$13,126 |
$13,339 |
$11,647 |
'20 |
$12,104 |
$12,308 |
$10,567 |
'20 |
$10,498 |
$10,673 |
$9,041 |
'20 |
$11,097 |
$11,271 |
$9,577 |
'20 |
$11,534 |
$11,717 |
$10,013 |
'20 |
$11,914 |
$12,104 |
$10,420 |
'20 |
$11,739 |
$11,923 |
$10,821 |
'20 |
$12,061 |
$12,256 |
$11,266 |
'20 |
$11,953 |
$12,154 |
$10,891 |
'20 |
$11,318 |
$11,514 |
$10,276 |
'20 |
$12,947 |
$13,170 |
$12,025 |
'20 |
$13,253 |
$13,479 |
$12,591 |
'21 |
$13,123 |
$13,355 |
$12,409 |
'21 |
$13,437 |
$13,682 |
$12,712 |
'21 |
$14,241 |
$14,503 |
$13,105 |
'21 |
$14,603 |
$14,862 |
$13,700 |
'21 |
$15,030 |
$15,290 |
$14,293 |
'21 |
$15,202 |
$15,470 |
$14,077 |
'21 |
$15,425 |
$15,705 |
$14,337 |
'21 |
$15,759 |
$16,052 |
$14,554 |
'21 |
$15,306 |
$15,585 |
$13,859 |
'21 |
$15,881 |
$16,179 |
$14,483 |
'21 |
$15,520 |
$15,814 |
$13,736 |
'21 |
$16,346 |
$16,659 |
$14,643 |
'22 |
$15,849 |
$16,159 |
$13,973 |
'22 |
$15,354 |
$15,662 |
$13,578 |
'22 |
$15,500 |
$15,807 |
$13,564 |
'22 |
$15,418 |
$15,711 |
$12,784 |
'22 |
$15,384 |
$15,671 |
$12,880 |
'22 |
$14,247 |
$14,517 |
$11,599 |
'22 |
$15,168 |
$15,421 |
$12,173 |
'22 |
$14,628 |
$14,862 |
$11,414 |
'22 |
$13,799 |
$14,020 |
$10,422 |
'22 |
$14,663 |
$14,906 |
$11,169 |
'22 |
$15,744 |
$16,021 |
$12,436 |
'22 |
$15,339 |
$15,620 |
$12,438 |
'23 |
$16,453 |
$16,759 |
$13,517 |
'23 |
$16,702 |
$17,020 |
$13,433 |
'23 |
$16,759 |
$17,070 |
$13,751 |
'23 |
$17,199 |
$17,518 |
$14,323 |
'23 |
$16,736 |
$17,042 |
$13,482 |
'23 |
$17,182 |
$17,496 |
$14,128 |
'23 |
$17,457 |
$17,791 |
$14,561 |
'23 |
$17,086 |
$17,425 |
$13,984 |
'23 |
$16,889 |
$17,226 |
$13,428 |
'23 |
$16,330 |
$16,664 |
$12,926 |
'23 |
$17,330 |
$17,693 |
$14,202 |
'23 |
$17,939 |
$18,322 |
$14,912 |
'24 |
$18,183 |
$18,579 |
$14,894 |
'24 |
$18,623 |
$19,039 |
$15,126 |
'24 |
$19,471 |
$19,901 |
$15,692 |
'24 |
$19,360 |
$19,782 |
$15,394 |
'24 |
$19,995 |
$20,420 |
$16,140 |
'24 |
$19,742 |
$20,169 |
$15,777 |
'24 |
$19,965 |
$20,404 |
$16,116 |
'24 |
$20,249 |
$20,704 |
$16,751 |
'24 |
$20,135 |
$20,592 |
$16,816 |
'24 |
$19,608 |
$20,061 |
$15,825 |
'24 |
$19,726 |
$20,184 |
$15,559 |
'24 |
$19,651 |
$20,105 |
$15,178 |
'25 |
$21,023 |
$21,514 |
$16,224 |
'25 |
$21,693 |
$22,207 |
$16,820 |
'25 |
$20,930 |
$21,419 |
$16,769 |
'25 |
$20,803 |
$21,292 |
$17,502 |
'25 |
$21,766 |
$22,262 |
$18,300 |
|
| Average Annual Return [Table Text Block] |
|
|
Fund/Index |
1-Year |
5-Year |
10-Year |
Xtrackers MSCI Europe Hedged Equity ETF - NAV |
8.86% |
13.54% |
8.09% |
MSCI Europe US Dollar Hedged Index |
9.02% |
13.70% |
8.33% |
MSCI Europe Index |
13.39% |
12.82% |
6.23% | |
| AssetsNet |
|
|
$ 684,512,143
|
| Holdings Count | Holding |
|
|
404
|
| Advisory Fees Paid, Amount |
|
|
$ 2,623,619
|
| InvestmentCompanyPortfolioTurnover |
|
|
10.00%
|
| Additional Fund Statistics [Text Block] |
|
|
Net Assets ($) |
684,512,143 |
Number of Portfolio Holdings |
404 |
Portfolio Turnover Rate (%) |
10 |
Total Net Advisory Fees Paid ($) |
2,623,619 | |
| Holdings [Text Block] |
|
|
Sector |
% of Net Assets |
Financials |
22% |
Industrials |
18% |
Health Care |
13% |
Consumer Staples |
10% |
Consumer Discretionary |
8% |
Information Technology |
7% |
Materials |
5% |
Utilities |
4% |
Energy |
4% |
Communication Services |
4% |
Real Estate |
1% | Geographical Diversification
Country |
% of Net Assets |
United Kingdom |
21% |
France |
16% |
Germany |
15% |
Switzerland |
15% |
Netherlands |
7% |
Sweden |
5% |
Spain |
5% |
Italy |
4% |
Denmark |
3% |
Finland |
2% |
Other |
3% | |
| Largest Holdings [Text Block] |
|
|
Ten Largest Equity Holdings
Holdings |
18.7% of Net Assets |
SAP SE (Germany) |
2.5% |
ASML Holding NV (Netherlands) |
2.3% |
Nestle SA (Switzerland) |
2.2% |
Roche Holding AG (Switzerland) |
1.9% |
AstraZeneca PLC (United Kingdom) |
1.8% |
Novo Nordisk A/S (Denmark) |
1.7% |
Novartis AG (Switzerland) |
1.7% |
HSBC Holdings PLC (United Kingdom) |
1.6% |
Shell PLC (United Kingdom) |
1.6% |
Siemens AG (Germany) |
1.4% | |
| Material Fund Change [Text Block] |
|
|
|
| Updated Prospectus Phone Number |
|
|
(844) 851-4255
|
| Updated Prospectus Web Address |
|
|
dws.com/en-us/resources/proxy-voting
|
| C000144410 |
|
|
|
| Shareholder Report [Line Items] |
|
|
|
| Fund Name |
|
|
Xtrackers MSCI Eurozone Hedged Equity ETF
|
| Class Name |
|
|
Xtrackers MSCI Eurozone Hedged Equity ETF
|
| Trading Symbol |
|
|
DBEZ
|
| Security Exchange Name |
|
|
NYSEArca
|
| Annual or Semi-Annual Statement [Text Block] |
|
|
This annual shareholder report contains important information about the Xtrackers MSCI Eurozone Hedged Equity ETF (the "Fund") for the period June 1, 2024 to May 31, 2025.
|
| Shareholder Report Annual or Semi-Annual |
|
|
Annual Shareholder Report
|
| Additional Information [Text Block] |
|
|
This annual shareholder report contains important information about the Xtrackers MSCI Eurozone Hedged Equity ETF (the "Fund") for the period June 1, 2024 to May 31, 2025. You can find additional information about the Fund at dws.com/etfreports. You can also request this information by contacting us at (844) 851‐4255.
|
| Additional Information Phone Number |
|
|
(844) 851‐4255
|
| Additional Information Website |
|
|
dws.com/etfreports
|
| Expenses [Text Block] |
|
|
What were the Fund costs for the last year?(Based on a hypothetical $10,000 investment)
Fund |
Costs of a $10,000 investment |
Costs paid as a percentage of a $10,000 investment |
DBEZ |
$48 |
0.45% | Gross expense ratio as of the latest prospectus: 0.45%. See prospectus for any contractual or voluntary waivers; without a waiver, costs would have been higher. |
| Expenses Paid, Amount |
|
|
$ 48
|
| Expense Ratio, Percent |
|
|
0.45%
|
| Factors Affecting Performance [Text Block] |
|
|
How did the fund perform last year and what affected its performance?The Fund seeks investment results that correspond generally to the performance, before fees and expenses, of the MSCI EMU IMI US Dollar Hedged Index (the Underlying Index). The Underlying Index is designed to track the performance of equity securities based in the countries in the European Monetary Union (the “EMU”), while seeking to mitigate exposure to fluctuations between the value of the U.S. dollar and the euro. The Fund returned 13.56% for the period ended May 31, 2025. The Fund's underlying index returned 13.81% and the Fund's broad-based index the MSCI EMU IMI Index returned 16.93% during the same period. The majority of sectors contributed positively to performance during the period with the greatest contribution coming from Financials, Industrials and Utilities. The Consumer Discretionary and Energy sectors detracted from performance. From a geographical perspective, the majority of countries contributed positively to performance during the period with the greatest contribution coming from Germany, Spain and Italy while Netherlands and the United Kingdom were the only negative contributor to performance. The Fund entered into forward foreign currency contracts during the period to hedge against changes in the value of the U.S dollar against specified non-U.S currencies. The currency hedging strategy contributed negatively to performance. |
| Line Graph [Table Text Block] |
|
|

|
Xtrackers MSCI Eurozone Hedged Equity ETF - NAV |
MSCI EMU IMI US Dollar Hedged Index (the Underlying Index) |
MSCI EMU IMI Index |
'15 |
$10,000 |
$10,000 |
$10,000 |
'15 |
$9,610 |
$9,603 |
$9,763 |
'15 |
$10,060 |
$10,061 |
$10,135 |
'15 |
$9,233 |
$9,237 |
$9,412 |
'15 |
$8,815 |
$8,821 |
$8,942 |
'15 |
$9,631 |
$9,648 |
$9,707 |
'15 |
$9,908 |
$9,924 |
$9,555 |
'15 |
$9,383 |
$9,401 |
$9,264 |
'16 |
$8,791 |
$8,804 |
$8,644 |
'16 |
$8,537 |
$8,558 |
$8,416 |
'16 |
$8,816 |
$8,833 |
$9,071 |
'16 |
$8,930 |
$8,946 |
$9,226 |
'16 |
$9,155 |
$9,159 |
$9,315 |
'16 |
$8,602 |
$8,605 |
$8,722 |
'16 |
$9,062 |
$9,067 |
$9,237 |
'16 |
$9,183 |
$9,197 |
$9,322 |
'16 |
$9,209 |
$9,224 |
$9,420 |
'16 |
$9,316 |
$9,332 |
$9,288 |
'16 |
$9,286 |
$9,302 |
$8,947 |
'16 |
$9,942 |
$9,954 |
$9,508 |
'17 |
$9,879 |
$9,895 |
$9,669 |
'17 |
$10,146 |
$10,164 |
$9,758 |
'17 |
$10,705 |
$10,728 |
$10,347 |
'17 |
$10,993 |
$11,016 |
$10,796 |
'17 |
$11,220 |
$11,230 |
$11,340 |
'17 |
$10,953 |
$10,965 |
$11,215 |
'17 |
$11,023 |
$11,039 |
$11,647 |
'17 |
$10,994 |
$11,018 |
$11,702 |
'17 |
$11,499 |
$11,527 |
$12,159 |
'17 |
$11,776 |
$11,807 |
$12,260 |
'17 |
$11,551 |
$11,595 |
$12,304 |
'17 |
$11,506 |
$11,551 |
$12,317 |
'18 |
$11,902 |
$11,956 |
$13,187 |
'18 |
$11,490 |
$11,547 |
$12,438 |
'18 |
$11,274 |
$11,331 |
$12,279 |
'18 |
$11,820 |
$11,878 |
$12,631 |
'18 |
$11,690 |
$11,742 |
$12,037 |
'18 |
$11,610 |
$11,659 |
$11,924 |
'18 |
$12,011 |
$12,067 |
$12,341 |
'18 |
$11,742 |
$11,802 |
$11,972 |
'18 |
$11,709 |
$11,773 |
$11,896 |
'18 |
$10,981 |
$11,040 |
$10,836 |
'18 |
$10,892 |
$10,953 |
$10,718 |
'18 |
$10,266 |
$10,325 |
$10,172 |
'19 |
$10,959 |
$11,028 |
$10,876 |
'19 |
$11,400 |
$11,475 |
$11,208 |
'19 |
$11,580 |
$11,655 |
$11,202 |
'19 |
$12,203 |
$12,279 |
$11,753 |
'19 |
$11,534 |
$11,585 |
$10,992 |
'19 |
$12,161 |
$12,214 |
$11,801 |
'19 |
$12,204 |
$12,261 |
$11,558 |
'19 |
$12,072 |
$12,135 |
$11,286 |
'19 |
$12,521 |
$12,590 |
$11,573 |
'19 |
$12,725 |
$12,798 |
$12,000 |
'19 |
$13,089 |
$13,172 |
$12,188 |
'19 |
$13,287 |
$13,373 |
$12,562 |
'20 |
$13,079 |
$13,170 |
$12,188 |
'20 |
$12,080 |
$12,173 |
$11,137 |
'20 |
$9,984 |
$10,058 |
$9,167 |
'20 |
$10,682 |
$10,757 |
$9,778 |
'20 |
$11,212 |
$11,288 |
$10,409 |
'20 |
$11,753 |
$11,828 |
$11,004 |
'20 |
$11,620 |
$11,686 |
$11,442 |
'20 |
$12,044 |
$12,119 |
$11,990 |
'20 |
$11,852 |
$11,934 |
$11,562 |
'20 |
$11,184 |
$11,269 |
$10,834 |
'20 |
$13,166 |
$13,269 |
$13,040 |
'20 |
$13,479 |
$13,588 |
$13,639 |
'21 |
$13,344 |
$13,459 |
$13,403 |
'21 |
$13,830 |
$13,954 |
$13,875 |
'21 |
$14,699 |
$14,840 |
$14,303 |
'21 |
$15,054 |
$15,193 |
$14,982 |
'21 |
$15,535 |
$15,676 |
$15,627 |
'21 |
$15,586 |
$15,733 |
$15,260 |
'21 |
$15,809 |
$15,966 |
$15,475 |
'21 |
$16,216 |
$16,384 |
$15,801 |
'21 |
$15,702 |
$15,854 |
$14,992 |
'21 |
$16,322 |
$16,492 |
$15,565 |
'21 |
$15,792 |
$15,962 |
$14,635 |
'21 |
$16,584 |
$16,764 |
$15,501 |
'22 |
$16,015 |
$16,192 |
$14,741 |
'22 |
$15,213 |
$15,388 |
$14,030 |
'22 |
$15,147 |
$15,320 |
$13,818 |
'22 |
$14,907 |
$15,076 |
$12,864 |
'22 |
$15,019 |
$15,177 |
$13,131 |
'22 |
$13,645 |
$13,787 |
$11,589 |
'22 |
$14,633 |
$14,774 |
$12,106 |
'22 |
$13,925 |
$14,070 |
$11,339 |
'22 |
$13,058 |
$13,195 |
$10,314 |
'22 |
$14,127 |
$14,280 |
$11,231 |
'22 |
$15,350 |
$15,525 |
$12,650 |
'22 |
$14,851 |
$15,029 |
$12,664 |
'23 |
$16,330 |
$16,529 |
$14,126 |
'23 |
$16,629 |
$16,842 |
$14,038 |
'23 |
$16,708 |
$16,920 |
$14,418 |
'23 |
$16,975 |
$17,193 |
$14,857 |
'23 |
$16,607 |
$16,808 |
$13,989 |
'23 |
$17,261 |
$17,475 |
$14,845 |
'23 |
$17,642 |
$17,860 |
$15,304 |
'23 |
$17,141 |
$17,362 |
$14,615 |
'23 |
$16,615 |
$16,829 |
$13,790 |
'23 |
$16,067 |
$16,280 |
$13,300 |
'23 |
$17,404 |
$17,647 |
$14,822 |
'23 |
$18,019 |
$18,276 |
$15,511 |
'24 |
$18,369 |
$18,638 |
$15,543 |
'24 |
$18,943 |
$19,225 |
$15,954 |
'24 |
$19,808 |
$20,105 |
$16,632 |
'24 |
$19,482 |
$19,772 |
$16,173 |
'24 |
$20,086 |
$20,370 |
$16,890 |
'24 |
$19,563 |
$19,842 |
$16,214 |
'24 |
$19,694 |
$19,983 |
$16,462 |
'24 |
$20,008 |
$20,310 |
$17,081 |
'24 |
$20,220 |
$20,533 |
$17,385 |
'24 |
$19,588 |
$19,900 |
$16,349 |
'24 |
$19,617 |
$19,933 |
$15,912 |
'24 |
$19,892 |
$20,215 |
$15,807 |
'25 |
$21,315 |
$21,671 |
$16,988 |
'25 |
$22,066 |
$22,437 |
$17,574 |
'25 |
$21,433 |
$21,796 |
$17,720 |
'25 |
$21,525 |
$21,895 |
$18,708 |
'25 |
$22,810 |
$23,183 |
$19,748 |
|
| Average Annual Return [Table Text Block] |
|
|
Fund/Index |
1-Year |
5-Year |
10-Year |
Xtrackers MSCI Eurozone Hedged Equity ETF - NAV |
13.56% |
15.26% |
8.60% |
MSCI EMU IMI US Dollar Hedged Index |
13.81% |
15.48% |
8.77% |
MSCI EMU IMI Index |
16.93% |
13.66% |
6.98% | |
| AssetsNet |
|
|
$ 76,427,572
|
| Holdings Count | Holding |
|
|
595
|
| Advisory Fees Paid, Amount |
|
|
$ 208,679
|
| InvestmentCompanyPortfolioTurnover |
|
|
12.00%
|
| Additional Fund Statistics [Text Block] |
|
|
Net Assets ($) |
76,427,572 |
Number of Portfolio Holdings |
595 |
Portfolio Turnover Rate (%) |
12 |
Total Net Advisory Fees Paid ($) |
208,679 | |
| Holdings [Text Block] |
|
|
Sector |
% of Net Assets |
Financials |
23% |
Industrials |
20% |
Information Technology |
12% |
Consumer Discretionary |
11% |
Utilities |
6% |
Consumer Staples |
6% |
Health Care |
6% |
Materials |
5% |
Communication Services |
5% |
Energy |
3% |
Real Estate |
1% | Geographical Diversification
Country |
% of Net Assets |
France |
29% |
Germany |
28% |
Netherlands |
13% |
Italy |
9% |
Spain |
9% |
Finland |
3% |
Belgium |
3% |
Ireland |
2% |
Other |
2% | |
| Largest Holdings [Text Block] |
|
|
Ten Largest Equity Holdings
Holdings |
24.0% of Net Assets |
SAP SE (Germany) |
4.4% |
ASML Holding NV (Netherlands) |
4.1% |
Siemens AG (Germany) |
2.5% |
Allianz SE (Germany) |
2.1% |
LVMH Moet Hennessy Louis Vuitton SE (France) |
2.1% |
Schneider Electric SE (France) |
1.9% |
Deutsche Telekom AG (Germany) |
1.8% |
Banco Santander SA (Spain) |
1.7% |
Air Liquide SA (France) |
1.7% |
TotalEnergies SE (France) |
1.7% | |
| Material Fund Change [Text Block] |
|
|
|
| Updated Prospectus Phone Number |
|
|
(844) 851-4255
|
| Updated Prospectus Web Address |
|
|
dws.com/en-us/resources/proxy-voting
|
| C000096058 |
|
|
|
| Shareholder Report [Line Items] |
|
|
|
| Fund Name |
|
|
Xtrackers MSCI Japan Hedged Equity ETF
|
| Class Name |
|
|
Xtrackers MSCI Japan Hedged Equity ETF
|
| Trading Symbol |
|
|
DBJP
|
| Security Exchange Name |
|
|
NYSEArca
|
| Annual or Semi-Annual Statement [Text Block] |
|
|
This annual shareholder report contains important information about the Xtrackers MSCI Japan Hedged Equity ETF (the "Fund") for the period June 1, 2024 to May 31, 2025.
|
| Shareholder Report Annual or Semi-Annual |
|
|
Annual Shareholder Report
|
| Additional Information [Text Block] |
|
|
This annual shareholder report contains important information about the Xtrackers MSCI Japan Hedged Equity ETF (the "Fund") for the period June 1, 2024 to May 31, 2025. You can find additional information about the Fund at dws.com/etfreports. You can also request this information by contacting us at (844) 851‐4255.
|
| Additional Information Phone Number |
|
|
(844) 851‐4255
|
| Additional Information Website |
|
|
dws.com/etfreports
|
| Expenses [Text Block] |
|
|
What were the Fund costs for the last year?(Based on a hypothetical $10,000 investment)
Fund |
Costs of a $10,000 investment |
Costs paid as a percentage of a $10,000 investment |
DBJP |
$46 |
0.45% | Gross expense ratio as of the latest prospectus: 0.45%. See prospectus for any contractual or voluntary waivers; without a waiver, costs would have been higher. |
| Expenses Paid, Amount |
|
|
$ 46
|
| Expense Ratio, Percent |
|
|
0.45%
|
| Factors Affecting Performance [Text Block] |
|
|
How did the fund perform last year and what affected its performance?The Fund seeks investment results that correspond generally to the performance, before fees and expenses, of the MSCI Japan US Dollar Hedged Index (the Underlying Index). The Underlying Index is designed to track the performance of the Japanese equity market while mitigating exposure to fluctuations between the value of the U.S. dollar and Japanese yen. The Fund returned 6.07% for the period ended May 31, 2025. The Fund's underlying index returned 6.48% and the Fund's broad-based index the MSCI Japan Index returned 11.17% during the same period. The majority of sectors contributed positively to performance during the period with the greatest contribution coming from Financials, Industrials and Consumer Discretionary. The Utilities, Information Technology and Energy sectors detracted from performance. The Fund entered into forward foreign currency contracts during the period to hedge against changes in the value of the U.S dollar against the Japanese yen. The currency hedging strategy contributed negatively to performance. |
| Line Graph [Table Text Block] |
|
|
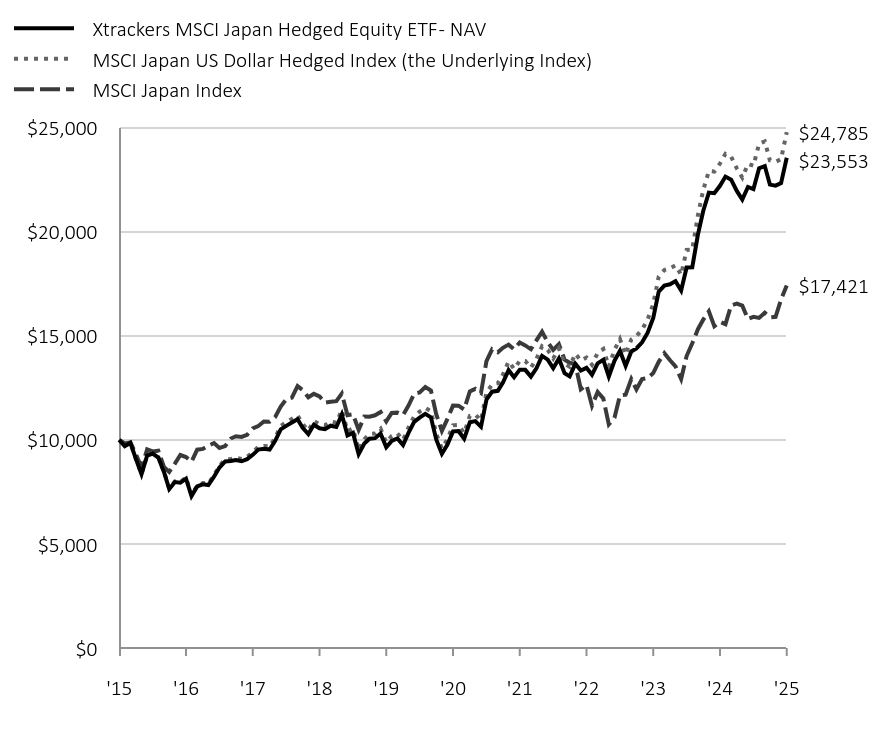
|
Xtrackers MSCI Japan Hedged Equity ETF - NAV |
MSCI Japan US Dollar Hedged Index (the Underlying Index) |
MSCI Japan Index |
'15 |
$10,000 |
$10,000 |
$10,000 |
'15 |
$9,696 |
$9,691 |
$9,829 |
'15 |
$9,858 |
$9,860 |
$9,875 |
'15 |
$9,066 |
$9,070 |
$9,301 |
'15 |
$8,353 |
$8,350 |
$8,668 |
'15 |
$9,249 |
$9,257 |
$9,543 |
'15 |
$9,344 |
$9,362 |
$9,448 |
'15 |
$9,149 |
$9,170 |
$9,478 |
'16 |
$8,457 |
$8,481 |
$8,699 |
'16 |
$7,640 |
$7,667 |
$8,460 |
'16 |
$7,974 |
$8,006 |
$8,860 |
'16 |
$7,945 |
$7,979 |
$9,272 |
'16 |
$8,135 |
$8,187 |
$9,176 |
'16 |
$7,301 |
$7,337 |
$8,950 |
'16 |
$7,761 |
$7,812 |
$9,530 |
'16 |
$7,862 |
$7,923 |
$9,566 |
'16 |
$7,831 |
$7,894 |
$9,720 |
'16 |
$8,229 |
$8,301 |
$9,848 |
'16 |
$8,671 |
$8,756 |
$9,610 |
'16 |
$8,966 |
$9,058 |
$9,704 |
'17 |
$8,985 |
$9,085 |
$10,065 |
'17 |
$9,029 |
$9,137 |
$10,177 |
'17 |
$8,973 |
$9,078 |
$10,140 |
'17 |
$9,074 |
$9,188 |
$10,246 |
'17 |
$9,281 |
$9,401 |
$10,554 |
'17 |
$9,536 |
$9,664 |
$10,666 |
'17 |
$9,571 |
$9,708 |
$10,882 |
'17 |
$9,536 |
$9,678 |
$10,876 |
'17 |
$9,946 |
$10,096 |
$11,090 |
'17 |
$10,509 |
$10,672 |
$11,601 |
'17 |
$10,672 |
$10,840 |
$11,948 |
'17 |
$10,832 |
$11,008 |
$12,031 |
'18 |
$10,992 |
$11,176 |
$12,582 |
'18 |
$10,580 |
$10,765 |
$12,393 |
'18 |
$10,279 |
$10,452 |
$12,047 |
'18 |
$10,727 |
$10,910 |
$12,212 |
'18 |
$10,556 |
$10,747 |
$12,092 |
'18 |
$10,512 |
$10,704 |
$11,787 |
'18 |
$10,680 |
$10,881 |
$11,834 |
'18 |
$10,620 |
$10,825 |
$11,861 |
'18 |
$11,216 |
$11,435 |
$12,221 |
'18 |
$10,215 |
$10,421 |
$11,188 |
'18 |
$10,335 |
$10,547 |
$11,232 |
'18 |
$9,312 |
$9,510 |
$10,481 |
'19 |
$9,823 |
$10,036 |
$11,121 |
'19 |
$10,057 |
$10,278 |
$11,117 |
'19 |
$10,083 |
$10,303 |
$11,180 |
'19 |
$10,307 |
$10,537 |
$11,335 |
'19 |
$9,649 |
$9,875 |
$10,886 |
'19 |
$9,954 |
$10,191 |
$11,294 |
'19 |
$10,066 |
$10,308 |
$11,309 |
'19 |
$9,750 |
$9,990 |
$11,195 |
'19 |
$10,336 |
$10,592 |
$11,647 |
'19 |
$10,863 |
$11,133 |
$12,212 |
'19 |
$11,072 |
$11,358 |
$12,281 |
'19 |
$11,249 |
$11,540 |
$12,537 |
'20 |
$11,080 |
$11,372 |
$12,367 |
'20 |
$10,022 |
$10,295 |
$11,236 |
'20 |
$9,333 |
$9,587 |
$10,433 |
'20 |
$9,761 |
$10,025 |
$10,995 |
'20 |
$10,409 |
$10,697 |
$11,646 |
'20 |
$10,424 |
$10,715 |
$11,644 |
'20 |
$10,052 |
$10,332 |
$11,459 |
'20 |
$10,845 |
$11,154 |
$12,332 |
'20 |
$10,900 |
$11,214 |
$12,452 |
'20 |
$10,628 |
$10,930 |
$12,253 |
'20 |
$11,935 |
$12,271 |
$13,784 |
'20 |
$12,315 |
$12,663 |
$14,353 |
'21 |
$12,357 |
$12,717 |
$14,209 |
'21 |
$12,754 |
$13,136 |
$14,425 |
'21 |
$13,349 |
$13,766 |
$14,578 |
'21 |
$13,008 |
$13,409 |
$14,356 |
'21 |
$13,373 |
$13,796 |
$14,679 |
'21 |
$13,365 |
$13,795 |
$14,537 |
'21 |
$13,042 |
$13,468 |
$14,353 |
'21 |
$13,452 |
$13,898 |
$14,793 |
'21 |
$14,033 |
$14,497 |
$15,200 |
'21 |
$13,856 |
$14,326 |
$14,689 |
'21 |
$13,446 |
$13,915 |
$14,327 |
'21 |
$13,903 |
$14,386 |
$14,598 |
'22 |
$13,204 |
$13,669 |
$13,858 |
'22 |
$13,050 |
$13,513 |
$13,703 |
'22 |
$13,654 |
$14,144 |
$13,634 |
'22 |
$13,336 |
$13,814 |
$12,434 |
'22 |
$13,462 |
$13,954 |
$12,637 |
'22 |
$13,128 |
$13,609 |
$11,640 |
'22 |
$13,679 |
$14,181 |
$12,304 |
'22 |
$13,844 |
$14,365 |
$11,989 |
'22 |
$13,040 |
$13,522 |
$10,747 |
'22 |
$13,803 |
$14,323 |
$11,066 |
'22 |
$14,279 |
$14,844 |
$12,136 |
'22 |
$13,550 |
$14,099 |
$12,169 |
'23 |
$14,248 |
$14,826 |
$12,925 |
'23 |
$14,395 |
$14,990 |
$12,429 |
'23 |
$14,690 |
$15,300 |
$12,922 |
'23 |
$15,140 |
$15,771 |
$12,969 |
'23 |
$15,856 |
$16,527 |
$13,210 |
'23 |
$17,122 |
$17,843 |
$13,751 |
'23 |
$17,413 |
$18,162 |
$14,166 |
'23 |
$17,475 |
$18,240 |
$13,823 |
'23 |
$17,627 |
$18,386 |
$13,533 |
'23 |
$17,179 |
$17,932 |
$12,923 |
'23 |
$18,286 |
$19,127 |
$14,029 |
'23 |
$18,289 |
$19,136 |
$14,641 |
'24 |
$19,864 |
$20,792 |
$15,317 |
'24 |
$20,999 |
$22,002 |
$15,776 |
'24 |
$21,881 |
$22,914 |
$16,177 |
'24 |
$21,856 |
$22,893 |
$15,463 |
'24 |
$22,206 |
$23,277 |
$15,671 |
'24 |
$22,652 |
$23,746 |
$15,559 |
'24 |
$22,503 |
$23,607 |
$16,461 |
'24 |
$21,963 |
$23,043 |
$16,545 |
'24 |
$21,550 |
$22,601 |
$16,450 |
'24 |
$22,153 |
$23,260 |
$15,809 |
'24 |
$22,051 |
$23,169 |
$15,912 |
'24 |
$23,053 |
$24,239 |
$15,858 |
'25 |
$23,157 |
$24,346 |
$16,106 |
'25 |
$22,266 |
$23,427 |
$15,887 |
'25 |
$22,216 |
$23,362 |
$15,911 |
'25 |
$22,337 |
$23,486 |
$16,743 |
'25 |
$23,553 |
$24,785 |
$17,421 |
|
| Average Annual Return [Table Text Block] |
|
|
Fund/Index |
1-Year |
5-Year |
10-Year |
Xtrackers MSCI Japan Hedged Equity ETF - NAV |
6.07% |
17.74% |
8.94% |
MSCI Japan US Dollar Hedged Index |
6.48% |
18.30% |
9.50% |
MSCI Japan Index |
11.17% |
8.39% |
5.71% | Average Annual Total Returns Performance shown is historical. The Fund's past performance is not a good predictor or guarantee of the Fund's future performance. Investment returns and principal value of an investment will fluctuate so that an investor's shares, when redeemed, may be worth more or less than their original cost. Current performance may be lower or higher than the performance data quoted. The performance graph and returns table do not reflect the deduction of taxes that a shareholder would pay on Fund distributions or the sale of Fund shares. Shares are bought and sold at market price (closing price) not net asset value (NAV) and are not individually redeemed from the Fund. To obtain the most recent month-end performance data visit etf.dws.com/en-us/etf-products or call (844) 851-4255. |
| AssetsNet |
|
|
$ 389,909,318
|
| Holdings Count | Holding |
|
|
186
|
| Advisory Fees Paid, Amount |
|
|
$ 1,841,897
|
| InvestmentCompanyPortfolioTurnover |
|
|
17.00%
|
| Additional Fund Statistics [Text Block] |
|
|
Net Assets ($) |
389,909,318 |
Number of Portfolio Holdings |
186 |
Portfolio Turnover Rate (%) |
17 |
Total Net Advisory Fees Paid ($) |
1,841,897 | |
| Holdings [Text Block] |
|
|
Sector |
% of Net Assets |
Industrials |
24% |
Consumer Discretionary |
18% |
Financials |
16% |
Information Technology |
13% |
Communication Services |
8% |
Health Care |
7% |
Consumer Staples |
5% |
Materials |
3% |
Real Estate |
2% |
Utilities |
1% |
Energy |
1% | |
| Largest Holdings [Text Block] |
|
|
Ten Largest Equity Holdings
Holdings |
27.5% of Net Assets |
Toyota Motor Corp. |
4.4% |
Sony Group Corp. |
3.9% |
Mitsubishi UFJ Financial Group, Inc. |
3.9% |
Hitachi Ltd. |
3.1% |
Sumitomo Mitsui Financial Group, Inc. |
2.3% |
Nintendo Co. Ltd. |
2.2% |
Recruit Holdings Co. Ltd. |
2.0% |
Keyence Corp. |
2.0% |
Tokio Marine Holdings, Inc. |
1.9% |
Mitsubishi Heavy Industries Ltd. |
1.8% | |
| Updated Prospectus Phone Number |
|
|
(844) 851-4255
|
| Updated Prospectus Web Address |
|
|
dws.com/en-us/resources/proxy-voting
|
| C000246554 |
|
|
|
| Shareholder Report [Line Items] |
|
|
|
| Fund Name |
|
|
Xtrackers California Municipal Bond ETF
|
| Class Name |
|
|
Xtrackers California Municipal Bond ETF
|
| Trading Symbol |
|
|
CA
|
| Security Exchange Name |
|
|
NASDAQ
|
| Annual or Semi-Annual Statement [Text Block] |
|
|
This annual shareholder report contains important information about the Xtrackers California Municipal Bond ETF (the "Fund") for the period June 1, 2024 to May 31, 2025.
|
| Shareholder Report Annual or Semi-Annual |
|
|
Annual Shareholder Report
|
| Additional Information [Text Block] |
|
|
This annual shareholder report contains important information about the Xtrackers California Municipal Bond ETF (the "Fund") for the period June 1, 2024 to May 31, 2025. You can find additional information about the Fund at dws.com/etfreports. You can also request this information by contacting us at (844) 851‐4255.
|
| Additional Information Phone Number |
|
|
(844) 851‐4255
|
| Additional Information Website |
|
|
dws.com/etfreports
|
| Expenses [Text Block] |
|
|
What were the Fund costs for the last year?(Based on a hypothetical $10,000 investment)
Fund |
Costs of a $10,000 investment |
Costs paid as a percentage of a $10,000 investment |
CA |
$7 |
0.07% | Gross expense ratio as of the latest prospectus: 0.07%. See prospectus for any contractual or voluntary waivers; without a waiver, costs would have been higher. |
| Expenses Paid, Amount |
|
|
$ 7
|
| Expense Ratio, Percent |
|
|
0.07%
|
| Factors Affecting Performance [Text Block] |
|
|
How did the fund perform last year and what affected its performance?The Fund seeks investment results that correspond generally to the performance, before fees and expenses, of the ICE AMT-Free Broad Liquid California Municipal Index (the Underlying Index). The Underlying Index is designed to track the performance of U.S. dollar denominated investment grade tax-exempt debt publicly issued in the U.S. domestic market by the state of California and its political subdivisions. The Fund returned 1.48% for the period ended May 31, 2025. The Fund's underlying index returned 1.73% and the Fund's broad-based index the Bloomberg Municipal Bond Index returned 2.03% during the same period. The majority of sectors contributed positively to performance during the period with the greatest contribution coming from State General Obligation, Prepaid Energy and Water & Sewer. The Institution, State Lease and University Private sectors detracted from performance. |
| Line Graph [Table Text Block] |
|
|
|
Xtrackers California Municipal Bond ETF - NAV |
ICE AMT-Free Broad Liquid California Municipal Index (the Underlying Index) |
Bloomberg Municipal Bond Index |
12/14/23 |
$10,000 |
$10,000 |
$10,000 |
12/31/23 |
$10,133 |
$10,149 |
$10,143 |
1/31/24 |
$10,121 |
$10,134 |
$10,123 |
2/29/24 |
$10,116 |
$10,135 |
$10,124 |
3/31/24 |
$10,101 |
$10,115 |
$10,110 |
4/30/24 |
$9,984 |
$10,006 |
$10,005 |
5/31/24 |
$9,960 |
$9,978 |
$9,978 |
6/30/24 |
$10,103 |
$10,124 |
$10,113 |
7/31/24 |
$10,176 |
$10,211 |
$10,205 |
8/31/24 |
$10,257 |
$10,291 |
$10,286 |
9/30/24 |
$10,357 |
$10,398 |
$10,387 |
10/31/24 |
$10,229 |
$10,263 |
$10,236 |
11/30/24 |
$10,383 |
$10,415 |
$10,413 |
12/31/24 |
$10,278 |
$10,306 |
$10,261 |
1/31/25 |
$10,281 |
$10,300 |
$10,313 |
2/28/25 |
$10,386 |
$10,408 |
$10,415 |
3/31/25 |
$10,209 |
$10,241 |
$10,238 |
4/30/25 |
$10,124 |
$10,162 |
$10,156 |
5/31/25 |
$10,107 |
$10,151 |
$10,162 |
|
| Average Annual Return [Table Text Block] |
|
|
Fund/Index |
1-Year |
Since Inception 12/14/23 |
Xtrackers California Municipal Bond ETF - NAV |
1.48% |
0.73% |
ICE AMT-Free Broad Liquid California Municipal Index |
1.73% |
1.03% |
Bloomberg Municipal Bond Index |
2.03% |
1.11% | Average Annual Total Returns Performance shown is historical. The Fund's past performance is not a good predictor or guarantee of the Fund's future performance. Investment returns and principal value of an investment will fluctuate so that an investor's shares, when redeemed, may be worth more or less than their original cost. Current performance may be lower or higher than the performance data quoted. The performance graph and returns table do not reflect the deduction of taxes that a shareholder would pay on Fund distributions or the sale of Fund shares. Shares are bought and sold at market price (closing price) not net asset value (NAV) and are not individually redeemed from the Fund. To obtain the most recent month-end performance data visit etf.dws.com/en-us/etf-products or call (844) 851-4255. |
| AssetsNet |
|
|
$ 21,835,621
|
| Holdings Count | Holding |
|
|
269
|
| Advisory Fees Paid, Amount |
|
|
$ 15,275
|
| InvestmentCompanyPortfolioTurnover |
|
|
5.00%
|
| Additional Fund Statistics [Text Block] |
|
|
Net Assets ($) |
21,835,621 |
Number of Portfolio Holdings |
269 |
Portfolio Turnover Rate (%) |
5 |
Total Net Advisory Fees Paid ($) |
15,275 |
Modified duration to worst |
6.1 years | Modified duration to worst is the measure of sensitivity of the prices of bonds held by the Fund to a change in interest rates, computed using each bond's nearest call or maturity date. |
| Holdings [Text Block] |
|
|
Sector |
% of Net Assets |
General |
44% |
Education |
25% |
Health Care |
9% |
Water |
7% |
Airport |
4% |
Power |
4% |
Transportation |
3% |
Utilities |
1% |
Tax |
1% |
Communication Services |
0% | |
| Largest Holdings [Text Block] |
|
|
Credit Rating |
% of Net Assets |
AAA |
15% |
AA |
73% |
A |
9% |
NR |
0% | |
| Material Fund Change Expenses [Text Block] |
|
|
Effective August 13, 2024, the Fund’s unitary advisory fee was reduced from 0.15% to 0.07%. At the same time, the Board terminated the contractual expense limitation that capped the fund’s operating expenses at the same level because of the redundancy.
|
| Updated Prospectus Phone Number |
|
|
(844) 851-4255
|
| Updated Prospectus Web Address |
|
|
dws.com/en-us/resources/proxy-voting
|
| C000125719 |
|
|
|
| Shareholder Report [Line Items] |
|
|
|
| Fund Name |
|
|
Xtrackers Municipal Infrastructure Revenue Bond ETF
|
| Class Name |
|
|
Xtrackers Municipal Infrastructure Revenue Bond ETF
|
| Trading Symbol |
|
|
RVNU
|
| Security Exchange Name |
|
|
NYSEArca
|
| Annual or Semi-Annual Statement [Text Block] |
|
|
This annual shareholder report contains important information about the Xtrackers Municipal Infrastructure Revenue Bond ETF (the "Fund") for the period June 1, 2024 to May 31, 2025.
|
| Shareholder Report Annual or Semi-Annual |
|
|
Annual Shareholder Report
|
| Additional Information [Text Block] |
|
|
This annual shareholder report contains important information about the Xtrackers Municipal Infrastructure Revenue Bond ETF (the "Fund") for the period June 1, 2024 to May 31, 2025. You can find additional information about the Fund at dws.com/etfreports. You can also request this information by contacting us at (844) 851‐4255.
|
| Additional Information Phone Number |
|
|
(844) 851‐4255
|
| Additional Information Website |
|
|
dws.com/etfreports
|
| Expenses [Text Block] |
|
|
What were the Fund costs for the last year?(Based on a hypothetical $10,000 investment)
Fund |
Costs of a $10,000 investment |
Costs paid as a percentage of a $10,000 investment |
RVNU |
$15 |
0.15% | Gross expense ratio as of the latest prospectus: 0.15%. See prospectus for any contractual or voluntary waivers; without a waiver, costs would have been higher. |
| Expenses Paid, Amount |
|
|
$ 15
|
| Expense Ratio, Percent |
|
|
0.15%
|
| Factors Affecting Performance [Text Block] |
|
|
How did the fund perform last year and what affected its performance?The Fund seeks investment results that correspond generally to the performance, before fees and expenses, of the Solactive Municipal Infrastructure Revenue Bond Index (the Underlying Index). The underlying index is designed to track the performance of the segment of the U.S. long term tax-exempt bond market, consisting of infrastructure revenue bonds. The Fund returned -0.90% for the period ended May 31, 2025. The Fund's underlying index returned -0.58% and the Fund's broad-based index the Bloomberg Municipal Bond Index returned 2.03% during the same period. The majority of sectors contributed positively to performance during the period with the greatest contribution coming from Transportation Services, Toll Facilities and Airlines. The Water & Sewer, Public Power and Cities, Counties & Authorities sectors detracted from performance. |
| Line Graph [Table Text Block] |
|
|
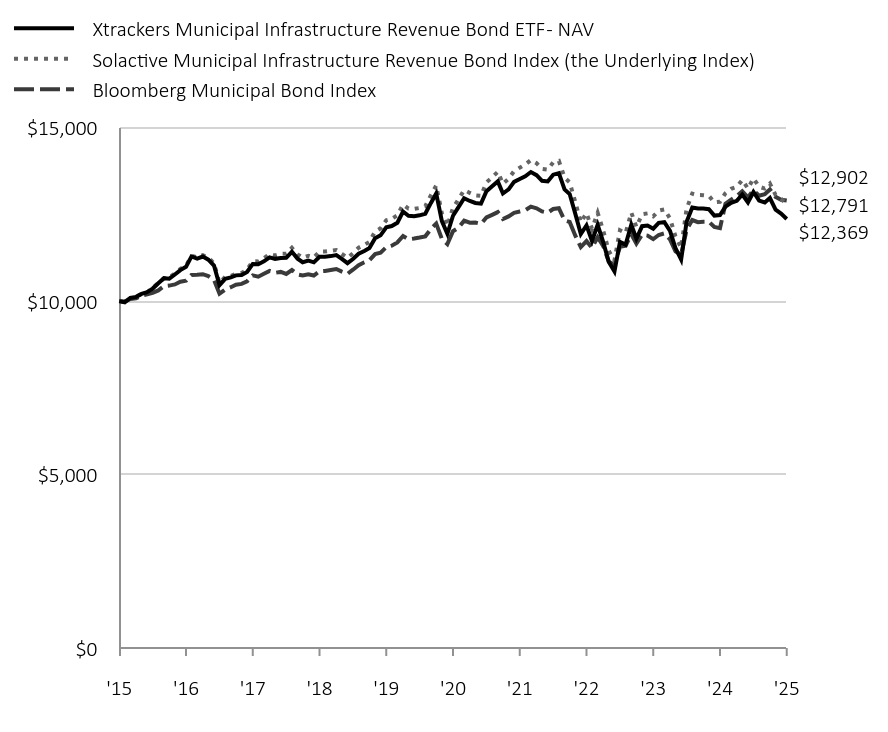
|
Xtrackers Municipal Infrastructure Revenue Bond ETF - NAV |
Solactive Municipal Infrastructure Revenue Bond Index (the Underlying Index) |
Bloomberg Municipal Bond Index |
'15 |
$10,000 |
$10,000 |
$10,000 |
'15 |
$9,967 |
$9,966 |
$9,991 |
'15 |
$10,092 |
$10,090 |
$10,063 |
'15 |
$10,123 |
$10,128 |
$10,083 |
'15 |
$10,209 |
$10,204 |
$10,155 |
'15 |
$10,256 |
$10,255 |
$10,196 |
'15 |
$10,362 |
$10,375 |
$10,236 |
'15 |
$10,517 |
$10,526 |
$10,309 |
'16 |
$10,662 |
$10,656 |
$10,432 |
'16 |
$10,649 |
$10,679 |
$10,448 |
'16 |
$10,768 |
$10,800 |
$10,481 |
'16 |
$10,895 |
$10,928 |
$10,558 |
'16 |
$10,989 |
$11,025 |
$10,587 |
'16 |
$11,289 |
$11,305 |
$10,755 |
'16 |
$11,226 |
$11,263 |
$10,762 |
'16 |
$11,286 |
$11,324 |
$10,776 |
'16 |
$11,194 |
$11,252 |
$10,723 |
'16 |
$11,025 |
$11,088 |
$10,610 |
'16 |
$10,461 |
$10,525 |
$10,215 |
'16 |
$10,643 |
$10,699 |
$10,334 |
'17 |
$10,684 |
$10,727 |
$10,402 |
'17 |
$10,743 |
$10,790 |
$10,474 |
'17 |
$10,754 |
$10,814 |
$10,497 |
'17 |
$10,841 |
$10,911 |
$10,573 |
'17 |
$11,072 |
$11,148 |
$10,741 |
'17 |
$11,065 |
$11,145 |
$10,703 |
'17 |
$11,146 |
$11,238 |
$10,789 |
'17 |
$11,261 |
$11,359 |
$10,871 |
'17 |
$11,219 |
$11,318 |
$10,816 |
'17 |
$11,246 |
$11,363 |
$10,842 |
'17 |
$11,249 |
$11,365 |
$10,785 |
'17 |
$11,421 |
$11,538 |
$10,898 |
'18 |
$11,225 |
$11,347 |
$10,769 |
'18 |
$11,122 |
$11,252 |
$10,737 |
'18 |
$11,166 |
$11,307 |
$10,776 |
'18 |
$11,118 |
$11,260 |
$10,738 |
'18 |
$11,280 |
$11,428 |
$10,861 |
'18 |
$11,282 |
$11,429 |
$10,870 |
'18 |
$11,298 |
$11,449 |
$10,897 |
'18 |
$11,329 |
$11,473 |
$10,925 |
'18 |
$11,218 |
$11,365 |
$10,853 |
'18 |
$11,094 |
$11,245 |
$10,787 |
'18 |
$11,215 |
$11,378 |
$10,906 |
'18 |
$11,367 |
$11,542 |
$11,037 |
'19 |
$11,446 |
$11,624 |
$11,121 |
'19 |
$11,529 |
$11,708 |
$11,180 |
'19 |
$11,815 |
$12,006 |
$11,357 |
'19 |
$11,898 |
$12,099 |
$11,399 |
'19 |
$12,129 |
$12,333 |
$11,556 |
'19 |
$12,165 |
$12,373 |
$11,599 |
'19 |
$12,261 |
$12,474 |
$11,693 |
'19 |
$12,583 |
$12,783 |
$11,877 |
'19 |
$12,461 |
$12,668 |
$11,782 |
'19 |
$12,449 |
$12,659 |
$11,803 |
'19 |
$12,474 |
$12,686 |
$11,833 |
'19 |
$12,520 |
$12,736 |
$11,868 |
'20 |
$12,831 |
$13,054 |
$12,082 |
'20 |
$13,105 |
$13,332 |
$12,237 |
'20 |
$12,307 |
$12,527 |
$11,793 |
'20 |
$11,942 |
$12,164 |
$11,645 |
'20 |
$12,462 |
$12,690 |
$12,016 |
'20 |
$12,711 |
$12,934 |
$12,115 |
'20 |
$12,967 |
$13,203 |
$12,319 |
'20 |
$12,888 |
$13,119 |
$12,261 |
'20 |
$12,830 |
$13,047 |
$12,264 |
'20 |
$12,810 |
$13,034 |
$12,227 |
'20 |
$13,171 |
$13,424 |
$12,411 |
'20 |
$13,314 |
$13,570 |
$12,488 |
'21 |
$13,452 |
$13,729 |
$12,567 |
'21 |
$13,102 |
$13,384 |
$12,367 |
'21 |
$13,220 |
$13,528 |
$12,443 |
'21 |
$13,437 |
$13,750 |
$12,548 |
'21 |
$13,519 |
$13,848 |
$12,585 |
'21 |
$13,596 |
$13,938 |
$12,619 |
'21 |
$13,722 |
$14,067 |
$12,725 |
'21 |
$13,632 |
$13,976 |
$12,678 |
'21 |
$13,468 |
$13,812 |
$12,586 |
'21 |
$13,452 |
$13,792 |
$12,550 |
'21 |
$13,646 |
$14,002 |
$12,656 |
'21 |
$13,688 |
$14,041 |
$12,677 |
'22 |
$13,222 |
$13,562 |
$12,329 |
'22 |
$13,088 |
$13,424 |
$12,285 |
'22 |
$12,516 |
$12,852 |
$11,887 |
'22 |
$11,934 |
$12,271 |
$11,558 |
'22 |
$12,184 |
$12,537 |
$11,730 |
'22 |
$11,733 |
$12,087 |
$11,538 |
'22 |
$12,199 |
$12,547 |
$11,843 |
'22 |
$11,692 |
$12,024 |
$11,583 |
'22 |
$11,126 |
$11,447 |
$11,138 |
'22 |
$10,853 |
$11,175 |
$11,046 |
'22 |
$11,706 |
$12,042 |
$11,563 |
'22 |
$11,628 |
$11,962 |
$11,596 |
'23 |
$12,202 |
$12,554 |
$11,929 |
'23 |
$11,799 |
$12,140 |
$11,659 |
'23 |
$12,162 |
$12,506 |
$11,917 |
'23 |
$12,179 |
$12,530 |
$11,891 |
'23 |
$12,088 |
$12,443 |
$11,788 |
'23 |
$12,256 |
$12,611 |
$11,906 |
'23 |
$12,277 |
$12,645 |
$11,953 |
'23 |
$12,027 |
$12,383 |
$11,781 |
'23 |
$11,529 |
$11,865 |
$11,436 |
'23 |
$11,196 |
$11,537 |
$11,338 |
'23 |
$12,288 |
$12,662 |
$12,058 |
'23 |
$12,697 |
$13,101 |
$12,338 |
'24 |
$12,669 |
$13,057 |
$12,275 |
'24 |
$12,667 |
$13,055 |
$12,291 |
'24 |
$12,652 |
$13,036 |
$12,291 |
'24 |
$12,466 |
$12,848 |
$12,138 |
'24 |
$12,481 |
$12,865 |
$12,103 |
'24 |
$12,724 |
$13,114 |
$12,810 |
'24 |
$12,836 |
$13,240 |
$12,923 |
'24 |
$12,891 |
$13,296 |
$13,027 |
'24 |
$13,075 |
$13,494 |
$13,167 |
'24 |
$12,848 |
$13,244 |
$12,994 |
'24 |
$13,147 |
$13,541 |
$13,197 |
'24 |
$12,897 |
$13,299 |
$13,037 |
'25 |
$12,843 |
$13,245 |
$13,082 |
'25 |
$12,973 |
$13,390 |
$13,219 |
'25 |
$12,637 |
$13,059 |
$13,007 |
'25 |
$12,524 |
$12,950 |
$12,924 |
'25 |
$12,369 |
$12,791 |
$12,902 |
|
| Average Annual Return [Table Text Block] |
|
|
Fund/Index |
1-Year |
5-Year |
10-Year |
Xtrackers Municipal Infrastructure Revenue Bond ETF - NAV |
-0.90% |
-0.15% |
2.15% |
Solactive Municipal Infrastructure Revenue Bond Index |
-0.58% |
0.16% |
2.49% |
Bloomberg Municipal Bond Index |
2.03% |
0.55% |
2.13% | |
| AssetsNet |
|
|
$ 130,943,119
|
| Holdings Count | Holding |
|
|
312
|
| Advisory Fees Paid, Amount |
|
|
$ 204,240
|
| InvestmentCompanyPortfolioTurnover |
|
|
18.00%
|
| Additional Fund Statistics [Text Block] |
|
|
Net Assets ($) |
130,943,119 |
Number of Portfolio Holdings |
312 |
Portfolio Turnover Rate (%) |
18 |
Total Net Advisory Fees Paid ($) |
204,240 |
Modified duration to worst |
9.6 years | Modified duration to worst is the measure of sensitivity of the prices of bonds held by the Fund to a change in interest rates, computed using each bond's nearest call or maturity date. |
| Holdings [Text Block] |
|
|
Sector |
% of Net Assets |
Airport |
32% |
Water & Sewer |
19% |
Public Power |
12% |
Cities, Counties, & Authorities |
11% |
Toll Facilities |
11% |
Mass Transit |
5% |
Sales and Special Tax |
3% |
Seaport |
3% |
States & US Territories |
2% |
Other |
2% | Top Five State Allocations
Holdings |
% of Net Assets |
New York |
25% |
California |
15% |
Florida |
9% |
Texas |
9% |
Illinois |
6% | |
| Largest Holdings [Text Block] |
|
|
Credit Rating |
% of Net Assets |
AAA |
11% |
AA |
64% |
A |
23% |
BBB |
2% | |
| Material Fund Change [Text Block] |
|
|
|
| Updated Prospectus Phone Number |
|
|
(844) 851-4255
|
| Updated Prospectus Web Address |
|
|
dws.com/en-us/resources/proxy-voting
|
| C000157941 |
|
|
|
| Shareholder Report [Line Items] |
|
|
|
| Fund Name |
|
|
Xtrackers MSCI EAFE High Dividend Yield Equity ETF
|
| Class Name |
|
|
Xtrackers MSCI EAFE High Dividend Yield Equity ETF
|
| Trading Symbol |
|
|
HDEF
|
| Security Exchange Name |
|
|
NYSEArca
|
| Annual or Semi-Annual Statement [Text Block] |
|
|
This annual shareholder report contains important information about the Xtrackers MSCI EAFE High Dividend Yield Equity ETF (the "Fund") for the period June 1, 2024 to May 31, 2025.
|
| Shareholder Report Annual or Semi-Annual |
|
|
Annual Shareholder Report
|
| Additional Information [Text Block] |
|
|
This annual shareholder report contains important information about the Xtrackers MSCI EAFE High Dividend Yield Equity ETF (the "Fund") for the period June 1, 2024 to May 31, 2025. You can find additional information about the Fund at dws.com/etfreports. You can also request this information by contacting us at (844) 851‐4255.
|
| Additional Information Phone Number |
|
|
(844) 851‐4255
|
| Additional Information Website |
|
|
dws.com/etfreports
|
| Expenses [Text Block] |
|
|
What were the Fund costs for the last year?(Based on a hypothetical $10,000 investment)
Fund |
Costs of a $10,000 investment |
Costs paid as a percentage of a $10,000 investment |
HDEF |
$10 |
0.09% | Gross expense ratio as of the latest prospectus: 0.09%. See prospectus for any contractual or voluntary waivers; without a waiver, costs would have been higher. |
| Expenses Paid, Amount |
|
|
$ 10
|
| Expense Ratio, Percent |
|
|
0.09%
|
| Factors Affecting Performance [Text Block] |
|
|
How did the fund perform last year and what affected its performance?The Fund seeks investment results that correspond generally to the performance, before fees and expenses, of the MSCI EAFE High Dividend Yield Index (the Underlying Index). The Underlying Index is designed to reflect the performance of equities (excluding real estate investment trusts (“REITs”)) in developed markets in its parent index, the MSCI EAFE Index, with higher dividend income and quality characteristics than average dividend yields of equities in the parent index, where such higher dividend income and quality characteristics are both sustainable and persistent. The Fund returned 17.13% for the period ended May 31, 2025. The Fund's underlying index returned 16.95% and the Fund's broad-based index the MSCI EAFE Index returned 13.33% during the same period. The majority of sectors contributed positively to performance during the period with the greatest contribution coming from Financials, Consumer Staples and Health Care. The Materials, Energy and Consumer Discretionary sectors detracted from the performance. From a geographical perspective, the majority of countries contributed positively to performance during the period with the greatest contribution coming from Switzerland, the United Kingdom and Germany while Australia, Ireland and Italy contributed negatively to performance. |
| Line Graph [Table Text Block] |
|
|
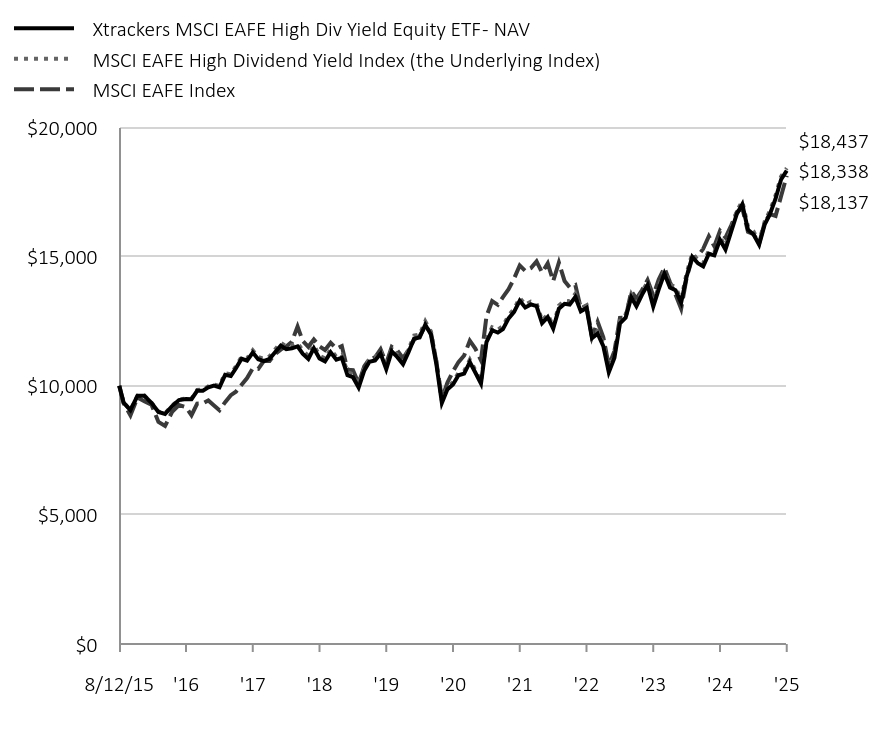
|
Xtrackers MSCI EAFE High Div Yield Equity ETF - NAV |
MSCI EAFE High Dividend Yield Index (the Underlying Index) |
MSCI EAFE Index |
8/12/15 |
$10,000 |
$10,000 |
$10,000 |
8/31/15 |
$9,352 |
$9,353 |
$9,330 |
9/30/15 |
$9,059 |
$9,060 |
$8,856 |
10/31/15 |
$9,612 |
$9,620 |
$9,548 |
11/30/15 |
$9,612 |
$9,623 |
$9,400 |
12/31/15 |
$9,344 |
$9,355 |
$9,273 |
1/31/16 |
$8,986 |
$8,998 |
$8,603 |
2/29/16 |
$8,912 |
$8,933 |
$8,445 |
3/31/16 |
$9,209 |
$9,232 |
$8,995 |
4/30/16 |
$9,447 |
$9,469 |
$9,255 |
5/31/16 |
$9,492 |
$9,513 |
$9,171 |
6/30/16 |
$9,484 |
$9,509 |
$8,863 |
7/31/16 |
$9,808 |
$9,841 |
$9,312 |
8/31/16 |
$9,813 |
$9,848 |
$9,319 |
9/30/16 |
$9,941 |
$9,980 |
$9,433 |
10/31/16 |
$10,008 |
$10,051 |
$9,240 |
11/30/16 |
$9,941 |
$10,002 |
$9,056 |
12/31/16 |
$10,427 |
$10,490 |
$9,366 |
1/31/17 |
$10,377 |
$10,447 |
$9,638 |
2/28/17 |
$10,682 |
$10,761 |
$9,775 |
3/31/17 |
$11,049 |
$11,130 |
$10,045 |
4/30/17 |
$10,980 |
$11,062 |
$10,300 |
5/31/17 |
$11,290 |
$11,377 |
$10,678 |
6/30/17 |
$11,032 |
$11,119 |
$10,659 |
7/31/17 |
$10,955 |
$11,048 |
$10,967 |
8/31/17 |
$11,045 |
$11,144 |
$10,963 |
9/30/17 |
$11,304 |
$11,409 |
$11,235 |
10/31/17 |
$11,556 |
$11,668 |
$11,406 |
11/30/17 |
$11,417 |
$11,534 |
$11,526 |
12/31/17 |
$11,453 |
$11,573 |
$11,711 |
1/31/18 |
$11,530 |
$11,655 |
$12,298 |
2/28/18 |
$11,244 |
$11,368 |
$11,743 |
3/31/18 |
$11,043 |
$11,164 |
$11,512 |
4/30/18 |
$11,459 |
$11,579 |
$11,795 |
5/31/18 |
$11,061 |
$11,172 |
$11,529 |
6/30/18 |
$10,950 |
$11,059 |
$11,389 |
7/31/18 |
$11,299 |
$11,414 |
$11,669 |
8/31/18 |
$11,012 |
$11,125 |
$11,444 |
9/30/18 |
$11,088 |
$11,203 |
$11,543 |
10/31/18 |
$10,410 |
$10,521 |
$10,624 |
11/30/18 |
$10,334 |
$10,447 |
$10,611 |
12/31/18 |
$9,934 |
$10,042 |
$10,096 |
1/31/19 |
$10,600 |
$10,717 |
$10,759 |
2/28/19 |
$10,936 |
$11,058 |
$11,033 |
3/31/19 |
$10,986 |
$11,107 |
$11,103 |
4/30/19 |
$11,249 |
$11,365 |
$11,415 |
5/31/19 |
$10,646 |
$10,741 |
$10,867 |
6/30/19 |
$11,334 |
$11,436 |
$11,512 |
7/31/19 |
$11,112 |
$11,215 |
$11,365 |
8/31/19 |
$10,841 |
$10,945 |
$11,071 |
9/30/19 |
$11,300 |
$11,408 |
$11,388 |
10/31/19 |
$11,830 |
$11,946 |
$11,797 |
11/30/19 |
$11,869 |
$11,989 |
$11,930 |
12/31/19 |
$12,372 |
$12,498 |
$12,318 |
1/31/20 |
$11,985 |
$12,107 |
$12,061 |
2/29/20 |
$10,874 |
$10,986 |
$10,971 |
3/31/20 |
$9,338 |
$9,437 |
$9,506 |
4/30/20 |
$9,857 |
$9,954 |
$10,121 |
5/31/20 |
$10,049 |
$10,143 |
$10,561 |
6/30/20 |
$10,410 |
$10,502 |
$10,921 |
7/31/20 |
$10,476 |
$10,566 |
$11,175 |
8/31/20 |
$10,917 |
$11,013 |
$11,750 |
9/30/20 |
$10,517 |
$10,607 |
$11,445 |
10/31/20 |
$10,089 |
$10,175 |
$10,988 |
11/30/20 |
$11,697 |
$11,803 |
$12,691 |
12/31/20 |
$12,153 |
$12,265 |
$13,281 |
1/31/21 |
$12,064 |
$12,175 |
$13,139 |
2/28/21 |
$12,199 |
$12,312 |
$13,434 |
3/31/21 |
$12,613 |
$12,727 |
$13,743 |
4/30/21 |
$12,865 |
$12,972 |
$14,157 |
5/31/21 |
$13,302 |
$13,410 |
$14,664 |
6/30/21 |
$13,035 |
$13,143 |
$14,454 |
7/31/21 |
$13,156 |
$13,265 |
$14,563 |
8/31/21 |
$13,086 |
$13,194 |
$14,819 |
9/30/21 |
$12,429 |
$12,531 |
$14,389 |
10/31/21 |
$12,666 |
$12,769 |
$14,743 |
11/30/21 |
$12,215 |
$12,322 |
$14,057 |
12/31/21 |
$12,990 |
$13,106 |
$14,777 |
1/31/22 |
$13,179 |
$13,301 |
$14,063 |
2/28/22 |
$13,148 |
$13,275 |
$13,814 |
3/31/22 |
$13,444 |
$13,563 |
$13,903 |
4/30/22 |
$12,889 |
$13,004 |
$13,003 |
5/31/22 |
$13,016 |
$13,120 |
$13,101 |
6/30/22 |
$11,846 |
$11,943 |
$11,885 |
7/31/22 |
$12,020 |
$12,117 |
$12,478 |
8/31/22 |
$11,539 |
$11,638 |
$11,885 |
9/30/22 |
$10,530 |
$10,622 |
$10,773 |
10/31/22 |
$11,093 |
$11,192 |
$11,353 |
11/30/22 |
$12,418 |
$12,529 |
$12,631 |
12/31/22 |
$12,641 |
$12,759 |
$12,641 |
1/31/23 |
$13,431 |
$13,556 |
$13,665 |
2/28/23 |
$13,085 |
$13,209 |
$13,380 |
3/31/23 |
$13,537 |
$13,659 |
$13,711 |
4/30/23 |
$13,903 |
$14,018 |
$14,099 |
5/31/23 |
$13,070 |
$13,168 |
$13,502 |
6/30/23 |
$13,740 |
$13,845 |
$14,116 |
7/31/23 |
$14,349 |
$14,462 |
$14,573 |
8/31/23 |
$13,810 |
$13,923 |
$14,015 |
9/30/23 |
$13,705 |
$13,824 |
$13,536 |
10/31/23 |
$13,227 |
$13,342 |
$12,987 |
11/30/23 |
$14,229 |
$14,352 |
$14,193 |
12/31/23 |
$14,998 |
$15,128 |
$14,947 |
1/31/24 |
$14,750 |
$14,878 |
$15,033 |
2/29/24 |
$14,629 |
$14,756 |
$15,308 |
3/31/24 |
$15,117 |
$15,239 |
$15,794 |
4/30/24 |
$15,057 |
$15,170 |
$15,407 |
5/31/24 |
$15,656 |
$15,765 |
$16,003 |
6/30/24 |
$15,282 |
$15,385 |
$15,745 |
7/31/24 |
$15,977 |
$16,088 |
$16,207 |
8/31/24 |
$16,657 |
$16,771 |
$16,734 |
9/30/24 |
$17,031 |
$17,149 |
$16,888 |
10/31/24 |
$16,049 |
$16,164 |
$15,970 |
11/30/24 |
$15,871 |
$15,988 |
$15,879 |
12/31/24 |
$15,466 |
$15,583 |
$15,518 |
1/31/25 |
$16,258 |
$16,380 |
$16,334 |
2/28/25 |
$16,649 |
$16,776 |
$16,651 |
3/31/25 |
$17,250 |
$17,375 |
$16,583 |
4/30/25 |
$17,994 |
$18,108 |
$17,343 |
5/31/25 |
$18,338 |
$18,437 |
$18,137 |
|
| Average Annual Return [Table Text Block] |
|
|
Fund/Index |
1-Year |
5-Year |
Since Inception 8/12/15 |
Xtrackers MSCI EAFE High Div Yield Equity ETF - NAV |
17.13% |
12.78% |
6.38% |
MSCI EAFE High Dividend Yield Index |
16.95% |
12.70% |
6.43% |
MSCI EAFE Index |
13.33% |
11.42% |
6.26% | |
| AssetsNet |
|
|
$ 2,011,112,677
|
| Holdings Count | Holding |
|
|
113
|
| Advisory Fees Paid, Amount |
|
|
$ 1,536,952
|
| InvestmentCompanyPortfolioTurnover |
|
|
22.00%
|
| Additional Fund Statistics [Text Block] |
|
|
Net Assets ($) |
2,011,112,677 |
Number of Portfolio Holdings |
113 |
Portfolio Turnover Rate (%) |
22 |
Total Net Advisory Fees Paid ($) |
1,536,952 | |
| Holdings [Text Block] |
|
|
Sector |
% of Net Assets |
Financials |
27% |
Consumer Staples |
15% |
Health Care |
14% |
Energy |
12% |
Industrials |
10% |
Utilities |
8% |
Consumer Discretionary |
6% |
Communication Services |
4% |
Materials |
3% |
Real Estate |
1% | Geographical Diversification
Country |
% of Net Assets |
Switzerland |
20% |
United Kingdom |
20% |
France |
15% |
Germany |
7% |
Japan |
7% |
Singapore |
5% |
Australia |
4% |
Spain |
4% |
Netherlands |
3% |
Italy |
3% |
Hong Kong |
2% |
Other |
7% | |
| Largest Holdings [Text Block] |
|
|
Ten Largest Equity Holdings
Holdings |
42.1% of Net Assets |
Roche Holding AG (Switzerland) |
5.1% |
Novartis AG (Switzerland) |
5.1% |
Unilever PLC (United Kingdom) |
5.0% |
Shell PLC (United Kingdom) |
4.9% |
Allianz SE (Germany) |
4.9% |
TotalEnergies SE (France) |
3.9% |
Sanofi SA (France) |
3.6% |
Iberdrola SA (Spain) |
3.4% |
Zurich Insurance Group AG (Switzerland) |
3.3% |
British American Tobacco PLC (United Kingdom) |
2.9% | |
| Material Fund Change [Text Block] |
|
|
This is a summary of certain changes of the Fund since June 1, 2024. For more information, review the Fund's current prospectus at dws.com/etfreports, or by calling (844) 851-4255. Effective August 13, 2024, the Fund’s unitary advisory fee was reduced from 0.20% to 0.09%. At the same time, the Board terminated the contractual expense limitation that capped the fund’s operating expenses at the same level because of the redundancy. |
| Material Fund Change Expenses [Text Block] |
|
|
Effective August 13, 2024, the Fund’s unitary advisory fee was reduced from 0.20% to 0.09%. At the same time, the Board terminated the contractual expense limitation that capped the fund’s operating expenses at the same level because of the redundancy.
|
| Updated Prospectus Phone Number |
|
|
(844) 851-4255
|
| Updated Prospectus Web Address |
|
|
dws.com/en-us/resources/proxy-voting
|
| C000251233 |
|
|
|
| Shareholder Report [Line Items] |
|
|
|
| Fund Name |
|
|
Xtrackers US 0-1 Year Treasury ETF
|
| Class Name |
|
|
Xtrackers US 0-1 Year Treasury ETF
|
| Trading Symbol |
|
|
TRSY
|
| Security Exchange Name |
|
|
CboeBZX
|
| Annual or Semi-Annual Statement [Text Block] |
|
|
This annual shareholder report contains important information about the Xtrackers US 0-1 Year Treasury ETF (the "Fund") for the period October 9, 2024 (commencement of operations) to May 31, 2025.
|
| Shareholder Report Annual or Semi-Annual |
|
|
Annual Shareholder Report
|
| Additional Information [Text Block] |
|
|
This annual shareholder report contains important information about the Xtrackers US 0-1 Year Treasury ETF (the "Fund") for the period October 9, 2024 (commencement of operations) to May 31, 2025. You can find additional information about the Fund at dws.com/etfreports. You can also request this information by contacting us at (844) 851‐4255.
|
| Additional Information Phone Number |
|
|
(844) 851‐4255
|
| Additional Information Website |
|
|
dws.com/etfreports
|
| Expenses [Text Block] |
|
|
What were the Fund costs for the reporting period?(Based on a hypothetical $10,000 investment)
Fund |
Costs of a $10,000 investment |
Costs paid as a percentage of a $10,000 investment |
TRSY |
$4Footnote Reference(a) |
0.06%Footnote Reference(b) | (a) Based on the period October 9, 2024 (commencement of operations) through May 31, 2025. Expenses would have been higher if the Fund had been in existence for the full reporting period. (b) Annualized. Gross expense ratio as of the latest prospectus: 0.06%. See prospectus for any contractual or voluntary waivers; without a waiver, costs would have been higher.
| Footnote |
Description |
Footnote(a) |
Based on the period October 9, 2024 (commencement of operations) through May 31, 2025. Expenses would have been higher if the Fund had been in existence for the full reporting period. |
Footnote(b) |
Annualized. | |
| Expenses Paid, Amount |
[3] |
|
$ 4
|
| Expense Ratio, Percent |
[4] |
|
0.06%
|
| Factors Affecting Performance [Text Block] |
|
|
How did the fund perform last year and what affected its performance?The fund seeks investment results that correspond generally to the performance, before fees and expenses, of the ICE U.S. Treasury Short Bond Index (the Underlying Index). The Underlying Index is designed to track the performance of certain U.S. Treasury securities that have a remaining maturity between one month and one year. The Fund returned 2.78% for the period ended May 31, 2025. The Fund's underlying index returned 2.82% and the Fund's broad-based index the ICE BofA US Treasury Index returned 0.39% during the same period. Both U.S. Treasury Bills and U.S. Treasury Notes were positive contributors to performance. |
| Line Graph [Table Text Block] |
|
|
|
Xtrackers US 0-1 Year Treasury ETF - NAV |
ICE U.S. Treasury Short Bond Index (the Underlying Index) |
ICE BofA US Treasury Index |
10/9/24 |
$10,000 |
$10,000 |
$10,000 |
10/24 |
$10,027 |
$10,028 |
$9,885 |
11/24 |
$10,064 |
$10,065 |
$9,965 |
12/24 |
$10,106 |
$10,108 |
$9,798 |
1/25 |
$10,142 |
$10,144 |
$9,852 |
2/25 |
$10,176 |
$10,178 |
$10,073 |
3/25 |
$10,210 |
$10,214 |
$10,092 |
4/25 |
$10,246 |
$10,250 |
$10,148 |
5/25 |
$10,278 |
$10,282 |
$10,039 |
|
| Average Annual Return [Table Text Block] |
|
|
Fund/Index |
Since Inception 10/9/24 |
Xtrackers US 0-1 Year Treasury ETF - NAV |
2.78% |
ICE U.S. Treasury Short Bond Index |
2.82% |
ICE BofA US Treasury Index |
0.39% | Average Annual Total Returns Performance shown is historical. The Fund's past performance is not a good predictor or guarantee of the Fund's future performance. Investment returns and principal value of an investment will fluctuate so that an investor's shares, when redeemed, may be worth more or less than their original cost. Current performance may be lower or higher than the performance data quoted. The performance graph and returns table do not reflect the deduction of taxes that a shareholder would pay on Fund distributions or the sale of Fund shares. Shares are bought and sold at market price (closing price) not net asset value (NAV) and are not individually redeemed from the Fund. To obtain the most recent month-end performance data visit etf.dws.com/en-us/etf-products or call (844) 851-4255. |
| AssetsNet |
|
|
$ 27,143,854
|
| Holdings Count | Holding |
|
|
92
|
| Advisory Fees Paid, Amount |
|
|
$ 2,852
|
| InvestmentCompanyPortfolioTurnover |
|
|
0.00%
|
| Additional Fund Statistics [Text Block] |
|
|
Net Assets ($) |
27,143,854 |
Number of Portfolio Holdings |
92 |
Portfolio Turnover Rate (%) |
0 |
Total Net Advisory Fees Paid ($) |
2,852 |
Modified duration to worst |
0.4 years | Modified duration to worst is the measure of sensitivity of the prices of bonds held by the Fund to a change in interest rates, computed using each bond's nearest call or maturity date. |
| Holdings [Text Block] |
|
|
Credit Rating |
% of Net Assets |
AAA |
65% |
AA |
34% | |
| Largest Holdings [Text Block] |
|
|
Asset Type |
% of Net Assets |
U.S. Treasury Obligations |
99% |
Other Assets and Liabilities (Net) |
1% | |
| Updated Prospectus Phone Number |
|
|
(844) 851-4255
|
| Updated Prospectus Web Address |
|
|
dws.com/en-us/resources/proxy-voting
|
|
|