| 1 25 45 70 0 145 255 253 226 83 169 170 174 249 50 0 115 175 210 Master Headline | Arial 25, Bold Headline | Arial 21, Bold BLUE SUBHEAD | Arial 12, all caps Subhead | Arial 16, Bold Body Copy | Arial 14 For Bullets, use - 1 MISSION & MASTER-PLAN Gerard Barron, Chairman & CEO August 2025 |

| 2 25 45 70 0 145 255 253 226 83 169 170 174 249 50 0 115 175 210 Master Headline | Arial 25, Bold Headline | Arial 21, Bold BLUE SUBHEAD | Arial 12, all caps Subhead | Arial 16, Bold Body Copy | Arial 14 For Bullets, use - 2 This presentation contains “forward-looking statements” within the meaning of Section 27A of the Securities Act of 1933, as amended, and Section 21E of the Securities Exchange Act of 1934, as amended, that relate to future events, TMC the metals company Inc.’s (“TMC” or the “Company”) future operations and financial performance, and the Company’s plans, strategies and prospects. Forward-looking statements include, but are not limited to, expectations regarding permitting and production timelines under the Deep Seabed Hard Mineral Resources Act (DSHMRA), the development of a domestic U.S. supply chain, commercialization of the Metals-as-a-Service (MaaS) model, long-term resource utilization, and the Company’s partnerships, infrastructure investments, and regulatory approvals. These statements involve risks, uncertainties and assumptions and are based on the current estimates and assumptions of the management of the Company as of the date of this presentation and are subject to uncertainty and changes. Given these uncertainties, you should not place undue reliance on these forward-looking statements. Important factors that could cause actual results to differ materially from those indicated by such forward-looking statements include, among others, those set forth under the heading “Risk Factors” contained in TMC’s Annual Report on Form 10-K for the year ended December 31, 2024, which was filed with the Securities and Exchange Commission on March 27, 2025, as well as any updates to those risk factors filed from time to time in TMC’s subsequent periodic and current reports. All information in this presentation is as of the date of this presentation, and the Company undertakes no duty to update this information unless required by law. Forward looking statements. |
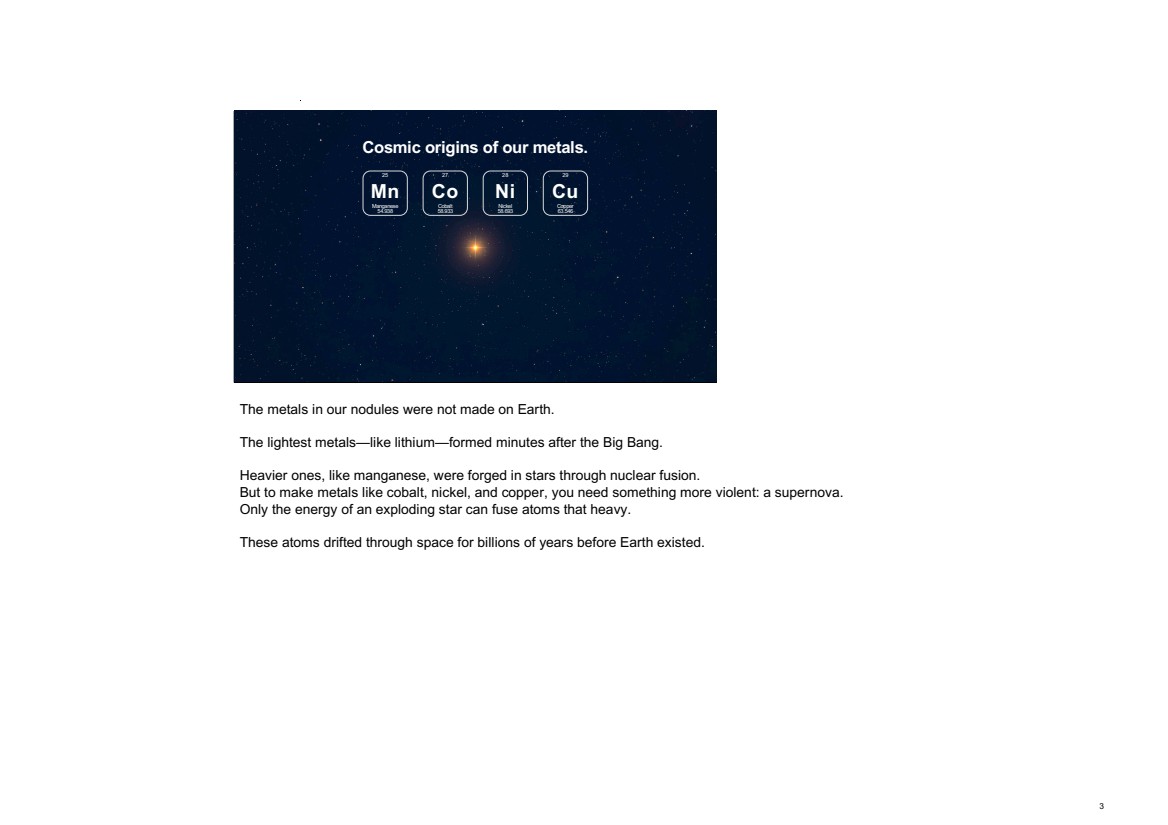
| The metals in our nodules were not made on Earth. The lightest metals—like lithium—formed minutes after the Big Bang. Heavier ones, like manganese, were forged in stars through nuclear fusion. But to make metals like cobalt, nickel, and copper, you need something more violent: a supernova. Only the energy of an exploding star can fuse atoms that heavy. These atoms drifted through space for billions of years before Earth existed. 3 25 45 70 0 145 255 253 226 83 169 170 174 249 50 0 115 175 210 Master Headline | Arial 25, Bold Headline | Arial 21, Bold BLUE SUBHEAD | Arial 12, all caps Subhead | Arial 16, Bold Body Copy | Arial 14 For Bullets, use - 3 25 Mn Manganese 54.938 28 Ni Nickel 58.693 27 Co Cobalt 58.933 29 Cu Copper 63.546 Cosmic origins of our metals. |
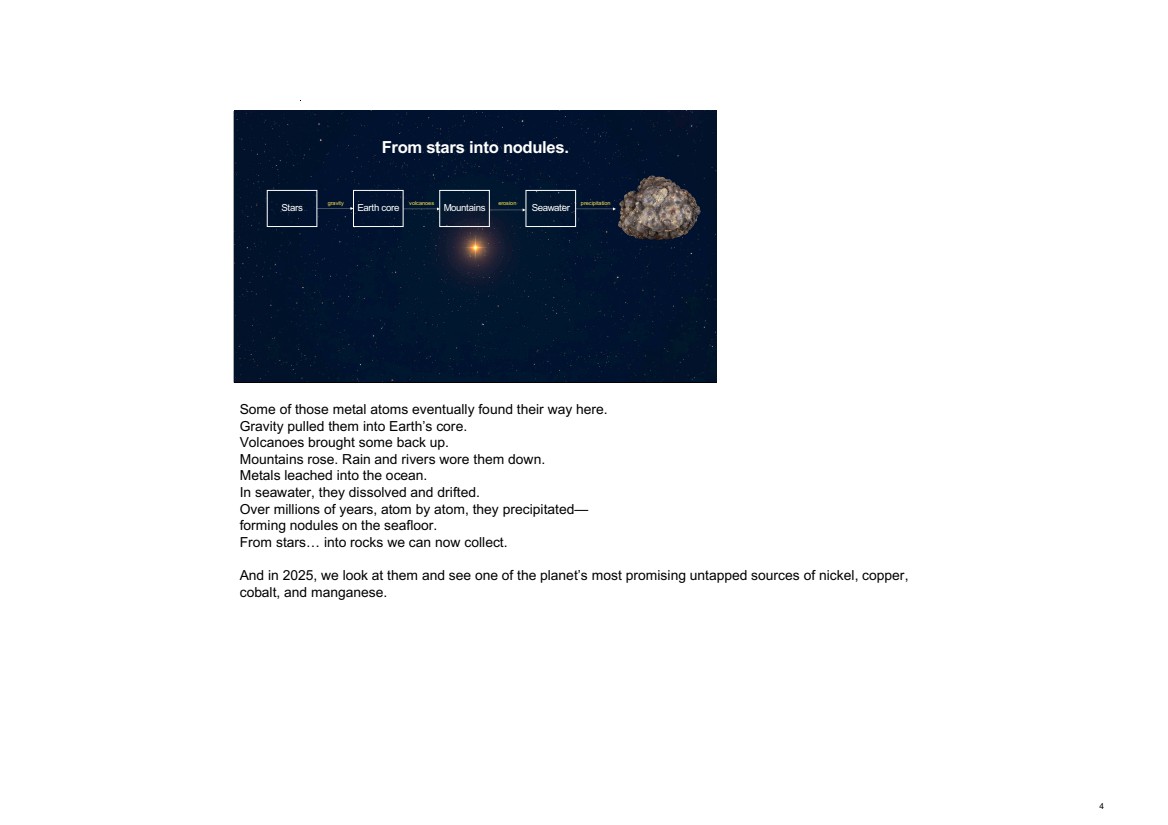
| Some of those metal atoms eventually found their way here. Gravity pulled them into Earth’s core. Volcanoes brought some back up. Mountains rose. Rain and rivers wore them down. Metals leached into the ocean. In seawater, they dissolved and drifted. Over millions of years, atom by atom, they precipitated— forming nodules on the seafloor. From stars… into rocks we can now collect. And in 2025, we look at them and see one of the planet’s most promising untapped sources of nickel, copper, cobalt, and manganese. 4 25 45 70 0 145 255 253 226 83 169 170 174 249 50 0 115 175 210 Master Headline | Arial 25, Bold Headline | Arial 21, Bold BLUE SUBHEAD | Arial 12, all caps Subhead | Arial 16, Bold Body Copy | Arial 14 For Bullets, use - 4 From stars into nodules. Stars Earth core Mountains Seawater gravity volcanoes erosion precipitation |
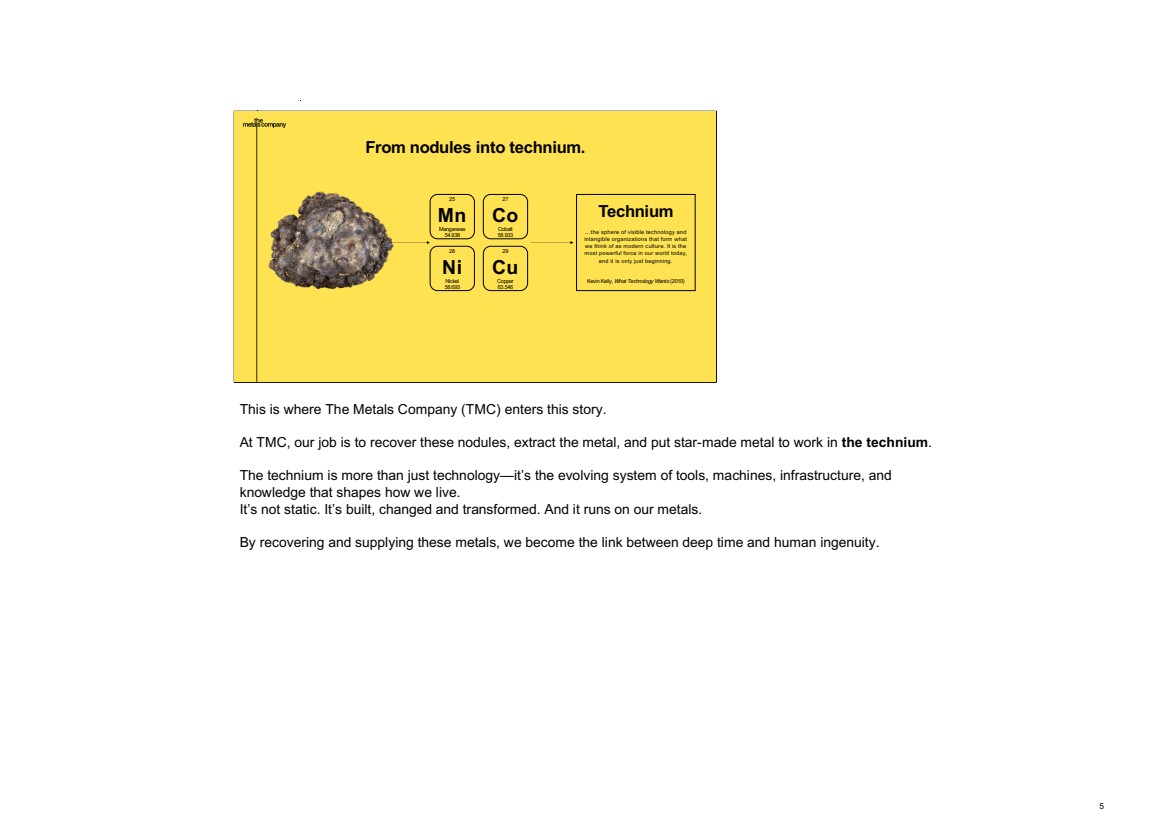
| This is where The Metals Company (TMC) enters this story. At TMC, our job is to recover these nodules, extract the metal, and put star-made metal to work in the technium. The technium is more than just technology—it’s the evolving system of tools, machines, infrastructure, and knowledge that shapes how we live. It’s not static. It’s built, changed and transformed. And it runs on our metals. By recovering and supplying these metals, we become the link between deep time and human ingenuity. 5 25 45 70 0 145 255 253 226 83 169 170 174 249 50 0 115 175 210 Master Headline | Arial 25, Bold Headline | Arial 21, Bold BLUE SUBHEAD | Arial 12, all caps Subhead | Arial 16, Bold Body Copy | Arial 14 For Bullets, use - 5 From nodules into technium. 25 Mn Manganese 54.938 28 Ni Nickel 58.693 27 Co Cobalt 58.933 29 Cu Copper 63.546 Technium …the sphere of visible technology and intangible organizations that form what we think of as modern culture. It is the most powerful force in our world today, and it is only just beginning. Kevin Kelly, What Technology Wants (2010) |
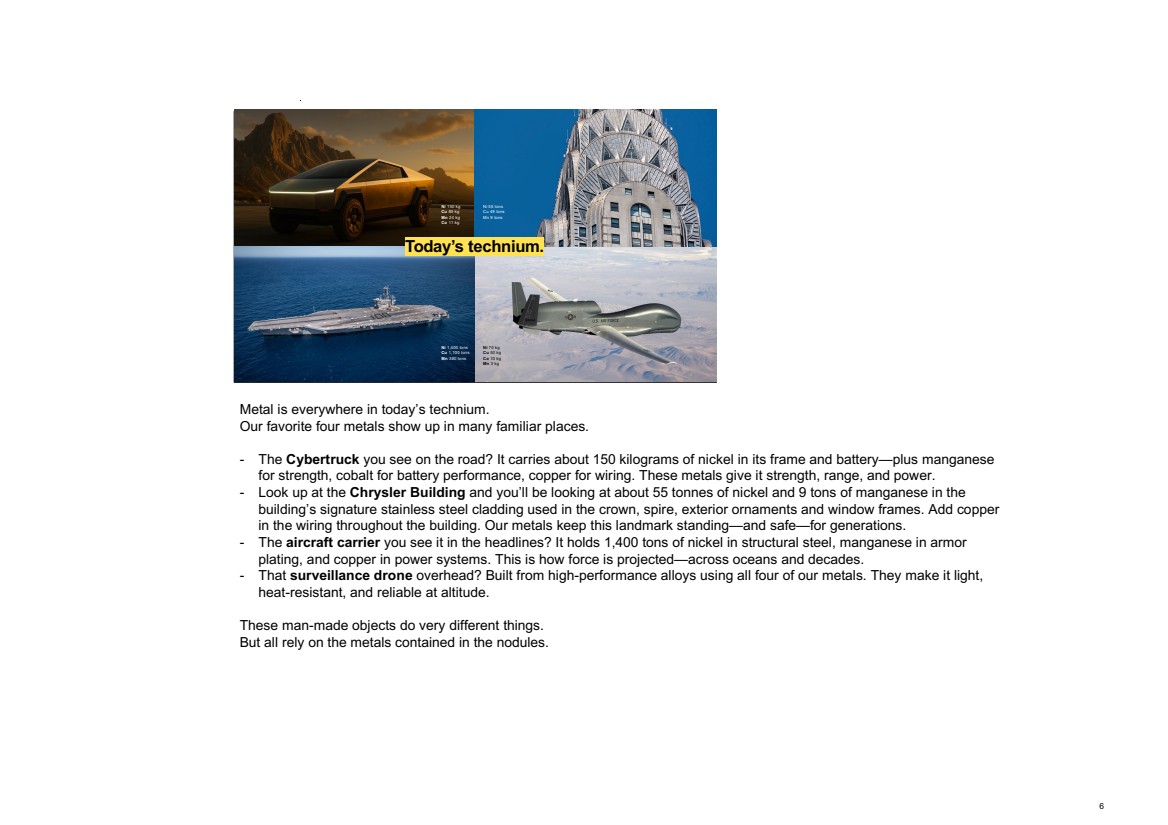
| Metal is everywhere in today’s technium. Our favorite four metals show up in many familiar places. - The Cybertruck you see on the road? It carries about 150 kilograms of nickel in its frame and battery—plus manganese for strength, cobalt for battery performance, copper for wiring. These metals give it strength, range, and power. - Look up at the Chrysler Building and you’ll be looking at about 55 tonnes of nickel and 9 tons of manganese in the building’s signature stainless steel cladding used in the crown, spire, exterior ornaments and window frames. Add copper in the wiring throughout the building. Our metals keep this landmark standing—and safe—for generations. - The aircraft carrier you see it in the headlines? It holds 1,400 tons of nickel in structural steel, manganese in armor plating, and copper in power systems. This is how force is projected—across oceans and decades. - That surveillance drone overhead? Built from high-performance alloys using all four of our metals. They make it light, heat-resistant, and reliable at altitude. These man-made objects do very different things. But all rely on the metals contained in the nodules. 6 25 45 70 0 145 255 253 226 83 169 170 174 249 50 0 115 175 210 Master Headline | Arial 25, Bold Headline | Arial 21, Bold BLUE SUBHEAD | Arial 12, all caps Subhead | Arial 16, Bold Body Copy | Arial 14 For Bullets, use - 6 Ni 150 kg Cu 85 kg Mn 24 kg Co 11 kg Ni 1,400 tons Cu 1,100 tons Mn 380 tons Ni 70 kg Cu 50 kg Co 10 kg Mn 3 kg Re-estimate with Grok Today’s technium. Ni 55 tons Cu 49 tons Mn 9 tons |
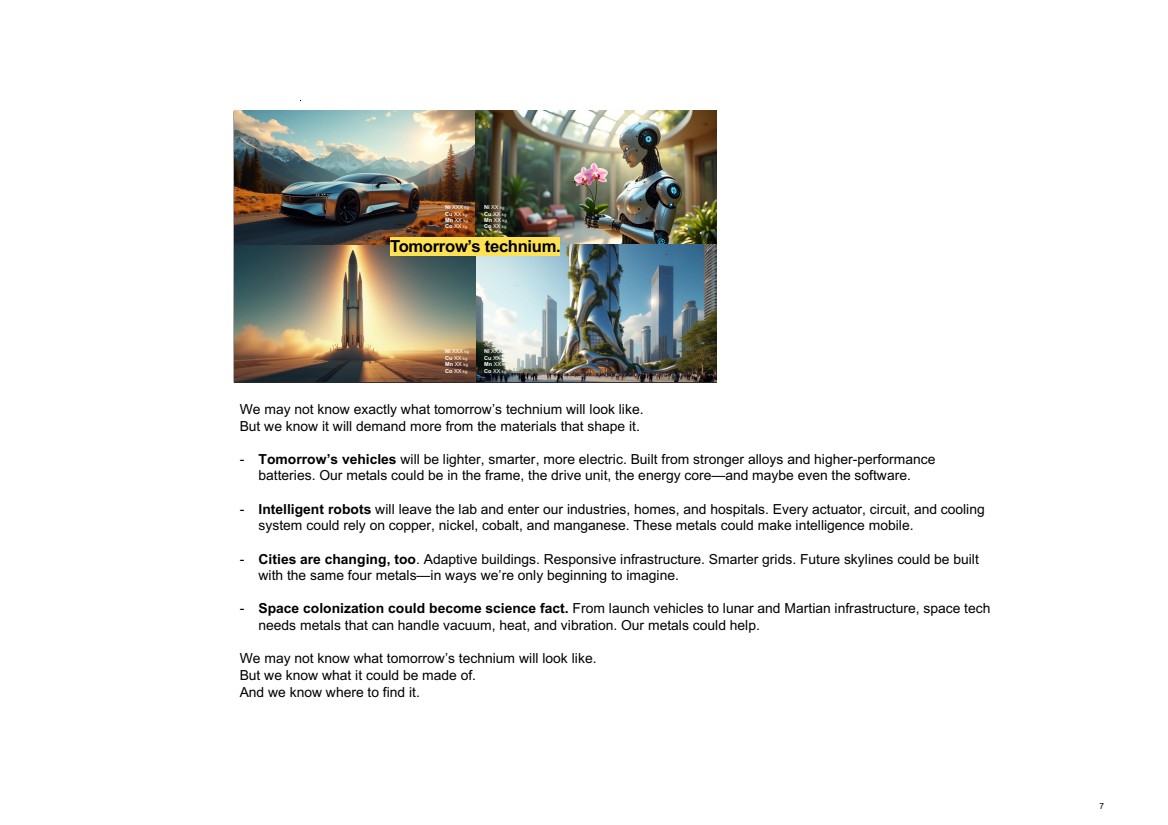
| We may not know exactly what tomorrow’s technium will look like. But we know it will demand more from the materials that shape it. - Tomorrow’s vehicles will be lighter, smarter, more electric. Built from stronger alloys and higher-performance batteries. Our metals could be in the frame, the drive unit, the energy core—and maybe even the software. - Intelligent robots will leave the lab and enter our industries, homes, and hospitals. Every actuator, circuit, and cooling system could rely on copper, nickel, cobalt, and manganese. These metals could make intelligence mobile. - Cities are changing, too. Adaptive buildings. Responsive infrastructure. Smarter grids. Future skylines could be built with the same four metals—in ways we’re only beginning to imagine. - Space colonization could become science fact. From launch vehicles to lunar and Martian infrastructure, space tech needs metals that can handle vacuum, heat, and vibration. Our metals could help. We may not know what tomorrow’s technium will look like. But we know what it could be made of. And we know where to find it. 7 25 45 70 0 145 255 253 226 83 169 170 174 249 50 0 115 175 210 Master Headline | Arial 25, Bold Headline | Arial 21, Bold BLUE SUBHEAD | Arial 12, all caps Subhead | Arial 16, Bold Body Copy | Arial 14 For Bullets, use - 7 Ni XXX kg Cu XX kg Mn XX kg Co XX kg Tomorrow’s technium. Ni XX kg Cu XX kg Mn XX kg Co XX kg Ni XXX kg Cu XX kg Mn XX kg Co XX kg Ni XXX kg Cu XX kg Mn XX kg Co XX kg |
| The beautiful thing about metal atoms is—they don’t wear out. They can be used, recovered, and reused. Again and again. That nickel inside your car could serve your great-grandchildren a hundred years from now. And theirs, a hundred years after that. Nature figured this out long ago. Nutrients cycle through living systems. We believe metals should do the same. That means treating base metals like we already treat precious metals—not as disposable, but as enduring. Because what’s truly precious isn’t the metal atom—it’s the cost of disturbing ecosystems and communities to get it. If we manage metal stocks carefully—once mined, forever useful—we can extend their value and limit the damage. Our technium won’t just grow blindly at people’s and nature’s expense. It would keep transforming through smart reuse and thoughtful extraction. 8 25 45 70 0 145 255 253 226 83 169 170 174 249 50 0 115 175 210 Master Headline | Arial 25, Bold Headline | Arial 21, Bold BLUE SUBHEAD | Arial 12, all caps Subhead | Arial 16, Bold Body Copy | Arial 14 For Bullets, use - 8 Our vision. Imagine this: A hundred years from now, our great-grandchildren using the same metal atoms inside today’s vehicles, factories, machines, and buildings. The same atoms, cycling through generations of tools and technologies. We envision a world where metals move through the technium like nutrients through a living system—used, recovered, reused again and again. Not for a decade. For millennia. |
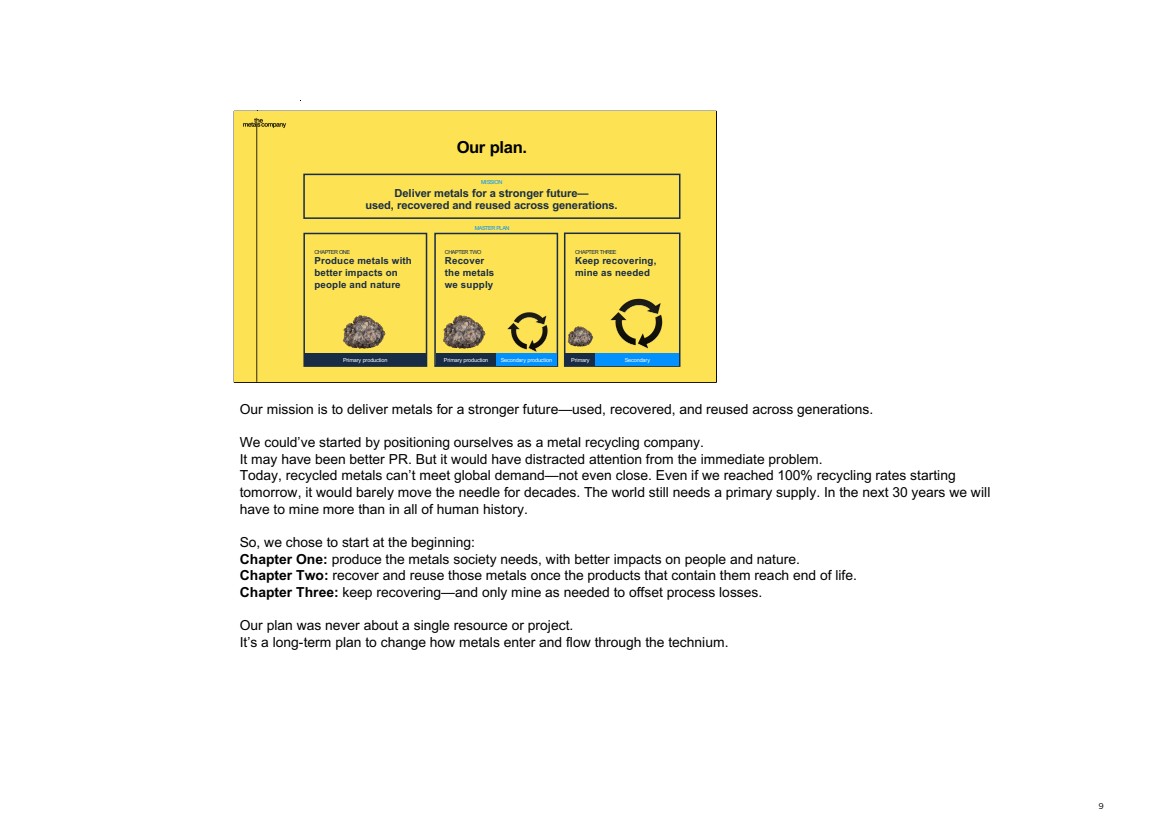
| Our mission is to deliver metals for a stronger future—used, recovered, and reused across generations. We could’ve started by positioning ourselves as a metal recycling company. It may have been better PR. But it would have distracted attention from the immediate problem. Today, recycled metals can’t meet global demand—not even close. Even if we reached 100% recycling rates starting tomorrow, it would barely move the needle for decades. The world still needs a primary supply. In the next 30 years we will have to mine more than in all of human history. So, we chose to start at the beginning: Chapter One: produce the metals society needs, with better impacts on people and nature. Chapter Two: recover and reuse those metals once the products that contain them reach end of life. Chapter Three: keep recovering—and only mine as needed to offset process losses. Our plan was never about a single resource or project. It’s a long-term plan to change how metals enter and flow through the technium. 9 25 45 70 0 145 255 253 226 83 169 170 174 249 50 0 115 175 210 Master Headline | Arial 25, Bold Headline | Arial 21, Bold BLUE SUBHEAD | Arial 12, all caps Subhead | Arial 16, Bold Body Copy | Arial 14 For Bullets, use - 9 CHAPTER ONE Produce metals with better impacts on people and nature CHAPTER TWO Recover the metals we supply CHAPTER THREE Keep recovering, mine as needed MISSION Deliver metals for a stronger future— used, recovered and reused across generations. MASTER PLAN Our plan. Primary production Primary production Secondary production Primary Secondary |
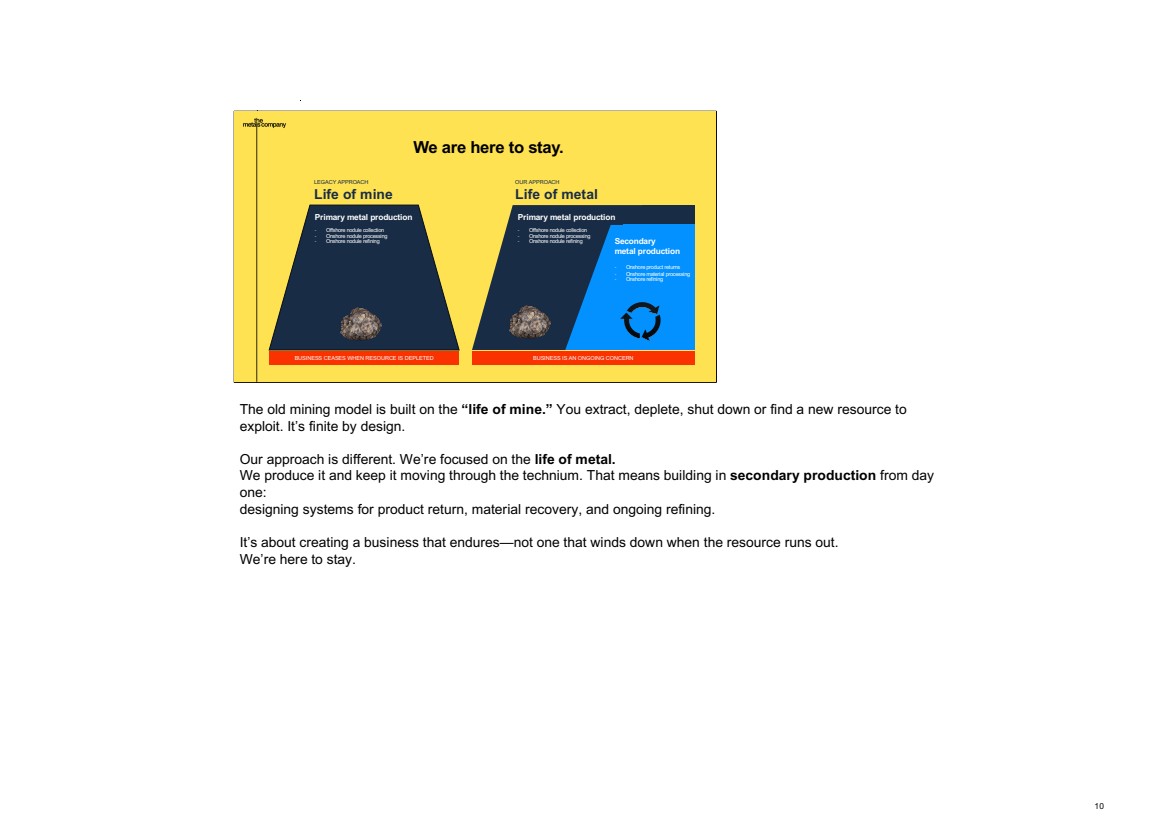
| The old mining model is built on the “life of mine.” You extract, deplete, shut down or find a new resource to exploit. It’s finite by design. Our approach is different. We’re focused on the life of metal. We produce it and keep it moving through the technium. That means building in secondary production from day one: designing systems for product return, material recovery, and ongoing refining. It’s about creating a business that endures—not one that winds down when the resource runs out. We’re here to stay. 10 25 45 70 0 145 255 253 226 83 169 170 174 249 50 0 115 175 210 Master Headline | Arial 25, Bold Headline | Arial 21, Bold BLUE SUBHEAD | Arial 12, all caps Subhead | Arial 16, Bold Body Copy | Arial 14 For Bullets, use - 10 We are here to stay. LEGACY APPROACH Life of mine OUR APPROACH Life of metal Primary metal production - Offshore nodule collection - Onshore nodule processing - Onshore nodule refining Secondary metal production - Onshore product returns - Onshore material processing - Onshore refining Primary metal production - Offshore nodule collection - Onshore nodule processing - Onshore nodule refining BUSINESS CEASES WHEN RESOURCE IS DEPLETED BUSINESS IS AN ONGOING CONCERN |
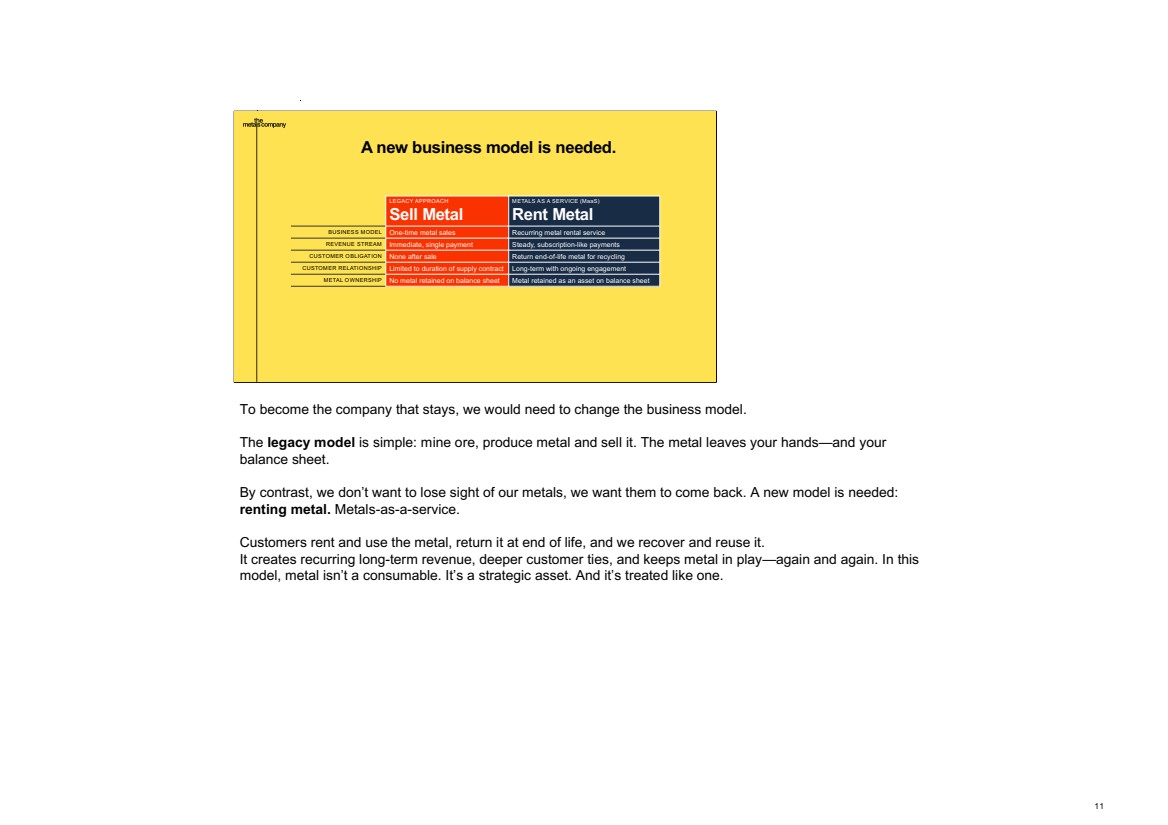
| To become the company that stays, we would need to change the business model. The legacy model is simple: mine ore, produce metal and sell it. The metal leaves your hands—and your balance sheet. By contrast, we don’t want to lose sight of our metals, we want them to come back. A new model is needed: renting metal. Metals-as-a-service. Customers rent and use the metal, return it at end of life, and we recover and reuse it. It creates recurring long-term revenue, deeper customer ties, and keeps metal in play—again and again. In this model, metal isn’t a consumable. It’s a strategic asset. And it’s treated like one. 11 25 45 70 0 145 255 253 226 83 169 170 174 249 50 0 115 175 210 Master Headline | Arial 25, Bold Headline | Arial 21, Bold BLUE SUBHEAD | Arial 12, all caps Subhead | Arial 16, Bold Body Copy | Arial 14 For Bullets, use - 11 A new business model is needed. LEGACY APPROACH Sell Metal METALS AS A SERVICE (MaaS) Rent Metal BUSINESS MODEL One-time metal sales Recurring metal rental service REVENUE STREAM Immediate, single payment Steady, subscription-like payments CUSTOMER OBLIGATION None after sale Return end-of-life metal for recycling CUSTOMER RELATIONSHIP Limited to duration of supply contract Long-term with ongoing engagement METAL OWNERSHIP No metal retained on balance sheet Metal retained as an asset on balance sheet |
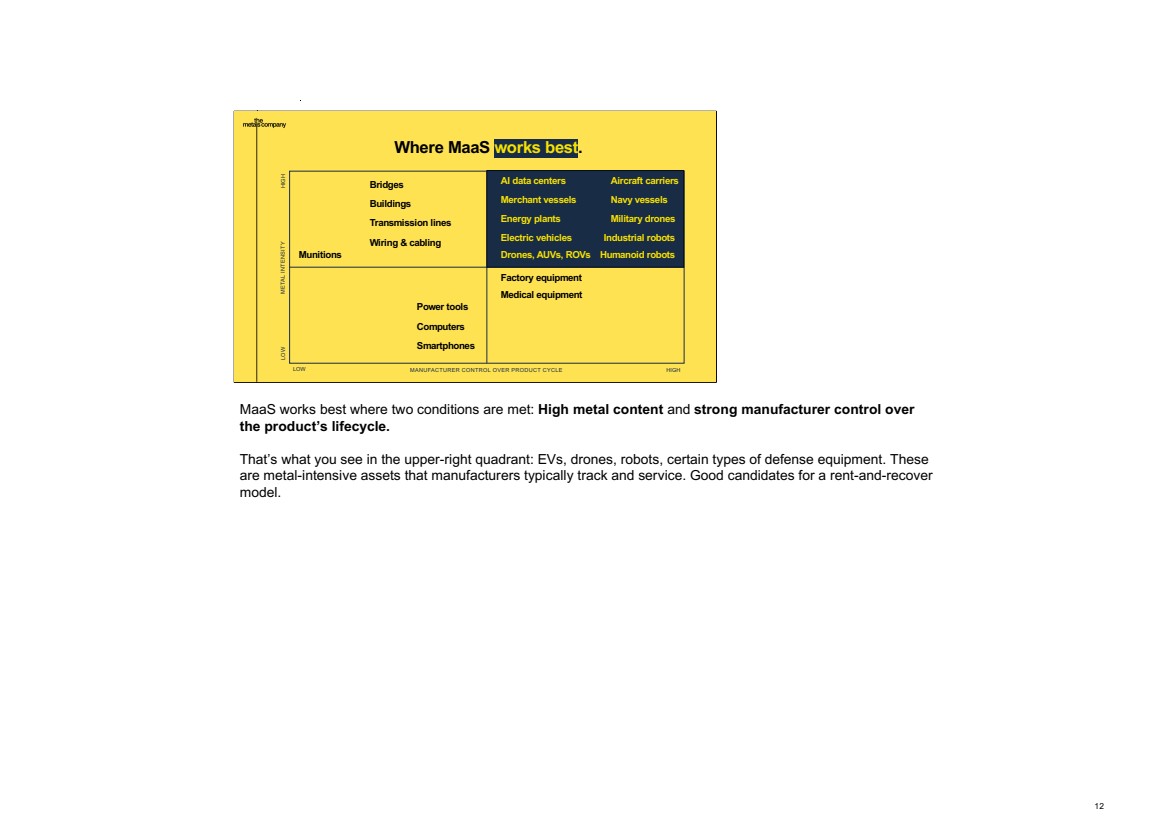
| MaaS works best where two conditions are met: High metal content and strong manufacturer control over the product’s lifecycle. That’s what you see in the upper-right quadrant: EVs, drones, robots, certain types of defense equipment. These are metal-intensive assets that manufacturers typically track and service. Good candidates for a rent-and-recover model. 12 25 45 70 0 145 255 253 226 83 169 170 174 249 50 0 115 175 210 Master Headline | Arial 25, Bold Headline | Arial 21, Bold BLUE SUBHEAD | Arial 12, all caps Subhead | Arial 16, Bold Body Copy | Arial 14 For Bullets, use - 12 Where MaaS works best. LOW MANUFACTURER CONTROL OVER PRODUCT CYCLE HIGH METAL INTENSITY LOW HIGH Smartphones Computers Bridges Buildings Electric vehicles AI data centers Drones, AUVs, ROVs Humanoid robots Aircraft carriers Transmission lines Wiring & cabling Military drones Merchant vessels Navy vessels Energy plants Industrial robots Medical equipment Power tools Munitions Factory equipment |
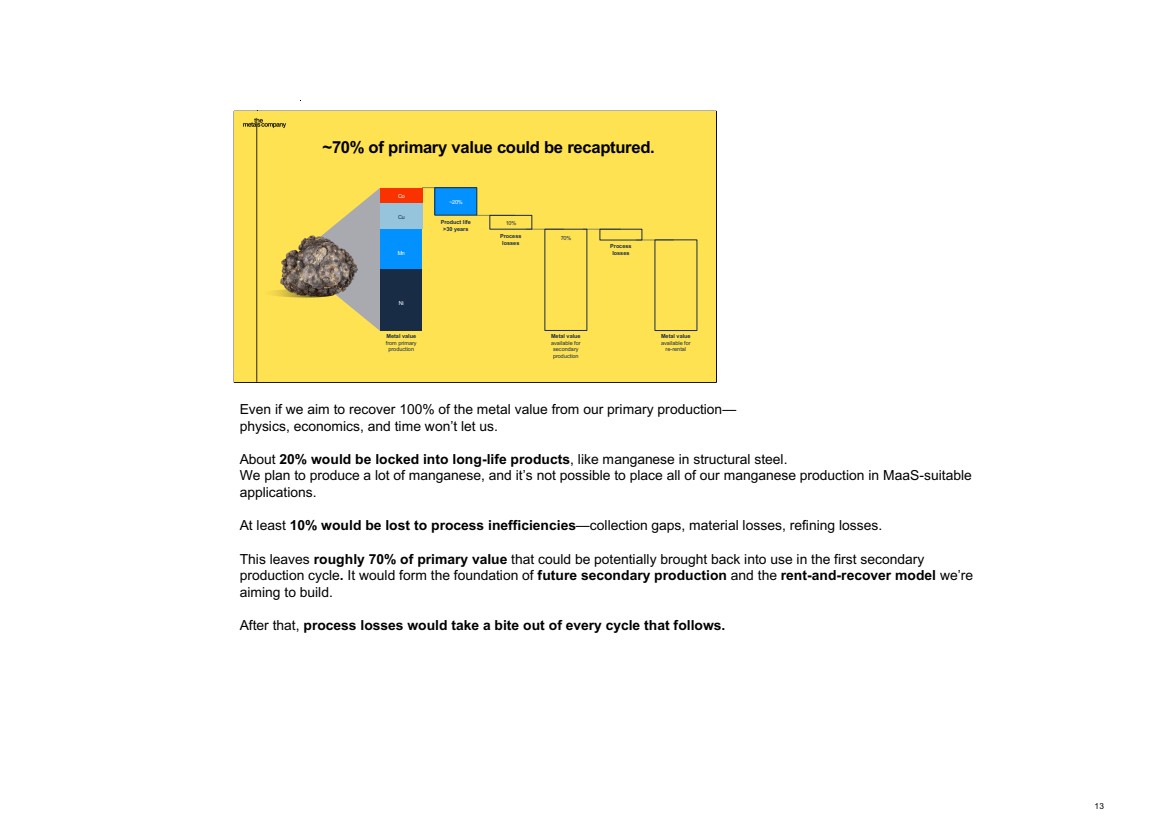
| Even if we aim to recover 100% of the metal value from our primary production— physics, economics, and time won’t let us. About 20% would be locked into long-life products, like manganese in structural steel. We plan to produce a lot of manganese, and it’s not possible to place all of our manganese production in MaaS-suitable applications. At least 10% would be lost to process inefficiencies—collection gaps, material losses, refining losses. This leaves roughly 70% of primary value that could be potentially brought back into use in the first secondary production cycle. It would form the foundation of future secondary production and the rent-and-recover model we’re aiming to build. After that, process losses would take a bite out of every cycle that follows. 13 25 45 70 0 145 255 253 226 83 169 170 174 249 50 0 115 175 210 Master Headline | Arial 25, Bold Headline | Arial 21, Bold BLUE SUBHEAD | Arial 12, all caps Subhead | Arial 16, Bold Body Copy | Arial 14 For Bullets, use - 13 ~70% of primary value could be recaptured. Product life >30 years Mn Co Cu Ni Metal value from primary production Metal value available for secondary production 10% Process losses 70% ~20% Assuming - all of Ni, Co & Cu goes into an EV - 93% of Mn mass goes into Mn silicate ($500/t of Mn contained) and 7% of Mn mass goes into battery grade Mn sulfate ($3,080-6,160/t of Mn contained) PFS: $595/dt Ni 268 Mn 167 (28%) Cu 101 Co 54 Modified: $718/dt Ni 268 Mn 155 (21%) – Mn silicate Mn 140 – Mn sulfate (x12 revenue vs Mn silicate) Cu 101 Co 54 Metal value available for re-rental Process losses |
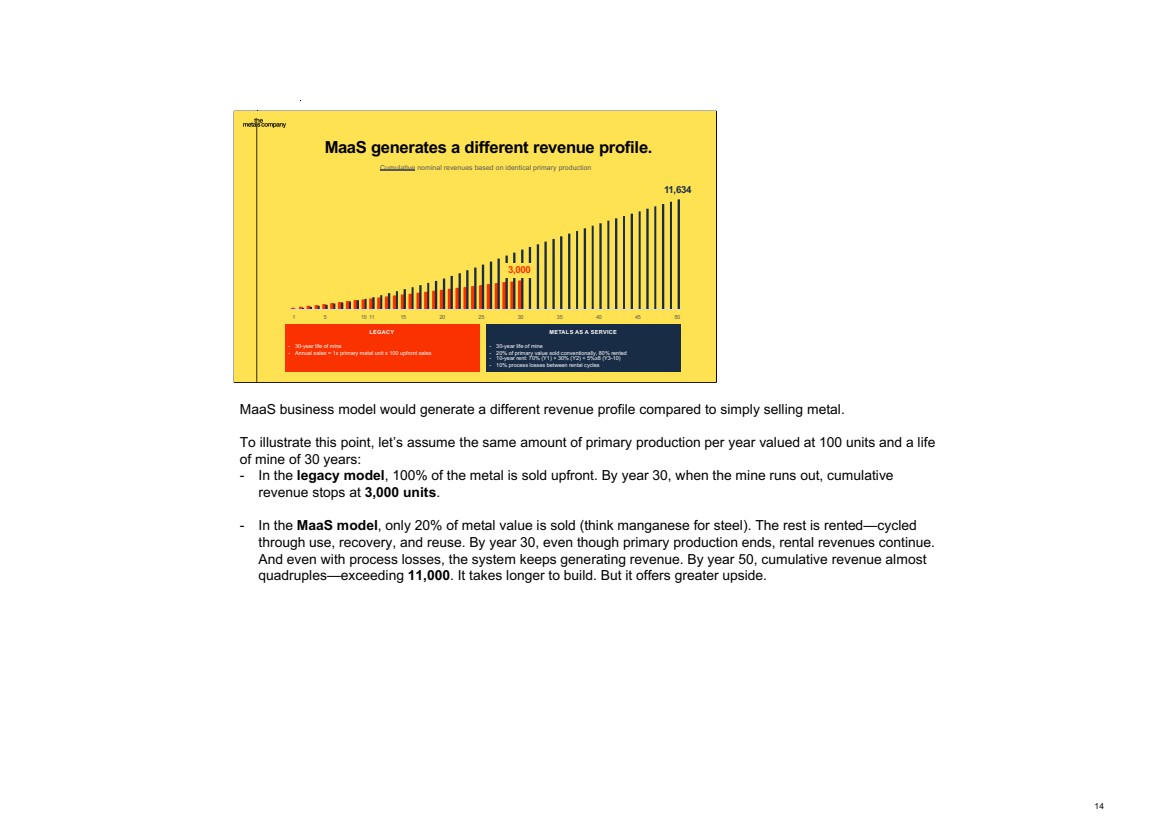
| MaaS business model would generate a different revenue profile compared to simply selling metal. To illustrate this point, let’s assume the same amount of primary production per year valued at 100 units and a life of mine of 30 years: - In the legacy model, 100% of the metal is sold upfront. By year 30, when the mine runs out, cumulative revenue stops at 3,000 units. - In the MaaS model, only 20% of metal value is sold (think manganese for steel). The rest is rented—cycled through use, recovery, and reuse. By year 30, even though primary production ends, rental revenues continue. And even with process losses, the system keeps generating revenue. By year 50, cumulative revenue almost quadruples—exceeding 11,000. It takes longer to build. But it offers greater upside. 14 25 45 70 0 145 255 253 226 83 169 170 174 249 50 0 115 175 210 Master Headline | Arial 25, Bold Headline | Arial 21, Bold BLUE SUBHEAD | Arial 12, all caps Subhead | Arial 16, Bold Body Copy | Arial 14 For Bullets, use - 14 MaaS generates a different revenue profile. 1 5 10 11 15 20 25 30 35 40 45 50 Cumulative nominal revenues based on identical primary production LEGACY - 30-year life of mine - Annual sales = 1x primary metal unit x 100 upfront sales METALS AS A SERVICE - 30-year life of mine - 20% of primary value sold conventionally, 80% rented - 10-year rent: 70% (Y1) + 30% (Y2) + 5%x8 (Y3-10) - 10% process losses between rental cycles 11,634 3,000 |
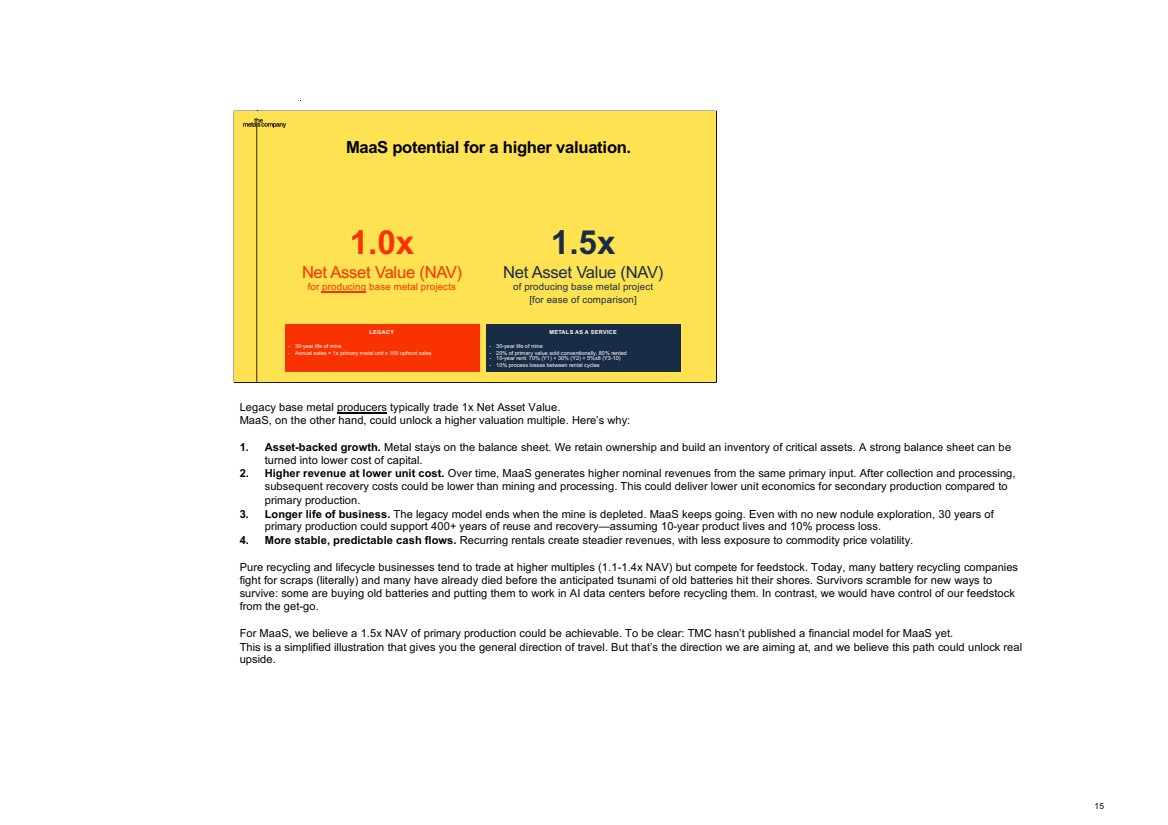
| Legacy base metal producers typically trade 1x Net Asset Value. MaaS, on the other hand, could unlock a higher valuation multiple. Here’s why: 1. Asset-backed growth. Metal stays on the balance sheet. We retain ownership and build an inventory of critical assets. A strong balance sheet can be turned into lower cost of capital. 2. Higher revenue at lower unit cost. Over time, MaaS generates higher nominal revenues from the same primary input. After collection and processing, subsequent recovery costs could be lower than mining and processing. This could deliver lower unit economics for secondary production compared to primary production. 3. Longer life of business. The legacy model ends when the mine is depleted. MaaS keeps going. Even with no new nodule exploration, 30 years of primary production could support 400+ years of reuse and recovery—assuming 10-year product lives and 10% process loss. 4. More stable, predictable cash flows. Recurring rentals create steadier revenues, with less exposure to commodity price volatility. Pure recycling and lifecycle businesses tend to trade at higher multiples (1.1-1.4x NAV) but compete for feedstock. Today, many battery recycling companies fight for scraps (literally) and many have already died before the anticipated tsunami of old batteries hit their shores. Survivors scramble for new ways to survive: some are buying old batteries and putting them to work in AI data centers before recycling them. In contrast, we would have control of our feedstock from the get-go. For MaaS, we believe a 1.5x NAV of primary production could be achievable. To be clear: TMC hasn’t published a financial model for MaaS yet. This is a simplified illustration that gives you the general direction of travel. But that’s the direction we are aiming at, and we believe this path could unlock real upside. 15 25 45 70 0 145 255 253 226 83 169 170 174 249 50 0 115 175 210 Master Headline | Arial 25, Bold Headline | Arial 21, Bold BLUE SUBHEAD | Arial 12, all caps Subhead | Arial 16, Bold Body Copy | Arial 14 For Bullets, use - 15 MaaS potential for a higher valuation. LEGACY - 30-year life of mine - Annual sales = 1x primary metal unit x 100 upfront sales METALS AS A SERVICE - 30-year life of mine - 20% of primary value sold conventionally, 80% rented - 10-year rent: 70% (Y1) + 30% (Y2) + 5%x8 (Y3-10) - 10% process losses between rental cycles 1.0x Net Asset Value (NAV) for producing base metal projects 1.5x Net Asset Value (NAV) of producing base metal project [for ease of comparison] The case for 1.5x NAV multiple for MaaS - The 50-year NPV(8%) is 1.85x higher than for Legacy (2,091 vs 1,126) - Additional CAPEX is likely marginal as the same refining facilities could be re-used – albeit production volumes would need an adjustment, pulling down the revenue - MaaS OPEX for primary production is the same but likely lower for secondary production as it is unlikely that the unit cost of collecting and disassembly of end-of-life products is higher than collecting, transporting and primary processing of nodules. - Multiple is applied to the NAV of primary production, not NAV of MaaS model > smaller base calls for higher multiple If we believed that (1) OPEX for primary production and for secondary production is equal and (2) cumulative MaaS revenue is lower to match the refining capacity of the primary production, we believe 1.5x for MaaS is justified. |
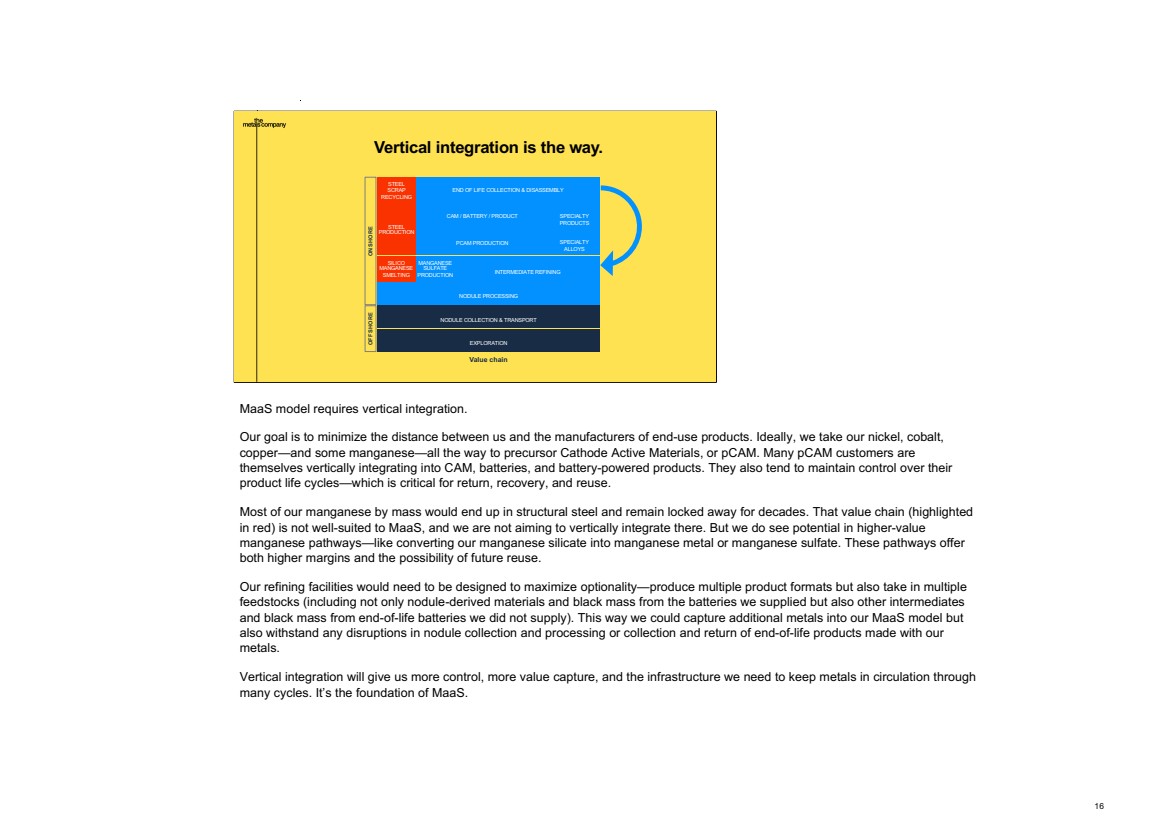
| MaaS model requires vertical integration. Our goal is to minimize the distance between us and the manufacturers of end-use products. Ideally, we take our nickel, cobalt, copper—and some manganese—all the way to precursor Cathode Active Materials, or pCAM. Many pCAM customers are themselves vertically integrating into CAM, batteries, and battery-powered products. They also tend to maintain control over their product life cycles—which is critical for return, recovery, and reuse. Most of our manganese by mass would end up in structural steel and remain locked away for decades. That value chain (highlighted in red) is not well-suited to MaaS, and we are not aiming to vertically integrate there. But we do see potential in higher-value manganese pathways—like converting our manganese silicate into manganese metal or manganese sulfate. These pathways offer both higher margins and the possibility of future reuse. Our refining facilities would need to be designed to maximize optionality—produce multiple product formats but also take in multiple feedstocks (including not only nodule-derived materials and black mass from the batteries we supplied but also other intermediates and black mass from end-of-life batteries we did not supply). This way we could capture additional metals into our MaaS model but also withstand any disruptions in nodule collection and processing or collection and return of end-of-life products made with our metals. Vertical integration will give us more control, more value capture, and the infrastructure we need to keep metals in circulation through many cycles. It’s the foundation of MaaS. 16 25 45 70 0 145 255 253 226 83 169 170 174 249 50 0 115 175 210 Master Headline | Arial 25, Bold Headline | Arial 21, Bold BLUE SUBHEAD | Arial 12, all caps Subhead | Arial 16, Bold Body Copy | Arial 14 For Bullets, use - 16 Vertical integration is the way. EXPLORATION Value chain NODULE COLLECTION & TRANSPORT INTERMEDIATE REFINING SILICO MANGANESE SMELTING MANGANESE SULFATE PRODUCTION PCAM PRODUCTION SPECIALTY ALLOYS STEEL PRODUCTION CAM / BATTERY / PRODUCT SPECIALTY PRODUCTS STEEL SCRAP RECYCLING END OF LIFE COLLECTION & DISASSEMBLY NODULE PROCESSING OFFSHORE ONSHORE |
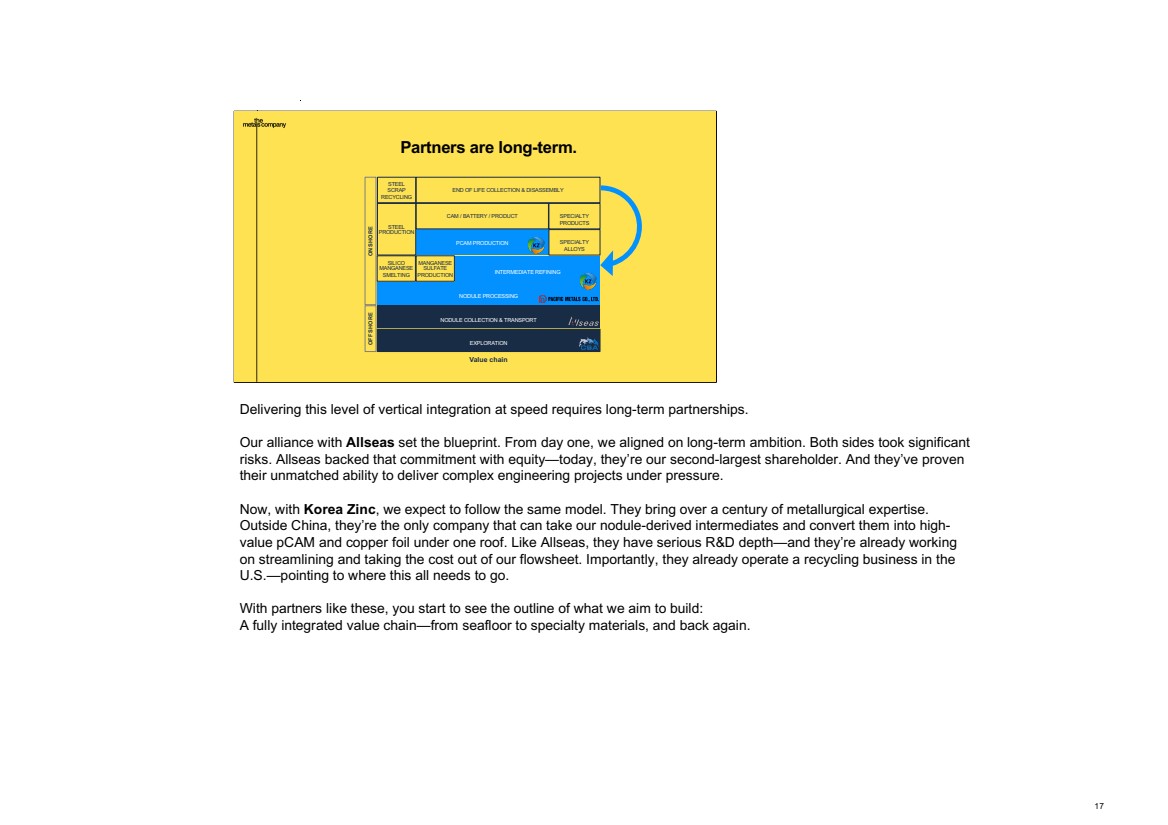
| Delivering this level of vertical integration at speed requires long-term partnerships. Our alliance with Allseas set the blueprint. From day one, we aligned on long-term ambition. Both sides took significant risks. Allseas backed that commitment with equity—today, they’re our second-largest shareholder. And they’ve proven their unmatched ability to deliver complex engineering projects under pressure. Now, with Korea Zinc, we expect to follow the same model. They bring over a century of metallurgical expertise. Outside China, they’re the only company that can take our nodule-derived intermediates and convert them into high-value pCAM and copper foil under one roof. Like Allseas, they have serious R&D depth—and they’re already working on streamlining and taking the cost out of our flowsheet. Importantly, they already operate a recycling business in the U.S.—pointing to where this all needs to go. With partners like these, you start to see the outline of what we aim to build: A fully integrated value chain—from seafloor to specialty materials, and back again. 17 25 45 70 0 145 255 253 226 83 169 170 174 249 50 0 115 175 210 Master Headline | Arial 25, Bold Headline | Arial 21, Bold BLUE SUBHEAD | Arial 12, all caps Subhead | Arial 16, Bold Body Copy | Arial 14 For Bullets, use - 17 Partners are long-term. EXPLORATION NODULE COLLECTION & TRANSPORT INTERMEDIATE REFINING SILICO MANGANESE SMELTING MANGANESE SULFATE PRODUCTION PCAM PRODUCTION SPECIALTY ALLOYS STEEL PRODUCTION CAM / BATTERY / PRODUCT SPECIALTY PRODUCTS STEEL SCRAP RECYCLING END OF LIFE COLLECTION & DISASSEMBLY NODULE PROCESSING Value chain OFFSHORE ONSHORE |
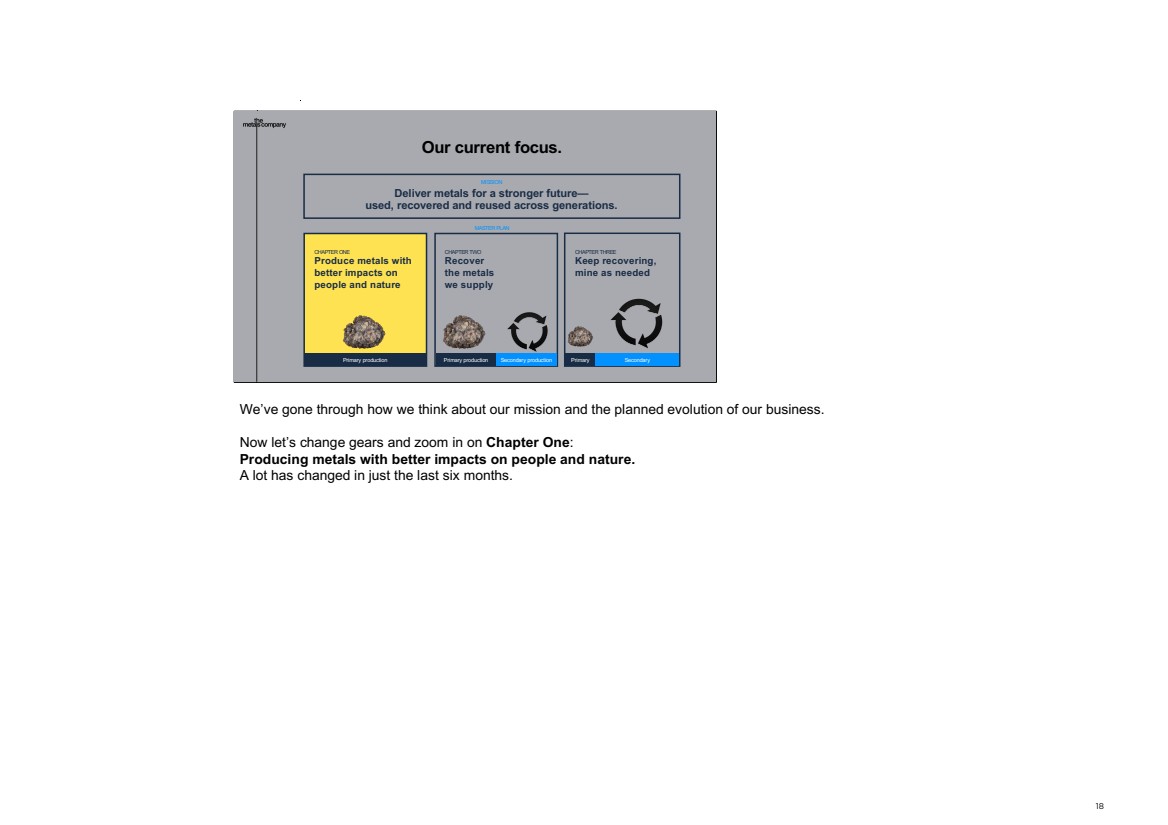
| We’ve gone through how we think about our mission and the planned evolution of our business. Now let’s change gears and zoom in on Chapter One: Producing metals with better impacts on people and nature. A lot has changed in just the last six months. 18 25 45 70 0 145 255 253 226 83 169 170 174 249 50 0 115 175 210 Master Headline | Arial 25, Bold Headline | Arial 21, Bold BLUE SUBHEAD | Arial 12, all caps Subhead | Arial 16, Bold Body Copy | Arial 14 For Bullets, use - 18 CHAPTER TWO Recover the metals we supply CHAPTER THREE Keep recovering, mine as needed MISSION Deliver metals for a stronger future— used, recovered and reused across generations. MASTER PLAN Our current focus. Primary production Primary production Secondary production Primary Secondary CHAPTER ONE Produce metals with better impacts on people and nature |
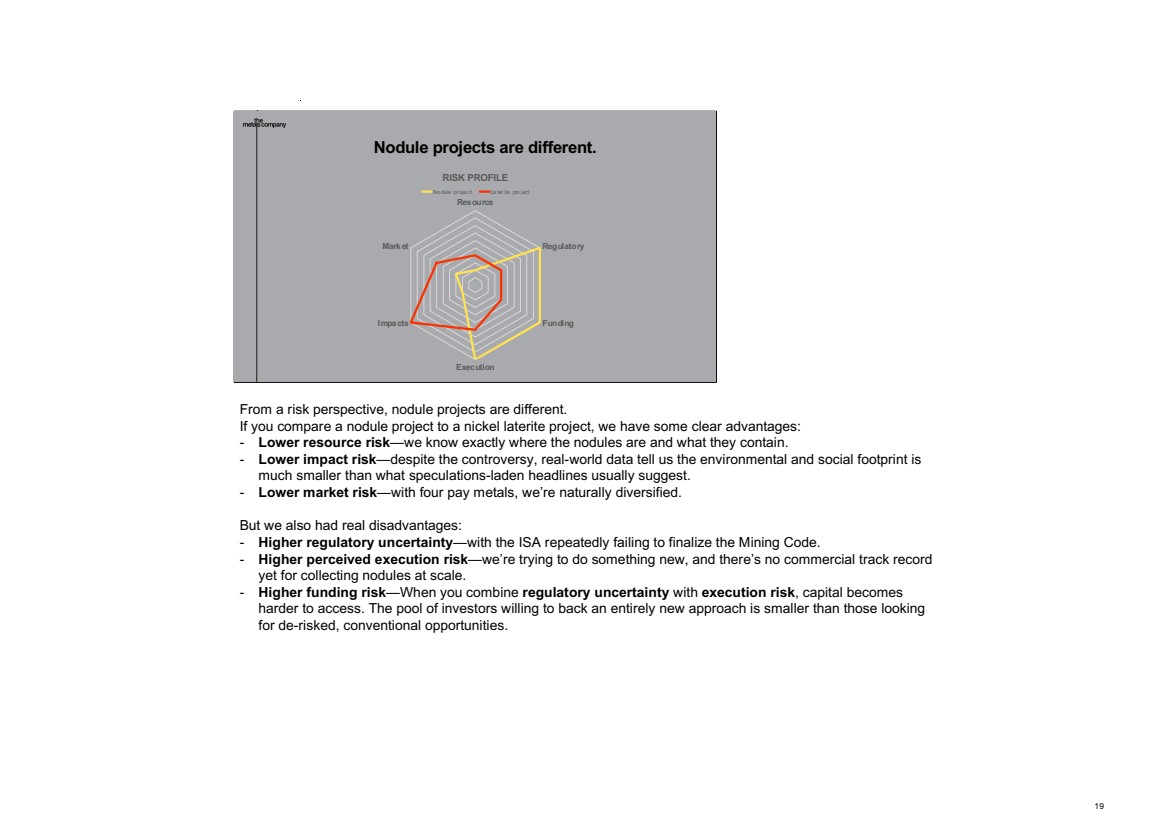
| From a risk perspective, nodule projects are different. If you compare a nodule project to a nickel laterite project, we have some clear advantages: - Lower resource risk—we know exactly where the nodules are and what they contain. - Lower impact risk—despite the controversy, real-world data tell us the environmental and social footprint is much smaller than what speculations-laden headlines usually suggest. - Lower market risk—with four pay metals, we’re naturally diversified. But we also had real disadvantages: - Higher regulatory uncertainty—with the ISA repeatedly failing to finalize the Mining Code. - Higher perceived execution risk—we’re trying to do something new, and there’s no commercial track record yet for collecting nodules at scale. - Higher funding risk—When you combine regulatory uncertainty with execution risk, capital becomes harder to access. The pool of investors willing to back an entirely new approach is smaller than those looking for de-risked, conventional opportunities. 19 25 45 70 0 145 255 253 226 83 169 170 174 249 50 0 115 175 210 Master Headline | Arial 25, Bold Headline | Arial 21, Bold BLUE SUBHEAD | Arial 12, all caps Subhead | Arial 16, Bold Body Copy | Arial 14 For Bullets, use - 19 Nodule projects are different. Resource Regulatory Funding Execution Impacts Market RISK PROFILE No dule pr oje ct La ter ite pro ject |
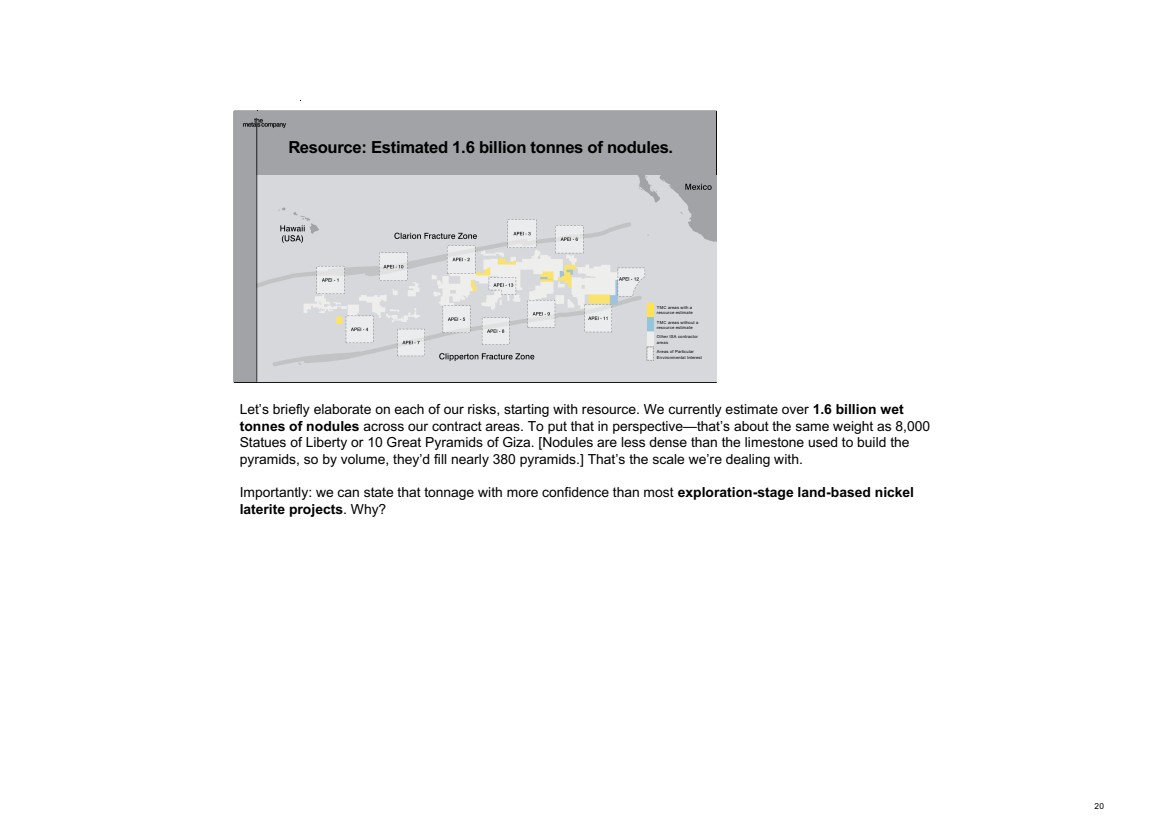
| Let’s briefly elaborate on each of our risks, starting with resource. We currently estimate over 1.6 billion wet tonnes of nodules across our contract areas. To put that in perspective—that’s about the same weight as 8,000 Statues of Liberty or 10 Great Pyramids of Giza. [Nodules are less dense than the limestone used to build the pyramids, so by volume, they’d fill nearly 380 pyramids.] That’s the scale we’re dealing with. Importantly: we can state that tonnage with more confidence than most exploration-stage land-based nickel laterite projects. Why? 20 25 45 70 0 145 255 253 226 83 169 170 174 249 50 0 115 175 210 Master Headline | Arial 25, Bold Headline | Arial 21, Bold BLUE SUBHEAD | Arial 12, all caps Subhead | Arial 16, Bold Body Copy | Arial 14 For Bullets, use - 20 Resource: Estimated 1.6 billion tonnes of nodules. * Exact savings depends on whether the ISA approves of the approach outlined in TOML Scoping Report Source: TMC analysis TMC areas with a resource estimate TMC areas without a resource estimate Other ISA contractor areas Areas of Particular Environmental Interest |
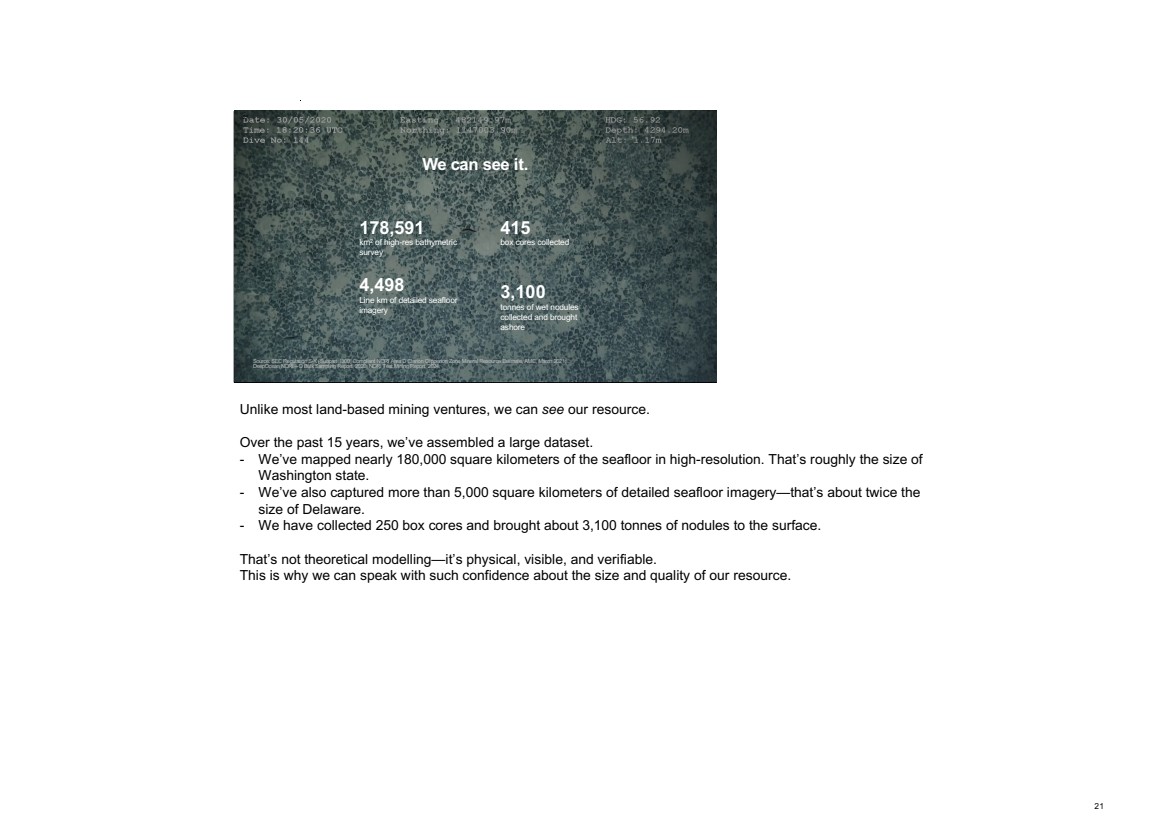
| Unlike most land-based mining ventures, we can see our resource. Over the past 15 years, we’ve assembled a large dataset. - We’ve mapped nearly 180,000 square kilometers of the seafloor in high-resolution. That’s roughly the size of Washington state. - We’ve also captured more than 5,000 square kilometers of detailed seafloor imagery—that’s about twice the size of Delaware. - We have collected 250 box cores and brought about 3,100 tonnes of nodules to the surface. That’s not theoretical modelling—it’s physical, visible, and verifiable. This is why we can speak with such confidence about the size and quality of our resource. 21 25 45 70 0 145 255 253 226 83 169 170 174 249 50 0 115 175 210 Master Headline | Arial 25, Bold Headline | Arial 21, Bold BLUE SUBHEAD | Arial 12, all caps Subhead | Arial 16, Bold Body Copy | Arial 14 For Bullets, use - 2121 We can see it. Source: SEC Regulation S-K (Subpart 1300) Compliant NORI Area D Clarion Clipperton Zone Mineral Resource Estimate, AMC, March 2021; DeepOcean NORI – D Bulk Sampling Report, 2020; NORI Test Mining Report, 2024. 178,591 km2 of high-res bathymetric survey 4,498 Line km of detailed seafloor imagery 415 box cores collected 3,100 tonnes of wet nodules collected and brought ashore |
| Polymetallic nodules pack four metals in a single rock. On land, producing this mix of metals typically requires at least three different mines. Because these nodules form over millions of years through metal precipitation from seawater, their composition is remarkably consistent. You could travel for many miles and still find almost identical metal grades. That level of homogeneity is unheard of in land-based deposits. 22 25 45 70 0 145 255 253 226 83 169 170 174 249 50 0 115 175 210 Master Headline | Arial 25, Bold Headline | Arial 21, Bold BLUE SUBHEAD | Arial 12, all caps Subhead | Arial 16, Bold Body Copy | Arial 14 For Bullets, use - 2222 29 Cu Copper 63.546 28 Ni Nickel 58.693 27 Co Cobalt 58.933 25 Mn Manganese 54.938 Four metals in one ore, low variability. |
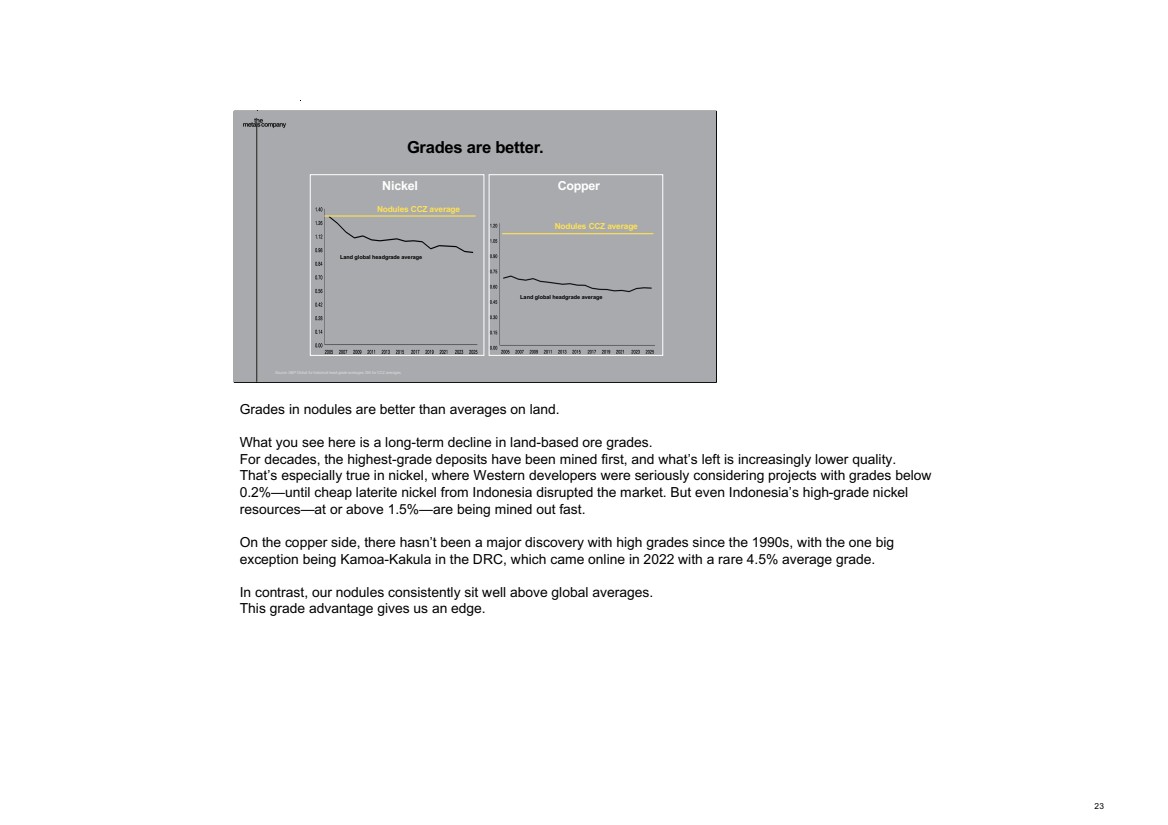
| Grades in nodules are better than averages on land. What you see here is a long-term decline in land-based ore grades. For decades, the highest-grade deposits have been mined first, and what’s left is increasingly lower quality. That’s especially true in nickel, where Western developers were seriously considering projects with grades below 0.2%—until cheap laterite nickel from Indonesia disrupted the market. But even Indonesia’s high-grade nickel resources—at or above 1.5%—are being mined out fast. On the copper side, there hasn’t been a major discovery with high grades since the 1990s, with the one big exception being Kamoa-Kakula in the DRC, which came online in 2022 with a rare 4.5% average grade. In contrast, our nodules consistently sit well above global averages. This grade advantage gives us an edge. 23 25 45 70 0 145 255 253 226 83 169 170 174 249 50 0 115 175 210 Master Headline | Arial 25, Bold Headline | Arial 21, Bold BLUE SUBHEAD | Arial 12, all caps Subhead | Arial 16, Bold Body Copy | Arial 14 For Bullets, use - 23 Nickel Copper Land global headgrade average Nodules CCZ average Land global headgrade average Nodules CCZ average Grades are better. Source: S&P Global for historical head-grade averages; ISA for CCZ averages. |
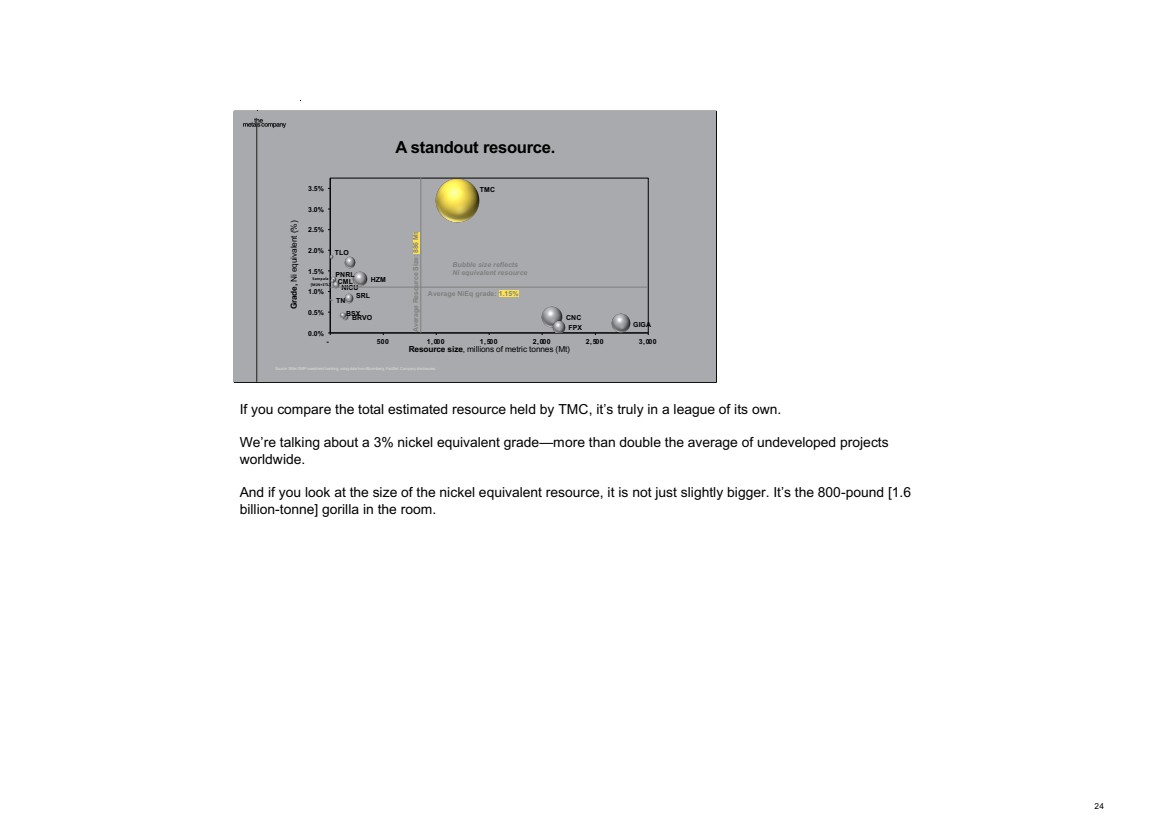
| If you compare the total estimated resource held by TMC, it’s truly in a league of its own. We’re talking about a 3% nickel equivalent grade—more than double the average of undeveloped projects worldwide. And if you look at the size of the nickel equivalent resource, it is not just slightly bigger. It’s the 800-pound [1.6 billion-tonne] gorilla in the room. 24 25 45 70 0 145 255 253 226 83 169 170 174 249 50 0 115 175 210 Master Headline | Arial 25, Bold Headline | Arial 21, Bold BLUE SUBHEAD | Arial 12, all caps Subhead | Arial 16, Bold Body Copy | Arial 14 For Bullets, use - 24 HZM TLO BRVO CNC PNRL SRL FPX NICU BSX GIGA TN CML 0.0% 0.5% 1.0% 1.5% 2.0% 2.5% 3.0% 3.5% - 500 1,000 1,500 2,000 2,500 3,000 Grade, Ni equivalent (%) Resource size, millions of metric tonnes (Mt) Sampala (MJN+ETL) Average NiEq grade: 1.15% Average Resource Size: 886 Mt TMC Bubble size reflects Ni equivalent resource Source: Stifel GMP investment banking, using data from Bloomberg, FactSet, Company disclosures. A standout resource. |
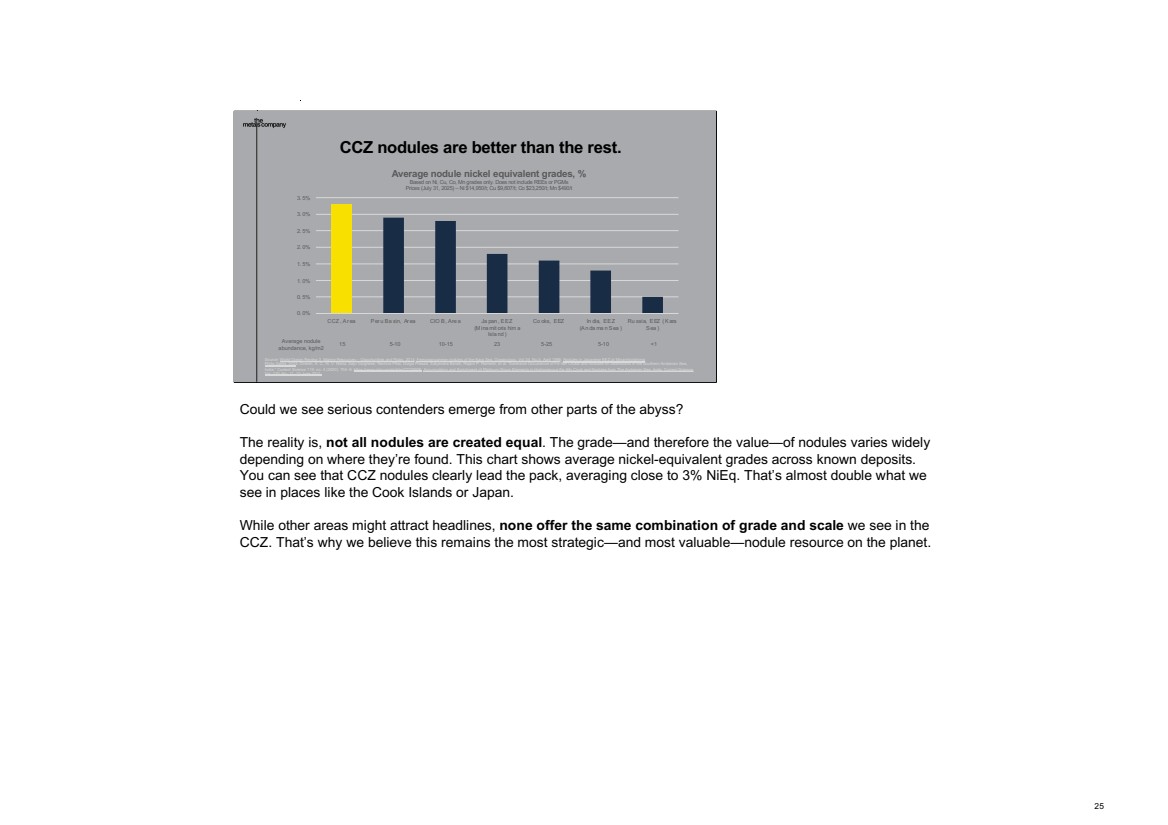
| Could we see serious contenders emerge from other parts of the abyss? The reality is, not all nodules are created equal. The grade—and therefore the value—of nodules varies widely depending on where they’re found. This chart shows average nickel-equivalent grades across known deposits. You can see that CCZ nodules clearly lead the pack, averaging close to 3% NiEq. That’s almost double what we see in places like the Cook Islands or Japan. While other areas might attract headlines, none offer the same combination of grade and scale we see in the CCZ. That’s why we believe this remains the most strategic—and most valuable—nodule resource on the planet. 25 25 45 70 0 145 255 253 226 83 169 170 174 249 50 0 115 175 210 Master Headline | Arial 25, Bold Headline | Arial 21, Bold BLUE SUBHEAD | Arial 12, all caps Subhead | Arial 16, Bold Body Copy | Arial 14 For Bullets, use - 25 CCZ nodules are better than the rest. Source: World Ocean Review 3, Marine Resources – Opportunities and Risks, 2014; Ferromanganese nodules of the Kara Sea, Oceanology, Vol 34, No.5, April 1995; Nodules in Japanese EEZ at Minamitorishima, Philip Gales, 2024; Dinesh, A. C., N. V. Nisha, Saju Varghese, Rachna Pillai, Durga Prasad, Satyendra Baraik, Rajani P. Ramesh, et al. “Extensive Occurrence of Fe–Mn Crusts and Nodules on Seamounts in the Southern Andaman Sea, India.” Current Science 119, no. 4 (2020): 704–8. https://www.jstor.org/stable/27229906; Accumulation and Enrichment of Platinum Group Elements in Hydrogenous Fe–Mn Crust and Nodules from The Andaman Sea, India, Current Science, Vol. 120, No. 11, 10 June 2021. 0. 0% 0. 5% 1. 0% 1. 5% 2. 0% 2. 5% 3. 0% 3. 5% CCZ , Ar ea Per u Ba sin, Ar ea CIO B, Are a Ja pan , EEZ (M ina mit oris him a Isla nd ) Co oks, EEZ In dia, EEZ (An da ma n Sea ) Ru ssia, EEZ ( Kara Sea ) Average nodule nickel equivalent grades, % Based on Ni, Cu, Co, Mn grades only. Does not include REEs or PGMs Prices (July 31, 2025) – Ni $14,950/t; Cu $9,607/t; Co $23,250/t; Mn $490/t 15 5-10 5-10 Average nodule abundance, kg/m2 10-15 23 5-25 <1 |
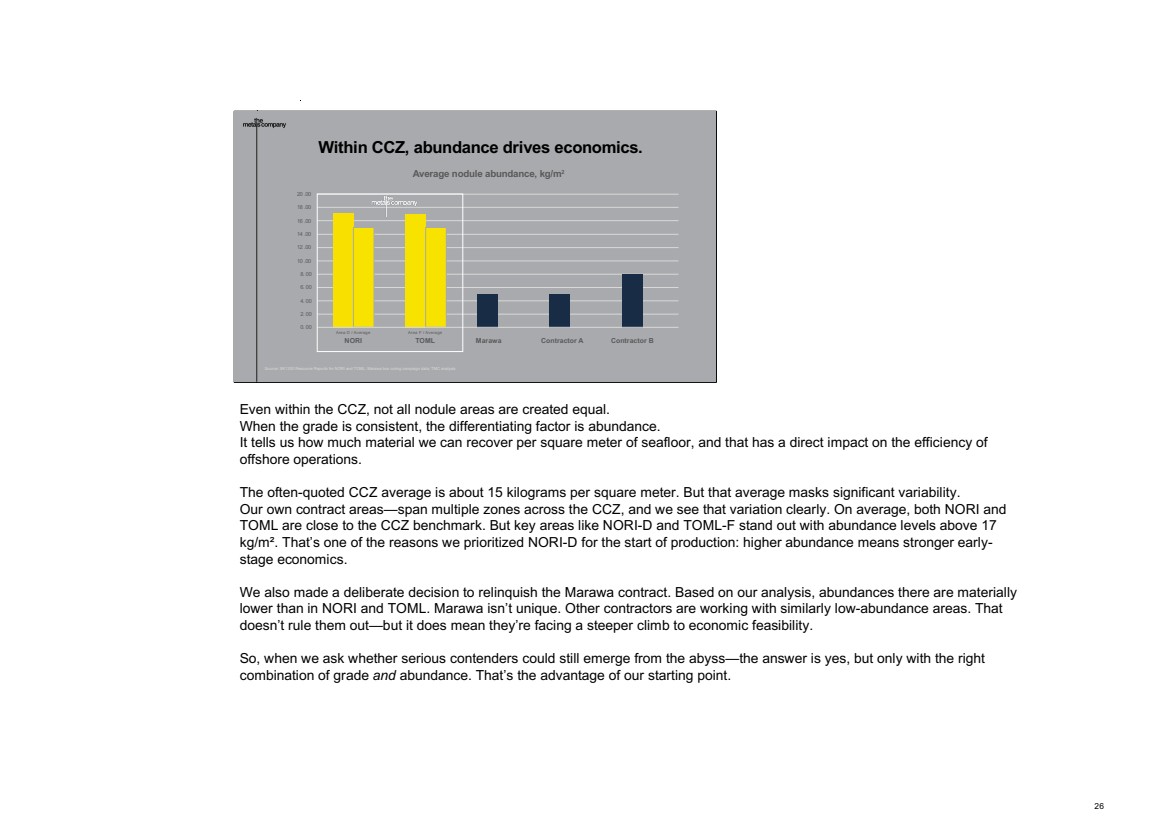
| Even within the CCZ, not all nodule areas are created equal. When the grade is consistent, the differentiating factor is abundance. It tells us how much material we can recover per square meter of seafloor, and that has a direct impact on the efficiency of offshore operations. The often-quoted CCZ average is about 15 kilograms per square meter. But that average masks significant variability. Our own contract areas—span multiple zones across the CCZ, and we see that variation clearly. On average, both NORI and TOML are close to the CCZ benchmark. But key areas like NORI-D and TOML-F stand out with abundance levels above 17 kg/m². That’s one of the reasons we prioritized NORI-D for the start of production: higher abundance means stronger early-stage economics. We also made a deliberate decision to relinquish the Marawa contract. Based on our analysis, abundances there are materially lower than in NORI and TOML. Marawa isn’t unique. Other contractors are working with similarly low-abundance areas. That doesn’t rule them out—but it does mean they’re facing a steeper climb to economic feasibility. So, when we ask whether serious contenders could still emerge from the abyss—the answer is yes, but only with the right combination of grade and abundance. That’s the advantage of our starting point. 26 25 45 70 0 145 255 253 226 83 169 170 174 249 50 0 115 175 210 Master Headline | Arial 25, Bold Headline | Arial 21, Bold BLUE SUBHEAD | Arial 12, all caps Subhead | Arial 16, Bold Body Copy | Arial 14 For Bullets, use - 26 Within CCZ, abundance drives economics. Source: SK1300 Resource Reports for NORI and TOML; Marawa box coring campaign data; TMC analysis 0. 00 2. 00 4. 00 6. 00 8. 00 10 .00 12 .00 14 .00 16 .00 18 .00 20 .00 NOR I-D T OM L- F M arawa Co nt ract or A Co nt ract or B Average nodule abundance, kg/m2 Area D / Average NORI Area F / Average TOML Marawa Contractor A Contractor B |
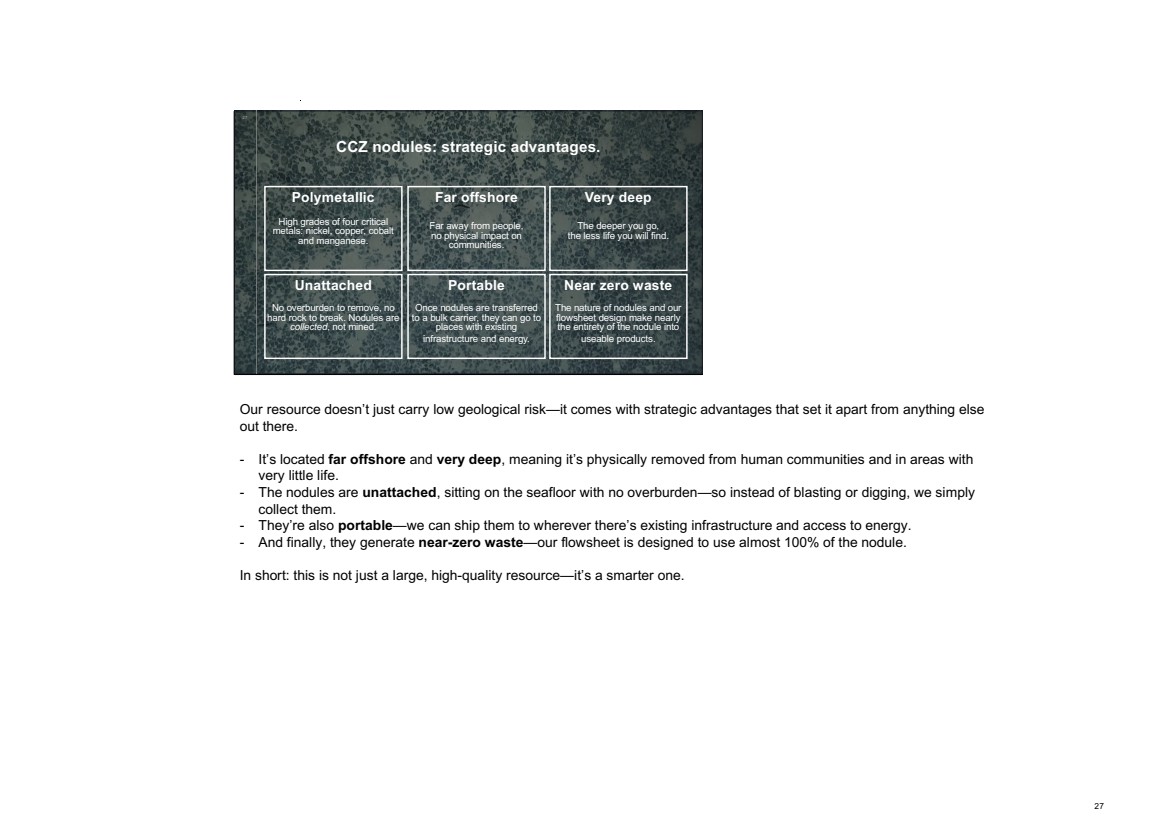
| Our resource doesn’t just carry low geological risk—it comes with strategic advantages that set it apart from anything else out there. - It’s located far offshore and very deep, meaning it’s physically removed from human communities and in areas with very little life. - The nodules are unattached, sitting on the seafloor with no overburden—so instead of blasting or digging, we simply collect them. - They’re also portable—we can ship them to wherever there’s existing infrastructure and access to energy. - And finally, they generate near-zero waste—our flowsheet is designed to use almost 100% of the nodule. In short: this is not just a large, high-quality resource—it’s a smarter one. 27 25 45 70 0 145 255 253 226 83 169 170 174 249 50 0 115 175 210 Master Headline | Arial 25, Bold Headline | Arial 21, Bold BLUE SUBHEAD | Arial 12, all caps Subhead | Arial 16, Bold Body Copy | Arial 14 For Bullets, use - 2727 Polymetallic High grades of four critical metals: nickel, copper, cobalt and manganese. Unattached No overburden to remove, no hard rock to break. Nodules are collected, not mined. Far offshore Far away from people, no physical impact on communities. Very deep The deeper you go, the less life you will find. Portable Once nodules are transferred to a bulk carrier, they can go to places with existing infrastructure and energy. Near zero waste The nature of nodules and our flowsheet design make nearly the entirety of the nodule into useable products. CCZ nodules: strategic advantages. |
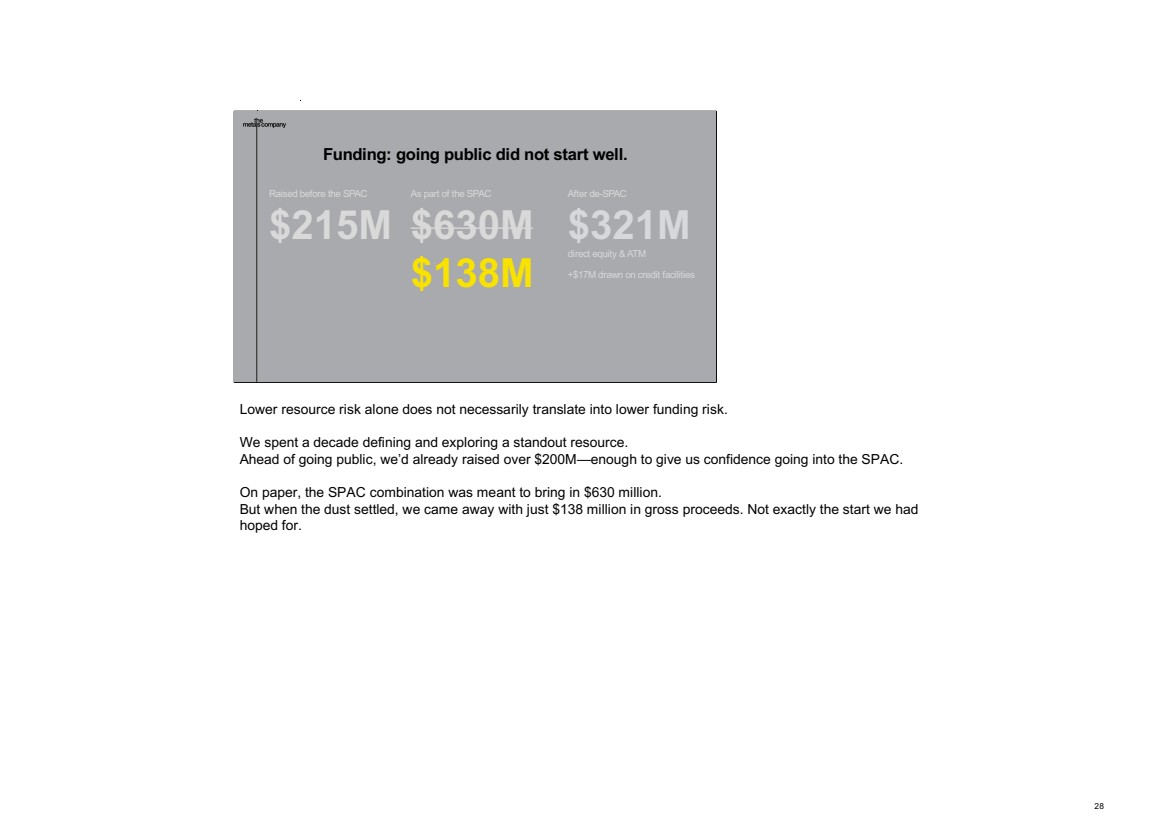
| Lower resource risk alone does not necessarily translate into lower funding risk. We spent a decade defining and exploring a standout resource. Ahead of going public, we’d already raised over $200M—enough to give us confidence going into the SPAC. On paper, the SPAC combination was meant to bring in $630 million. But when the dust settled, we came away with just $138 million in gross proceeds. Not exactly the start we had hoped for. 28 25 45 70 0 145 255 253 226 83 169 170 174 249 50 0 115 175 210 Master Headline | Arial 25, Bold Headline | Arial 21, Bold BLUE SUBHEAD | Arial 12, all caps Subhead | Arial 16, Bold Body Copy | Arial 14 For Bullets, use - 28 Funding: going public did not start well. Raised before the SPAC $215M As part of the SPAC $630M $138M After de-SPAC $321M direct equity & ATM +$17M drawn on credit facilities |
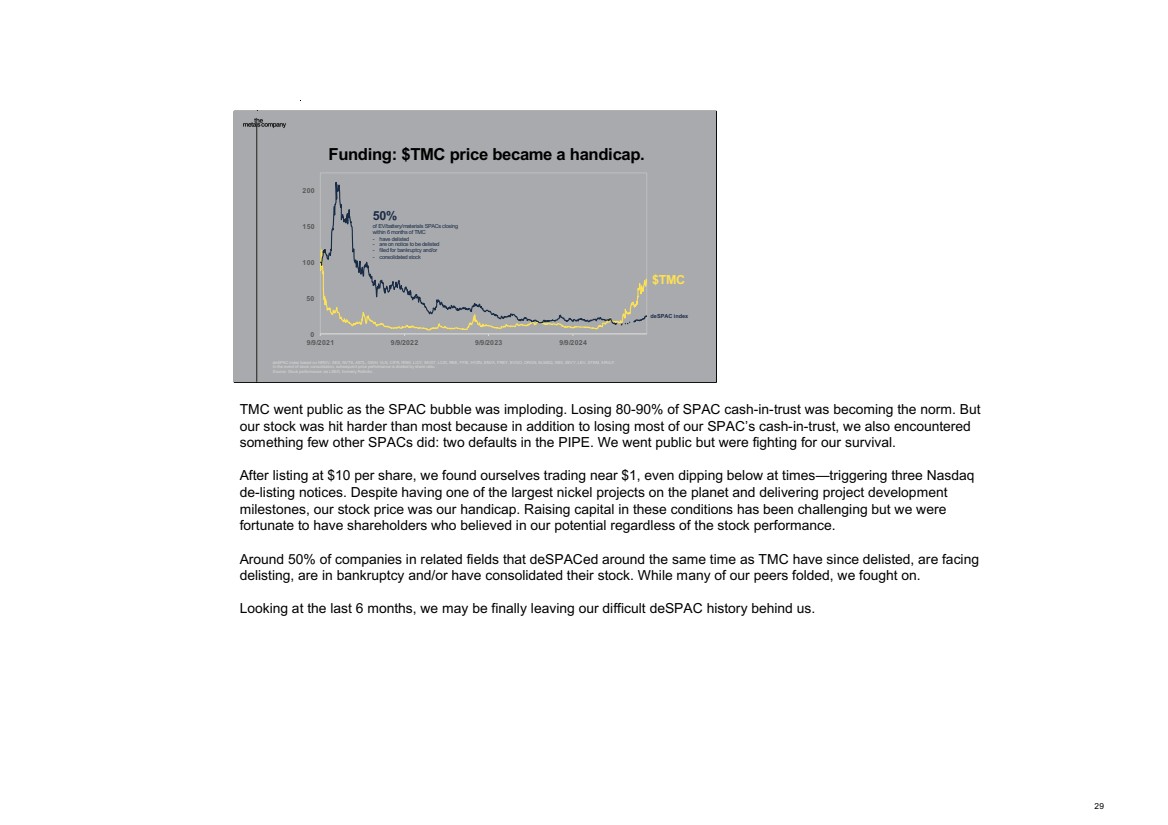
| TMC went public as the SPAC bubble was imploding. Losing 80-90% of SPAC cash-in-trust was becoming the norm. But our stock was hit harder than most because in addition to losing most of our SPAC’s cash-in-trust, we also encountered something few other SPACs did: two defaults in the PIPE. We went public but were fighting for our survival. After listing at $10 per share, we found ourselves trading near $1, even dipping below at times—triggering three Nasdaq de-listing notices. Despite having one of the largest nickel projects on the planet and delivering project development milestones, our stock price was our handicap. Raising capital in these conditions has been challenging but we were fortunate to have shareholders who believed in our potential regardless of the stock performance. Around 50% of companies in related fields that deSPACed around the same time as TMC have since delisted, are facing delisting, are in bankruptcy and/or have consolidated their stock. While many of our peers folded, we fought on. Looking at the last 6 months, we may be finally leaving our difficult deSPAC history behind us. 29 25 45 70 0 145 255 253 226 83 169 170 174 249 50 0 115 175 210 Master Headline | Arial 25, Bold Headline | Arial 21, Bold BLUE SUBHEAD | Arial 12, all caps Subhead | Arial 16, Bold Body Copy | Arial 14 For Bullets, use - 29 Funding: $TMC price became a handicap. deSPAC index $TMC deSPAC index based on NRGV, SES, NVTS, ASTL, GWH, VLN, CIFR, RNW, LICY, MVST, LCID, REE, FFIE, HYZN, ENVX, FREY, EVGO, ORGN, ELMSQ, INDI, ZEVY, LEV, STEM, ARVLF. In the event of stock consolidation, subsequent price performance is divided by share ratio. Source: Stock performance via LSEG, formerly Refinitiv. 0 50 100 150 200 9/9/2021 9/9/2022 9/9/2023 9/9/2024 50% of EV/battery/materials SPACs closing within 6 months of TMC - have delisted - are on notice to be delisted - filed for bankruptcy and/or - consolidated stock |
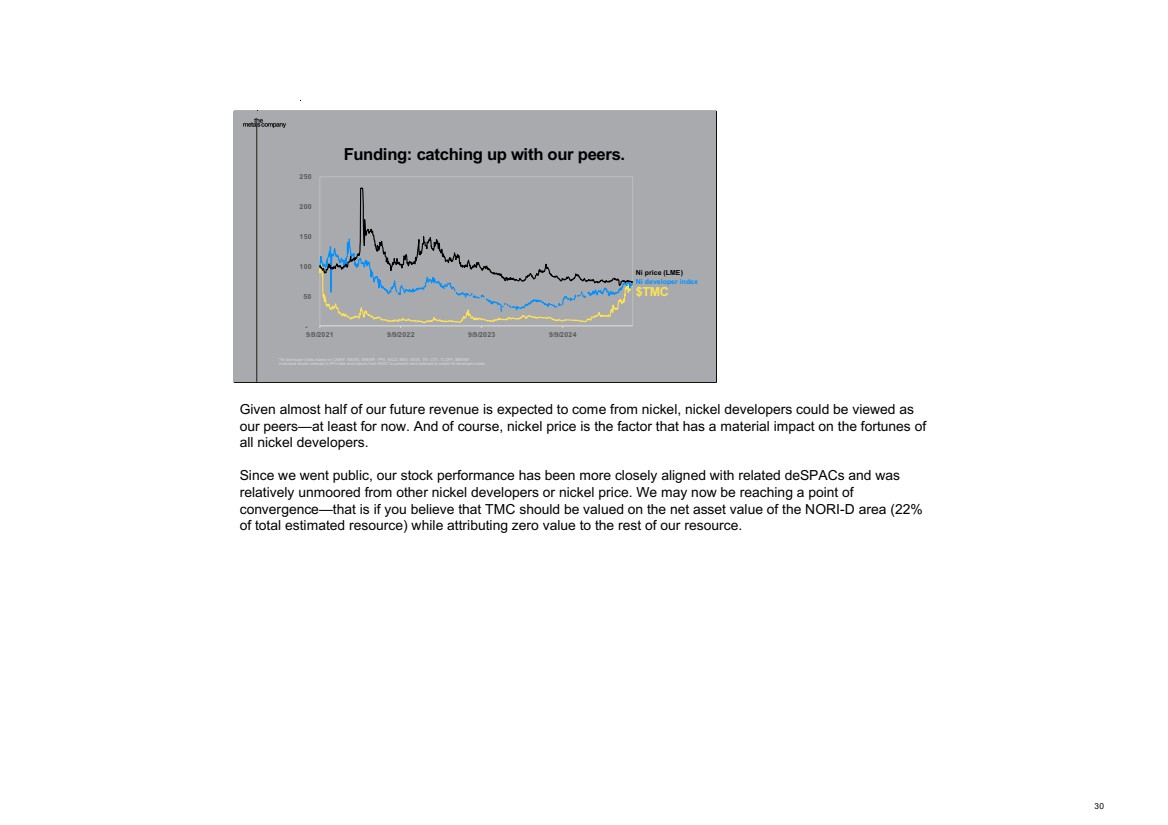
| Given almost half of our future revenue is expected to come from nickel, nickel developers could be viewed as our peers—at least for now. And of course, nickel price is the factor that has a material impact on the fortunes of all nickel developers. Since we went public, our stock performance has been more closely aligned with related deSPACs and was relatively unmoored from other nickel developers or nickel price. We may now be reaching a point of convergence—that is if you believe that TMC should be valued on the net asset value of the NORI-D area (22% of total estimated resource) while attributing zero value to the rest of our resource. 30 25 45 70 0 145 255 253 226 83 169 170 174 249 50 0 115 175 210 Master Headline | Arial 25, Bold Headline | Arial 21, Bold BLUE SUBHEAD | Arial 12, all caps Subhead | Arial 16, Bold Body Copy | Arial 14 For Bullets, use - 30 Funding: catching up with our peers. *Ni developer index based on CNIKF, NEXM, SREMF, FPX, NICU, BSX, GIGA, TN, CTV, TLOFF, BRVMF. Individual stocks indexed to IPO date and indices from 9/9/21 to present were indexed to create Ni-developer index. $TMC Ni developer index Ni price (LME) - 50 100 150 200 250 9/9/2021 9/9/2022 9/9/2023 9/9/2024 |
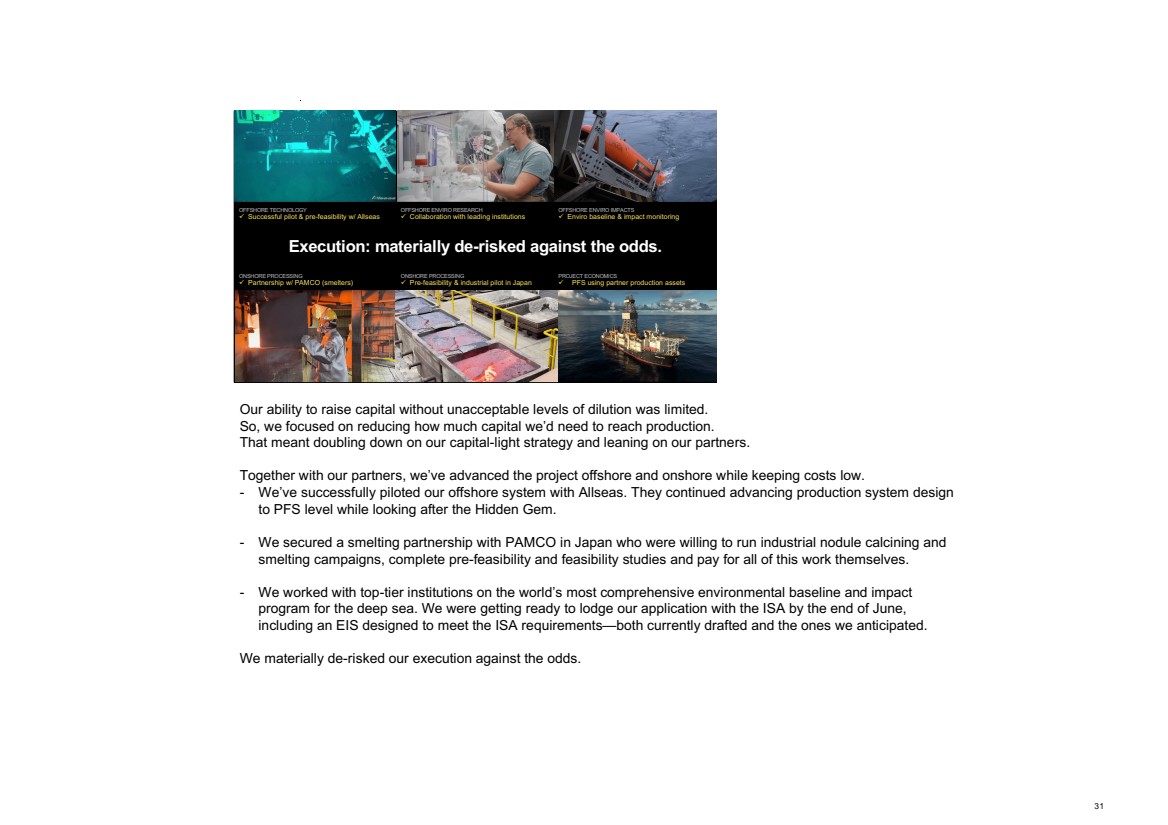
| Our ability to raise capital without unacceptable levels of dilution was limited. So, we focused on reducing how much capital we’d need to reach production. That meant doubling down on our capital-light strategy and leaning on our partners. Together with our partners, we’ve advanced the project offshore and onshore while keeping costs low. - We’ve successfully piloted our offshore system with Allseas. They continued advancing production system design to PFS level while looking after the Hidden Gem. - We secured a smelting partnership with PAMCO in Japan who were willing to run industrial nodule calcining and smelting campaigns, complete pre-feasibility and feasibility studies and pay for all of this work themselves. - We worked with top-tier institutions on the world’s most comprehensive environmental baseline and impact program for the deep sea. We were getting ready to lodge our application with the ISA by the end of June, including an EIS designed to meet the ISA requirements—both currently drafted and the ones we anticipated. We materially de-risked our execution against the odds. 31 25 45 70 0 145 255 253 226 83 169 170 174 249 50 0 115 175 210 Master Headline | Arial 25, Bold Headline | Arial 21, Bold BLUE SUBHEAD | Arial 12, all caps Subhead | Arial 16, Bold Body Copy | Arial 14 For Bullets, use - 31 Source: xxx Execution: materially de-risked against the odds. OFFSHORE ENVIRO RESEARCH ü Collaboration with leading institutions OFFSHORE ENVIRO IMPACTS ü Enviro baseline & impact monitoring PROJECT ECONOMICS ü PFS using partner production assets OFFSHORE TECHNOLOGY ü Successful pilot & pre-feasibility w/ Allseas ONSHORE PROCESSING ü Partnership w/ PAMCO (smelters) ONSHORE PROCESSING ü Pre-feasibility & industrial pilot in Japan |
| While we were adapting to market realities—fighting for equity value and making real progress on limited capital—regulatory uncertainty remained a major drag on our stock price. Despite years of constructive engagement, it became clear by mid-last year that the ISA is unlikely to deliver a Mining Code on a timeline that works for a commercial enterprise. The process wasn’t built for private sector urgency—it was shaped by and for state-backed players who can afford to wait...for decades. After 14 years of paddling upstream, we faced the reality: the ISA was unlikely to deliver. That was a serious disappointment. We needed a plan B. 32 25 45 70 0 145 255 253 226 83 169 170 174 249 50 0 115 175 210 Master Headline | Arial 25, Bold Headline | Arial 21, Bold BLUE SUBHEAD | Arial 12, all caps Subhead | Arial 16, Bold Body Copy | Arial 14 For Bullets, use - 32 Regulatory risk: ISA was a disappointment. |
| The ISA saga did have a silver lining: our enduring partnerships with Nauru and the Kingdom of Tonga. One part of the UNCLOS’ vision always resonated with us—ensuring developing nations benefit from the development of seabed resources in international waters. Our subsidiaries NORI and TOML have long operated in these Pacific island nations, delivering on-the-ground value through local programs. When it became clear that the ISA might not deliver, we realized we didn’t need to wait for permission to fulfil the intent of UNCLOS—we could live it ourselves. We are committed to these partnerships. Our presence—and our impact—on these islands will continue beyond our engagement with the ISA. 33 25 45 70 0 145 255 253 226 83 169 170 174 249 50 0 115 175 210 Master Headline | Arial 25, Bold Headline | Arial 21, Bold BLUE SUBHEAD | Arial 12, all caps Subhead | Arial 16, Bold Body Copy | Arial 14 For Bullets, use - 33 A silver lining? Our friendship with Nauru & Tonga. |
| While the ISA continued to drift, we turned our attention to the one jurisdiction with a fully developed legal framework for seabed mining beyond national waters: the United States. The U.S. regime has been in place since 1989 under the Deep Seabed Hard Mineral Resources Act. But for decades, it sat largely unused, overshadowed by uncertainty around U.S. ratification of UNCLOS. After thorough legal review—and bolstered by recent U.S. policy shifts in support of critical minerals—we realized this wasn’t just our fallback. The pivot from ISA to USA was not a plan B. It became the plan. 34 25 45 70 0 145 255 253 226 83 169 170 174 249 50 0 115 175 210 Master Headline | Arial 25, Bold Headline | Arial 21, Bold BLUE SUBHEAD | Arial 12, all caps Subhead | Arial 16, Bold Body Copy | Arial 14 For Bullets, use - 34 ü Deep Seabed Hard Mineral Resources Act or DSHMRA (1980) ü DSHMRA implementing regulations for exploration licenses (1981) ü DSHMRA implementing regulations for commercial recovery permits (1989) ü Executive Order “Unleashing America’s Offshore Critical Minerals and Resources (April 2025) ü Revisions to DSHMRA implementing regulations (July 2025) ü United Nations Convention on the Law of the Sea or UNCLOS (1980) ü UNCLOS Part XI Implementing Agreement (1994) ü Exploration Regulations for Polymetallic Nodules (2000, amended 2009) ü Exploitation Regulations for Polymetallic Nodules ü Standards & Guidelines for Polymetallic Nodules Pivot from ISA to USA. |
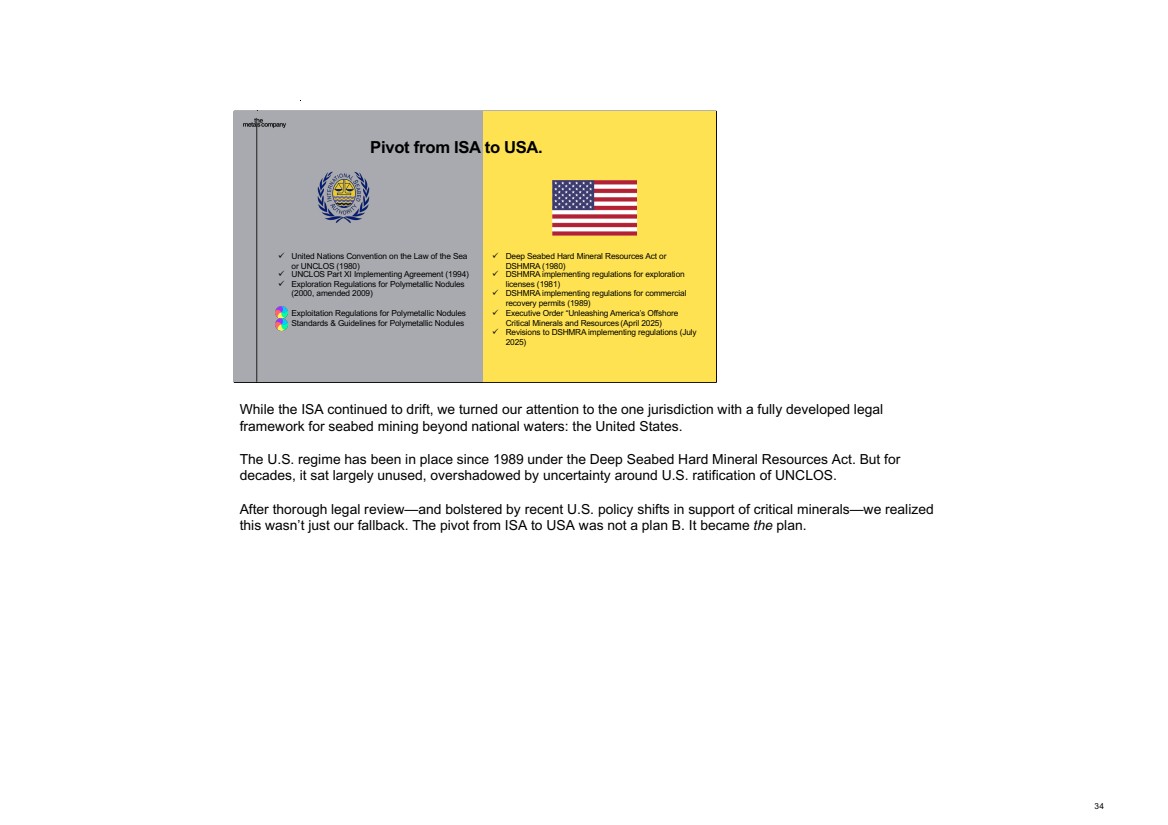
| In response to the Executive Order tasking the Department of Commerce to expedite the permitting of offshore mineral projects, NOOA published revisions to their regulations in July for public comment. While some level of uncertainty will remain about the final version of these regulations until the fall, based on our reading of the regulations, we believe we will be looking at about 2-year permitting process. This means that if we take the risk and start deploying capital to get our first production system ready now, we could be collecting nodules during this administration—subject to TMC USA securing the permit at the end of this 2-year process. 35 25 45 70 0 145 255 253 226 83 169 170 174 249 50 0 115 175 210 Master Headline | Arial 25, Bold Headline | Arial 21, Bold BLUE SUBHEAD | Arial 12, all caps Subhead | Arial 16, Bold Body Copy | Arial 14 For Bullets, use - 35 STEP Q1 Q2 Q3 Q4 Q5 Q6 Q7 Q8 Q9 Q10 App submission Full compliance Certification Public comment Draft EIS / TCRs Public comment Public hearing [Formal hearing] Final EIS / TCRs Public comment Public hearing [Formal hearing] Applicant review of TCRs permit issuance Firm process step Can be reduced Potential requirement / delay Compressed by 30 days As-is, no formal hearings Formal hearing – final EIS 2 formal hearings (Q11.5) Likely 2-year permitting process. |
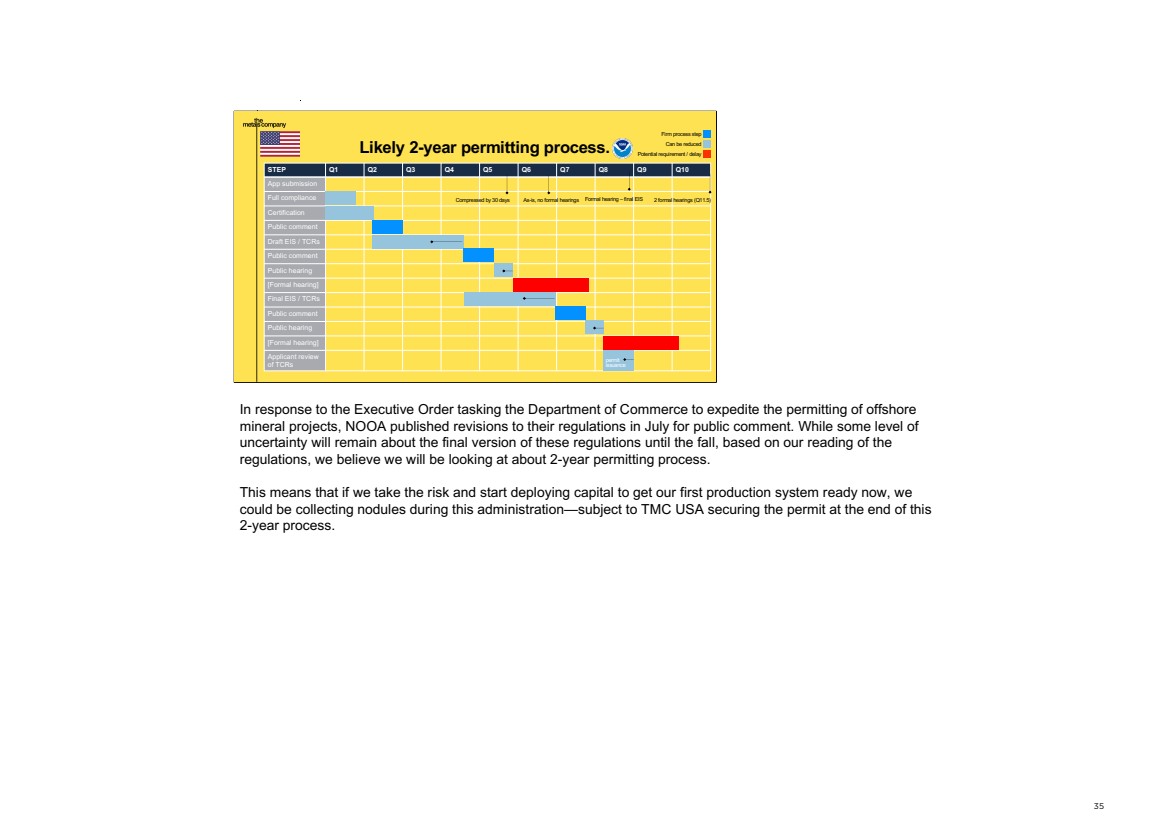
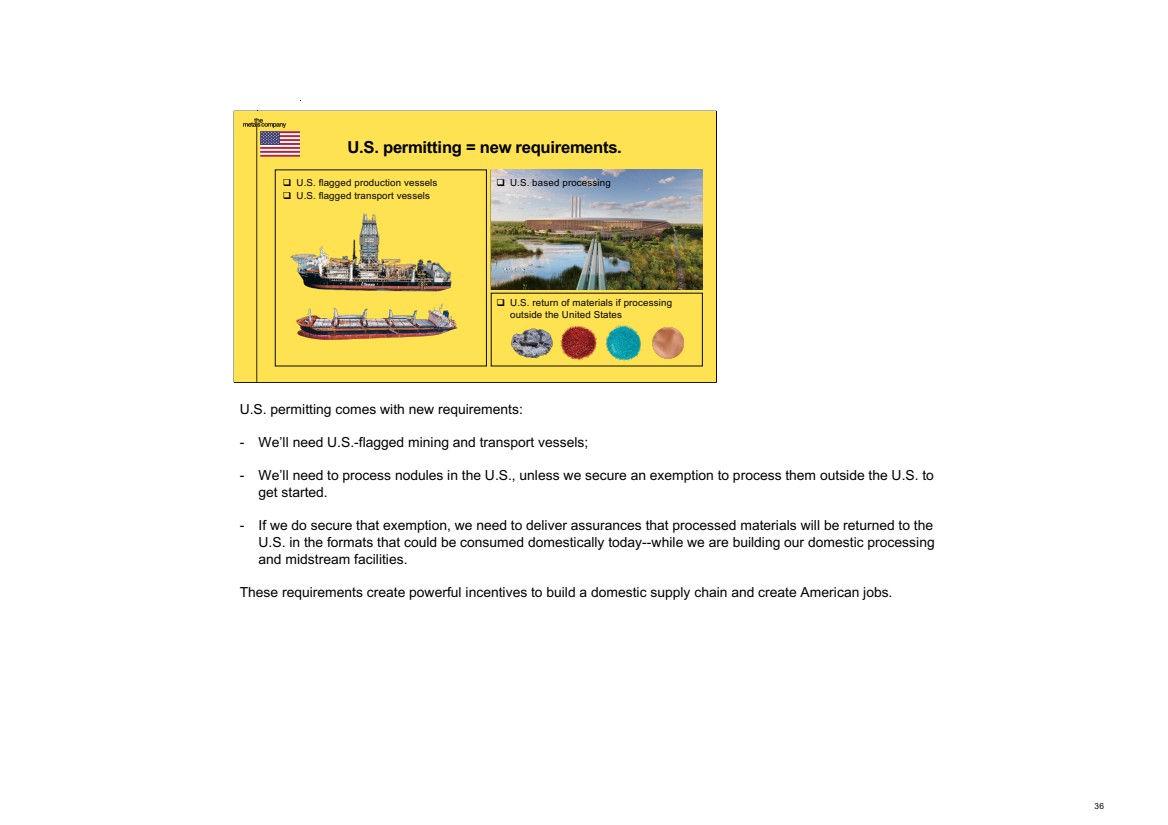
| U.S. permitting comes with new requirements: - We’ll need U.S.-flagged mining and transport vessels; - We’ll need to process nodules in the U.S., unless we secure an exemption to process them outside the U.S. to get started. - If we do secure that exemption, we need to deliver assurances that processed materials will be returned to the U.S. in the formats that could be consumed domestically today--while we are building our domestic processing and midstream facilities. These requirements create powerful incentives to build a domestic supply chain and create American jobs. 36 25 45 70 0 145 255 253 226 83 169 170 174 249 50 0 115 175 210 Master Headline | Arial 25, Bold Headline | Arial 21, Bold BLUE SUBHEAD | Arial 12, all caps Subhead | Arial 16, Bold Body Copy | Arial 14 For Bullets, use - 36 U.S. permitting = new requirements. q U.S. flagged production vessels q U.S. flagged transport vessels q U.S. return of materials if processing outside the United States q U.S. based processing |
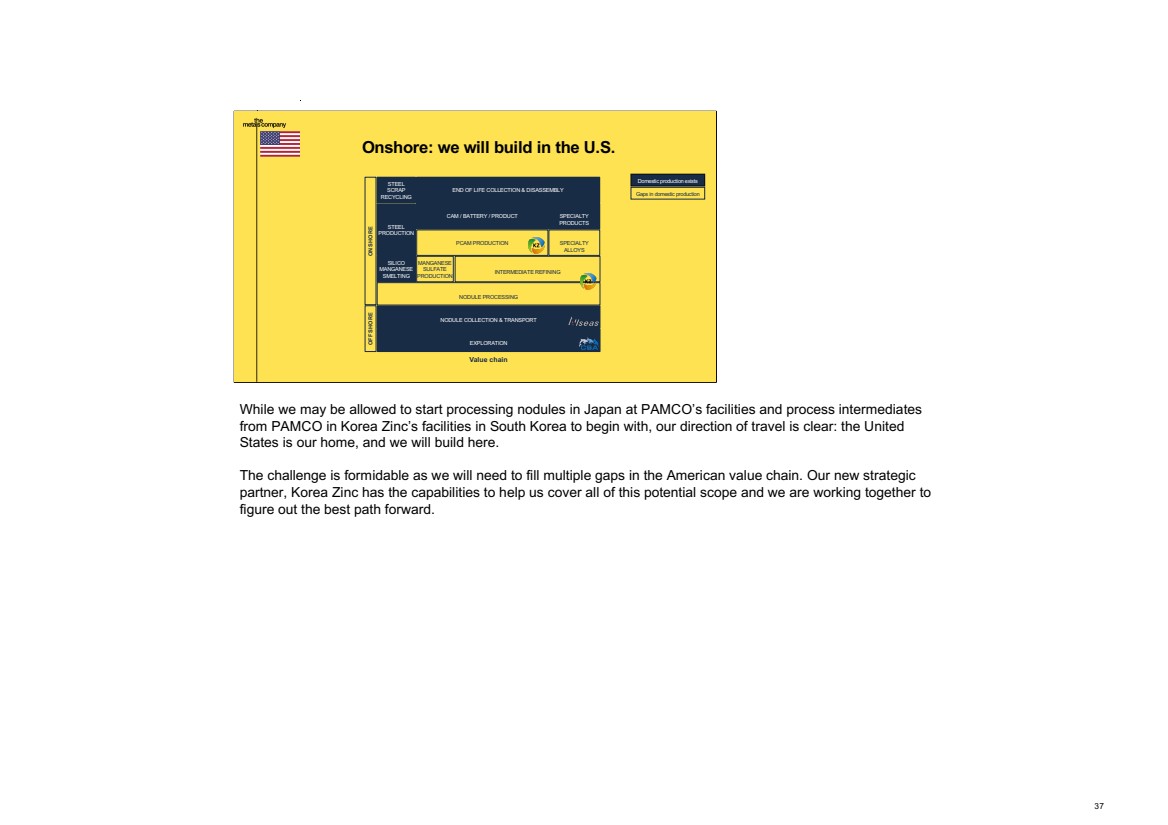
| While we may be allowed to start processing nodules in Japan at PAMCO’s facilities and process intermediates from PAMCO in Korea Zinc’s facilities in South Korea to begin with, our direction of travel is clear: the United States is our home, and we will build here. The challenge is formidable as we will need to fill multiple gaps in the American value chain. Our new strategic partner, Korea Zinc has the capabilities to help us cover all of this potential scope and we are working together to figure out the best path forward. 37 25 45 70 0 145 255 253 226 83 169 170 174 249 50 0 115 175 210 Master Headline | Arial 25, Bold Headline | Arial 21, Bold BLUE SUBHEAD | Arial 12, all caps Subhead | Arial 16, Bold Body Copy | Arial 14 For Bullets, use - 37 Onshore: we will build in the U.S. EXPLORATION NODULE COLLECTION & TRANSPORT INTERMEDIATE REFINING SILICO MANGANESE SMELTING MANGANESE SULFATE PRODUCTION PCAM PRODUCTION SPECIALTY ALLOYS STEEL PRODUCTION CAM / BATTERY / PRODUCT SPECIALTY PRODUCTS STEEL SCRAP RECYCLING END OF LIFE COLLECTION & DISASSEMBLY NODULE PROCESSING Value chain OFFSHORE ONSHORE Domestic production exists Gaps in domestic production |
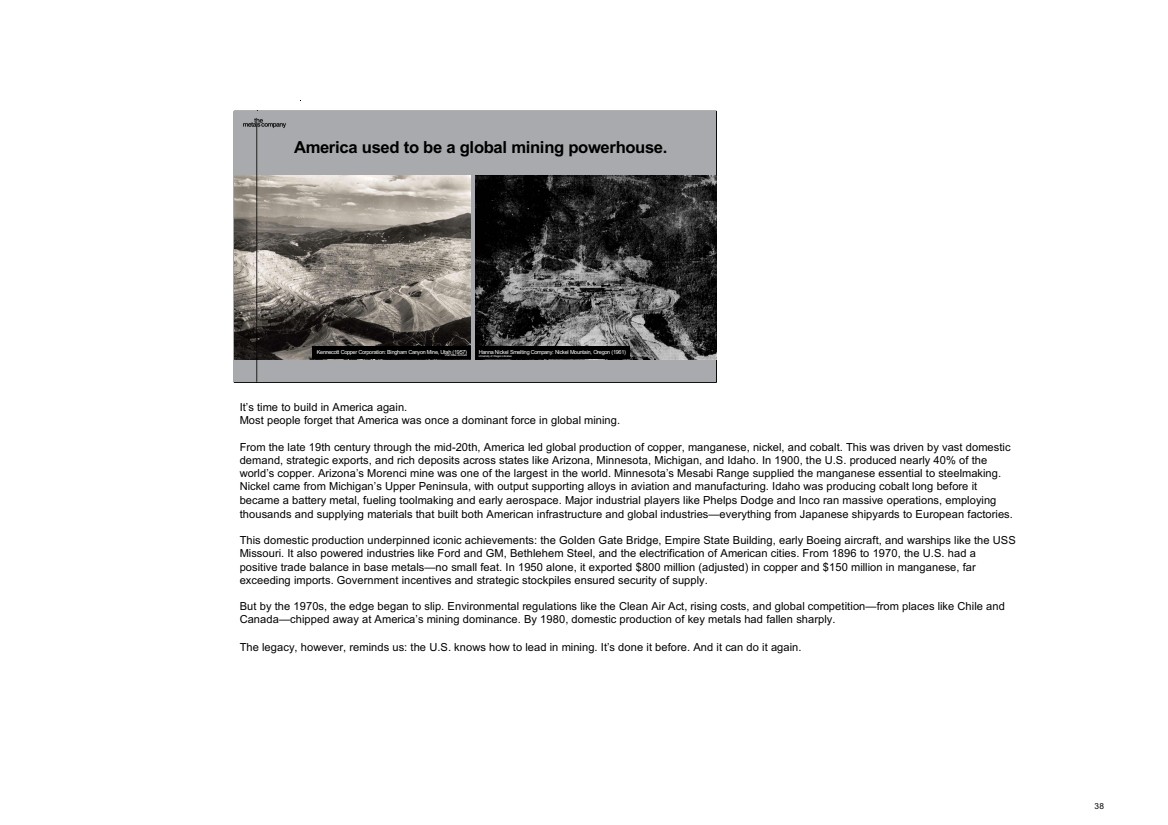
| It’s time to build in America again. Most people forget that America was once a dominant force in global mining. From the late 19th century through the mid-20th, America led global production of copper, manganese, nickel, and cobalt. This was driven by vast domestic demand, strategic exports, and rich deposits across states like Arizona, Minnesota, Michigan, and Idaho. In 1900, the U.S. produced nearly 40% of the world’s copper. Arizona’s Morenci mine was one of the largest in the world. Minnesota’s Mesabi Range supplied the manganese essential to steelmaking. Nickel came from Michigan’s Upper Peninsula, with output supporting alloys in aviation and manufacturing. Idaho was producing cobalt long before it became a battery metal, fueling toolmaking and early aerospace. Major industrial players like Phelps Dodge and Inco ran massive operations, employing thousands and supplying materials that built both American infrastructure and global industries—everything from Japanese shipyards to European factories. This domestic production underpinned iconic achievements: the Golden Gate Bridge, Empire State Building, early Boeing aircraft, and warships like the USS Missouri. It also powered industries like Ford and GM, Bethlehem Steel, and the electrification of American cities. From 1896 to 1970, the U.S. had a positive trade balance in base metals—no small feat. In 1950 alone, it exported $800 million (adjusted) in copper and $150 million in manganese, far exceeding imports. Government incentives and strategic stockpiles ensured security of supply. But by the 1970s, the edge began to slip. Environmental regulations like the Clean Air Act, rising costs, and global competition—from places like Chile and Canada—chipped away at America’s mining dominance. By 1980, domestic production of key metals had fallen sharply. The legacy, however, reminds us: the U.S. knows how to lead in mining. It’s done it before. And it can do it again. 38 25 45 70 0 145 255 253 226 83 169 170 174 249 50 0 115 175 210 Master Headline | Arial 25, Bold Headline | Arial 21, Bold BLUE SUBHEAD | Arial 12, all caps Subhead | Arial 16, Bold Body Copy | Arial 14 For Bullets, use - 38 America used to be a global mining powerhouse. Kennecott Copper Corporation: Bingham Canyon Mine, Utah (1957) Utah State Archives Hanna Nickel Smelting Company: Nickel Mountain, Oregon (1961) University of Oregon Libraries |
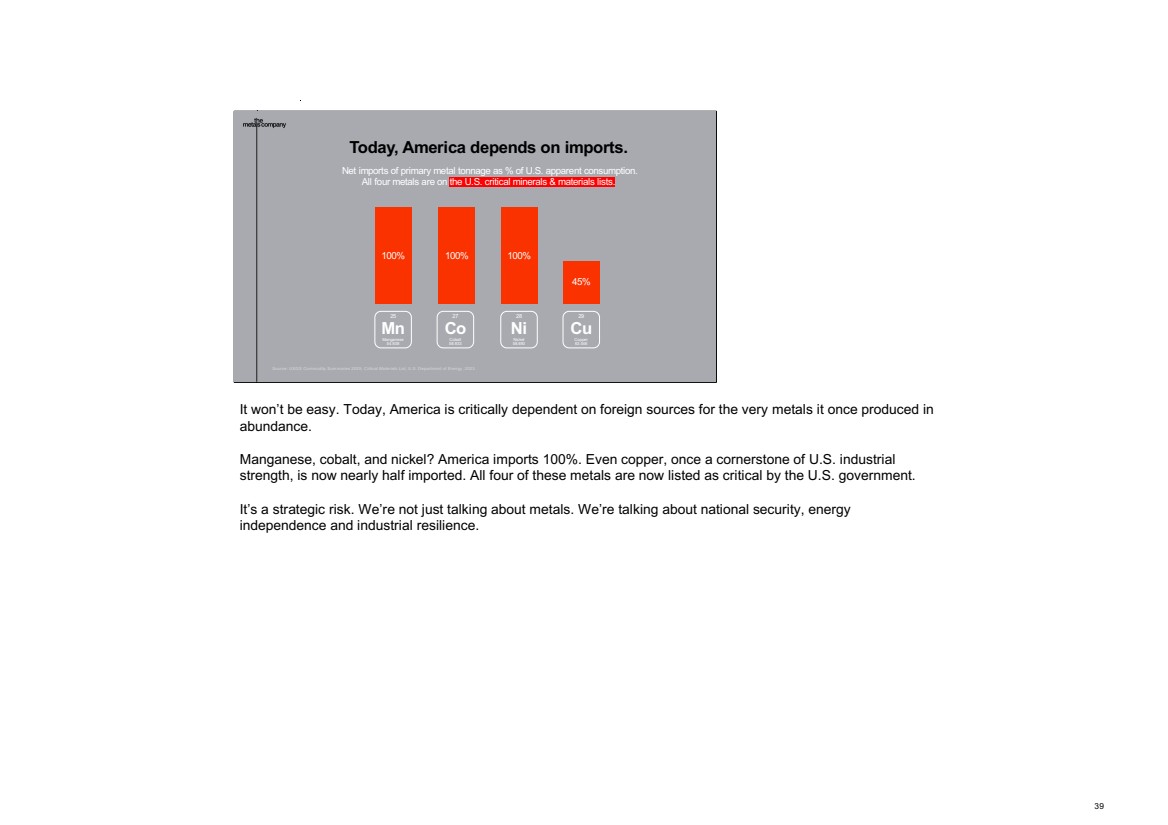
| It won’t be easy. Today, America is critically dependent on foreign sources for the very metals it once produced in abundance. Manganese, cobalt, and nickel? America imports 100%. Even copper, once a cornerstone of U.S. industrial strength, is now nearly half imported. All four of these metals are now listed as critical by the U.S. government. It’s a strategic risk. We’re not just talking about metals. We’re talking about national security, energy independence and industrial resilience. 39 25 45 70 0 145 255 253 226 83 169 170 174 249 50 0 115 175 210 Master Headline | Arial 25, Bold Headline | Arial 21, Bold BLUE SUBHEAD | Arial 12, all caps Subhead | Arial 16, Bold Body Copy | Arial 14 For Bullets, use - 39 Today, America depends on imports. Source: USGS Commodity Summaries 2025; Critical Materials List, U.S. Department of Energy, 2023 Net imports of primary metal tonnage as % of U.S. apparent consumption. All four metals are on the U.S. critical minerals & materials lists. 100% 25 Mn Manganese 54.938 27 Co Cobalt 58.933 100% 28 Ni Nickel 58.693 100% 29 Cu Copper 63.546 45% |
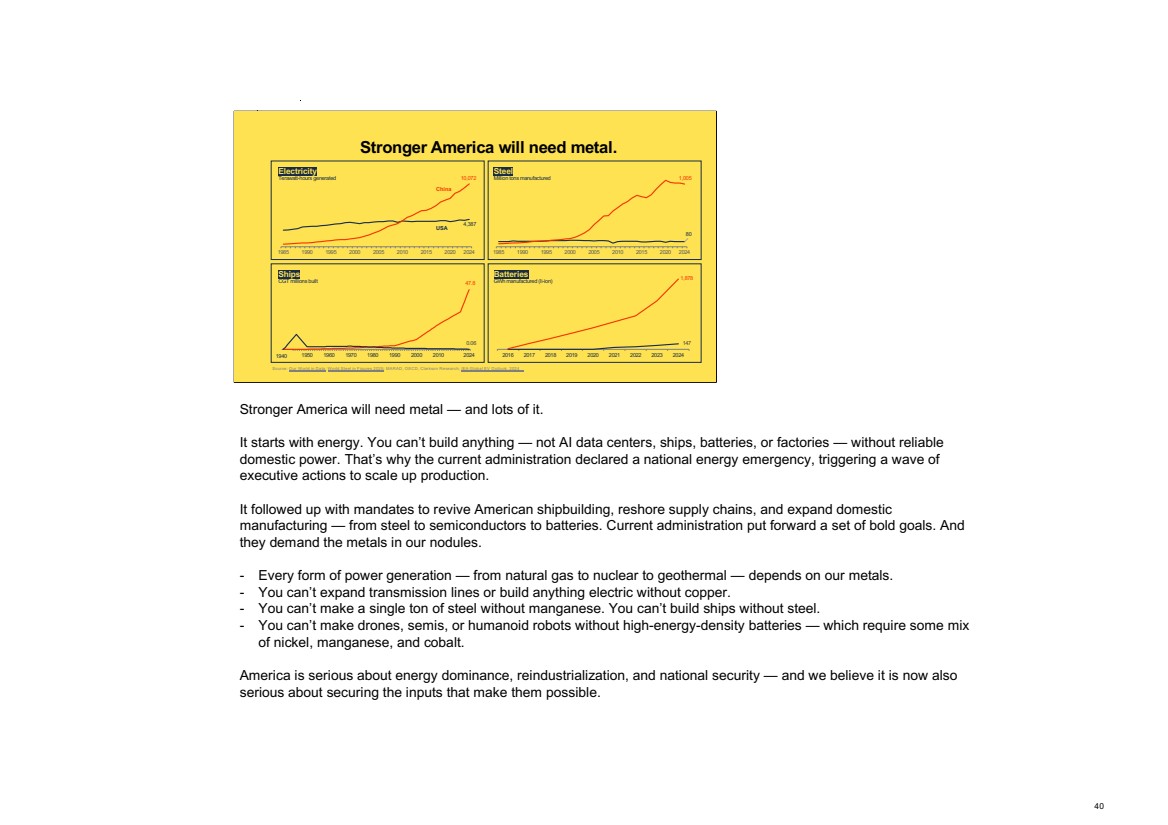
| Stronger America will need metal — and lots of it. It starts with energy. You can’t build anything — not AI data centers, ships, batteries, or factories — without reliable domestic power. That’s why the current administration declared a national energy emergency, triggering a wave of executive actions to scale up production. It followed up with mandates to revive American shipbuilding, reshore supply chains, and expand domestic manufacturing — from steel to semiconductors to batteries. Current administration put forward a set of bold goals. And they demand the metals in our nodules. - Every form of power generation — from natural gas to nuclear to geothermal — depends on our metals. - You can’t expand transmission lines or build anything electric without copper. - You can’t make a single ton of steel without manganese. You can’t build ships without steel. - You can’t make drones, semis, or humanoid robots without high-energy-density batteries — which require some mix of nickel, manganese, and cobalt. America is serious about energy dominance, reindustrialization, and national security — and we believe it is now also serious about securing the inputs that make them possible. 40 25 45 70 0 145 255 253 226 83 169 170 174 249 50 0 115 175 210 Master Headline | Arial 25, Bold Headline | Arial 21, Bold BLUE SUBHEAD | Arial 12, all caps Subhead | Arial 16, Bold Body Copy | Arial 14 For Bullets, use - 40 Stronger America will need metal. Source: Our World in Data; World Steel in Figures 2025; MARAD, OECD, Clarkson Research; IEA Global EV Outlook, 2024 4,387 10,072 1985 1990 1995 2000 2005 2010 2015 2020 2024 80 1,005 1985 1990 1995 2000 2005 2010 2015 2020 2024 Electricity Terawatt-hours generated Steel Million tons manufactured Ships CGT millions built 47.8 0.06 Year 1940 1950 1960 1970 1980 1990 2000 2010 2024 147 1,878 1940 2016 2017 2018 2019 2020 2021 2022 2023 2024 China USA Batteries GWh manufactured (li-ion) |
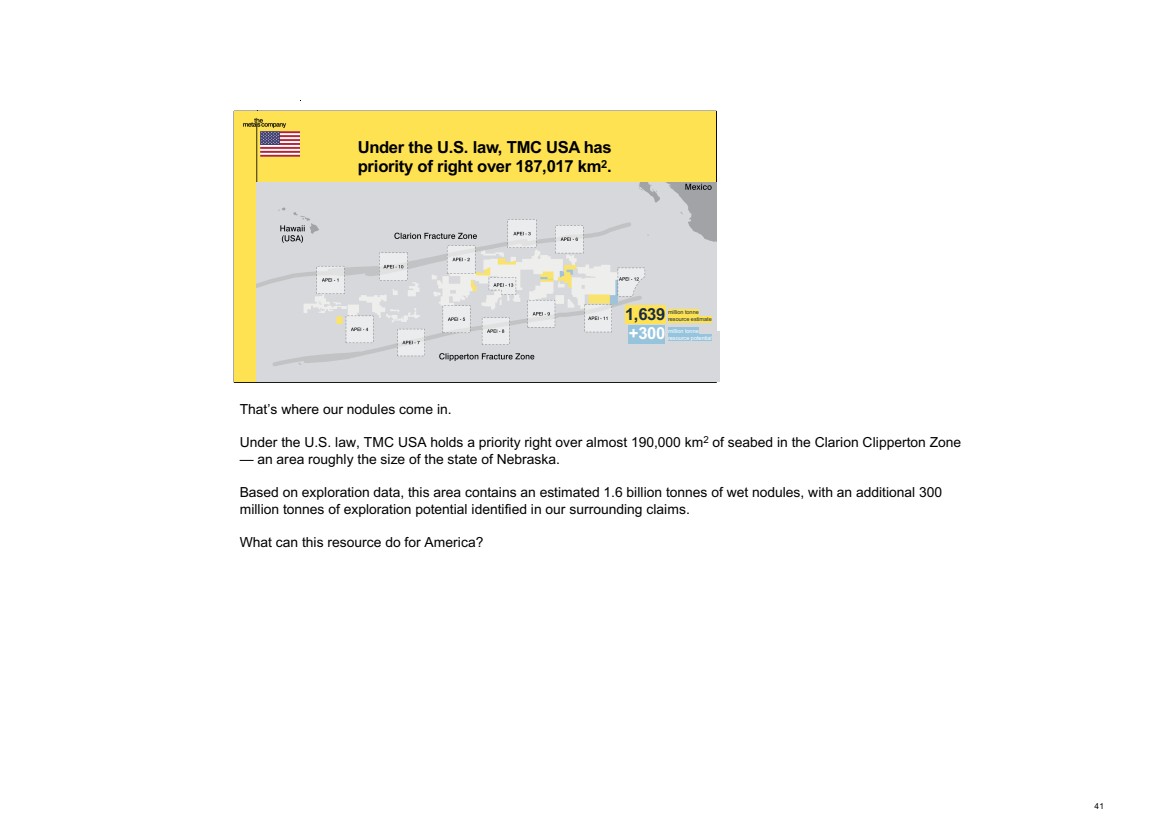
| That’s where our nodules come in. Under the U.S. law, TMC USA holds a priority right over almost 190,000 km2 of seabed in the Clarion Clipperton Zone — an area roughly the size of the state of Nebraska. Based on exploration data, this area contains an estimated 1.6 billion tonnes of wet nodules, with an additional 300 million tonnes of exploration potential identified in our surrounding claims. What can this resource do for America? 41 25 45 70 0 145 255 253 226 83 169 170 174 249 50 0 115 175 210 Master Headline | Arial 25, Bold Headline | Arial 21, Bold BLUE SUBHEAD | Arial 12, all caps Subhead | Arial 16, Bold Body Copy | Arial 14 For Bullets, use - 41 Under the U.S. law, TMC USA has priority of right over 187,017 km2. 1,639 +300 million tonne resource estimate million tonne resource potential |
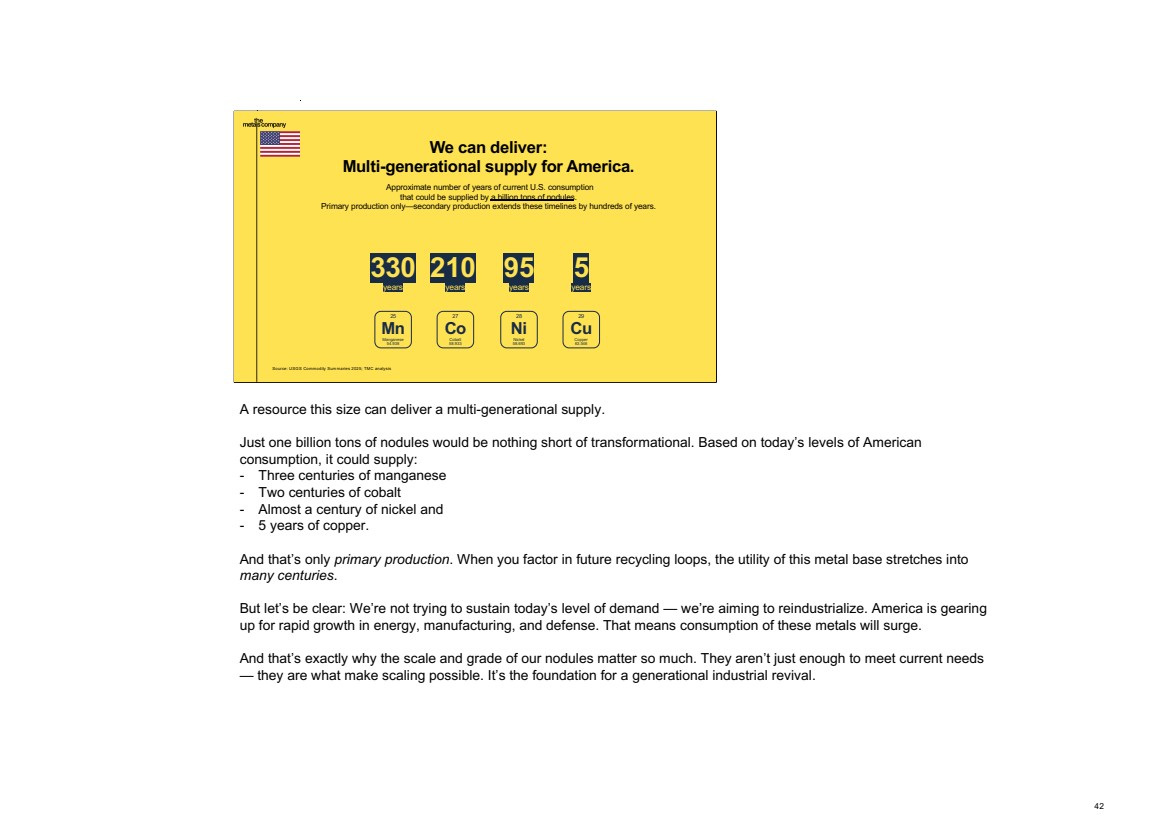
| A resource this size can deliver a multi-generational supply. Just one billion tons of nodules would be nothing short of transformational. Based on today’s levels of American consumption, it could supply: - Three centuries of manganese - Two centuries of cobalt - Almost a century of nickel and - 5 years of copper. And that’s only primary production. When you factor in future recycling loops, the utility of this metal base stretches into many centuries. But let’s be clear: We’re not trying to sustain today’s level of demand — we’re aiming to reindustrialize. America is gearing up for rapid growth in energy, manufacturing, and defense. That means consumption of these metals will surge. And that’s exactly why the scale and grade of our nodules matter so much. They aren’t just enough to meet current needs — they are what make scaling possible. It’s the foundation for a generational industrial revival. 42 25 45 70 0 145 255 253 226 83 169 170 174 249 50 0 115 175 210 Master Headline | Arial 25, Bold Headline | Arial 21, Bold BLUE SUBHEAD | Arial 12, all caps Subhead | Arial 16, Bold Body Copy | Arial 14 For Bullets, use - 42 We can deliver: Multi-generational supply for America. 330 years Source: USGS Commodity Summaries 2025; TMC analysis 95 years 210years 5 years 25 Mn Manganese 54.938 27 Co Cobalt 58.933 28 Ni Nickel 58.693 29 Cu Copper 63.546 Approximate number of years of current U.S. consumption that could be supplied by a billion tons of nodules. Primary production only—secondary production extends these timelines by hundreds of years. |
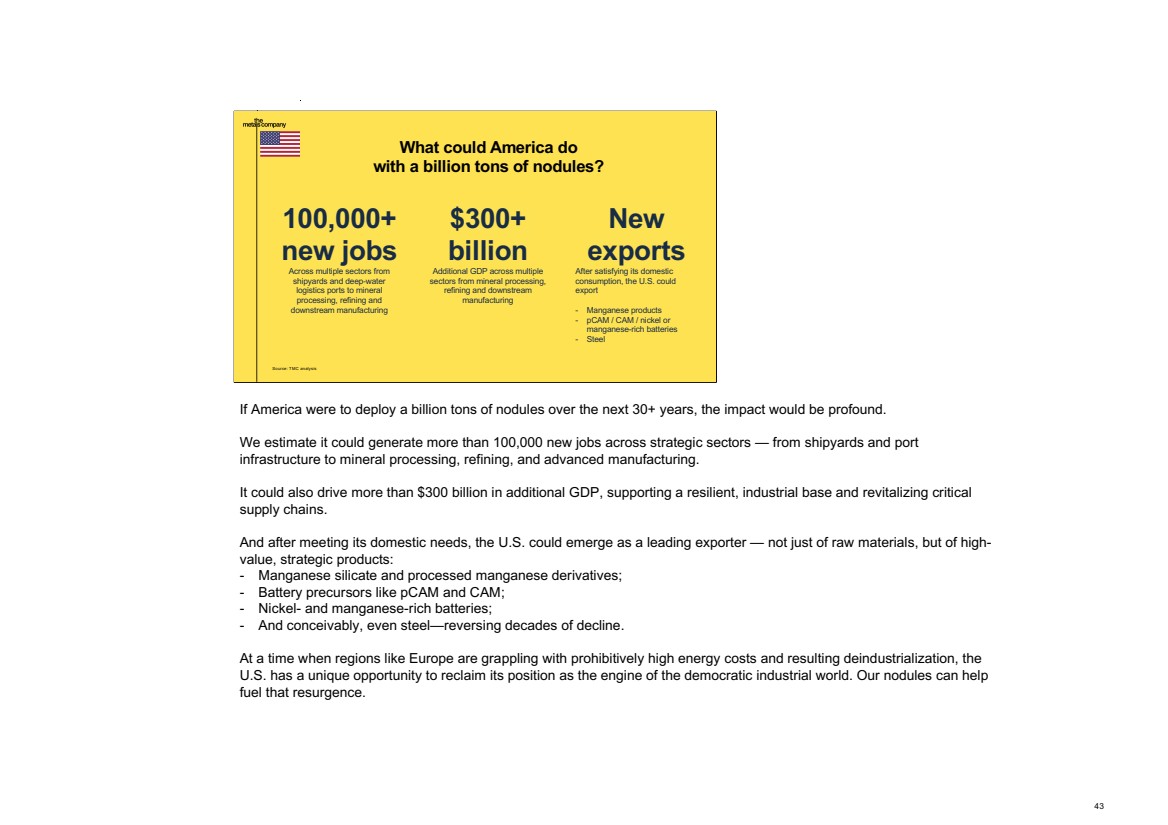
| If America were to deploy a billion tons of nodules over the next 30+ years, the impact would be profound. We estimate it could generate more than 100,000 new jobs across strategic sectors — from shipyards and port infrastructure to mineral processing, refining, and advanced manufacturing. It could also drive more than $300 billion in additional GDP, supporting a resilient, industrial base and revitalizing critical supply chains. And after meeting its domestic needs, the U.S. could emerge as a leading exporter — not just of raw materials, but of high-value, strategic products: - Manganese silicate and processed manganese derivatives; - Battery precursors like pCAM and CAM; - Nickel- and manganese-rich batteries; - And conceivably, even steel—reversing decades of decline. At a time when regions like Europe are grappling with prohibitively high energy costs and resulting deindustrialization, the U.S. has a unique opportunity to reclaim its position as the engine of the democratic industrial world. Our nodules can help fuel that resurgence. 43 25 45 70 0 145 255 253 226 83 169 170 174 249 50 0 115 175 210 Master Headline | Arial 25, Bold Headline | Arial 21, Bold BLUE SUBHEAD | Arial 12, all caps Subhead | Arial 16, Bold Body Copy | Arial 14 For Bullets, use - 43 100,000+ new jobs Across multiple sectors from shipyards and deep-water logistics ports to mineral processing, refining and downstream manufacturing New exports After satisfying its domestic consumption, the U.S. could export - Manganese products - pCAM / CAM / nickel or manganese-rich batteries - Steel $300+ billion Additional GDP across multiple sectors from mineral processing, refining and downstream manufacturing Source: TMC analysis What could America do with a billion tons of nodules? |
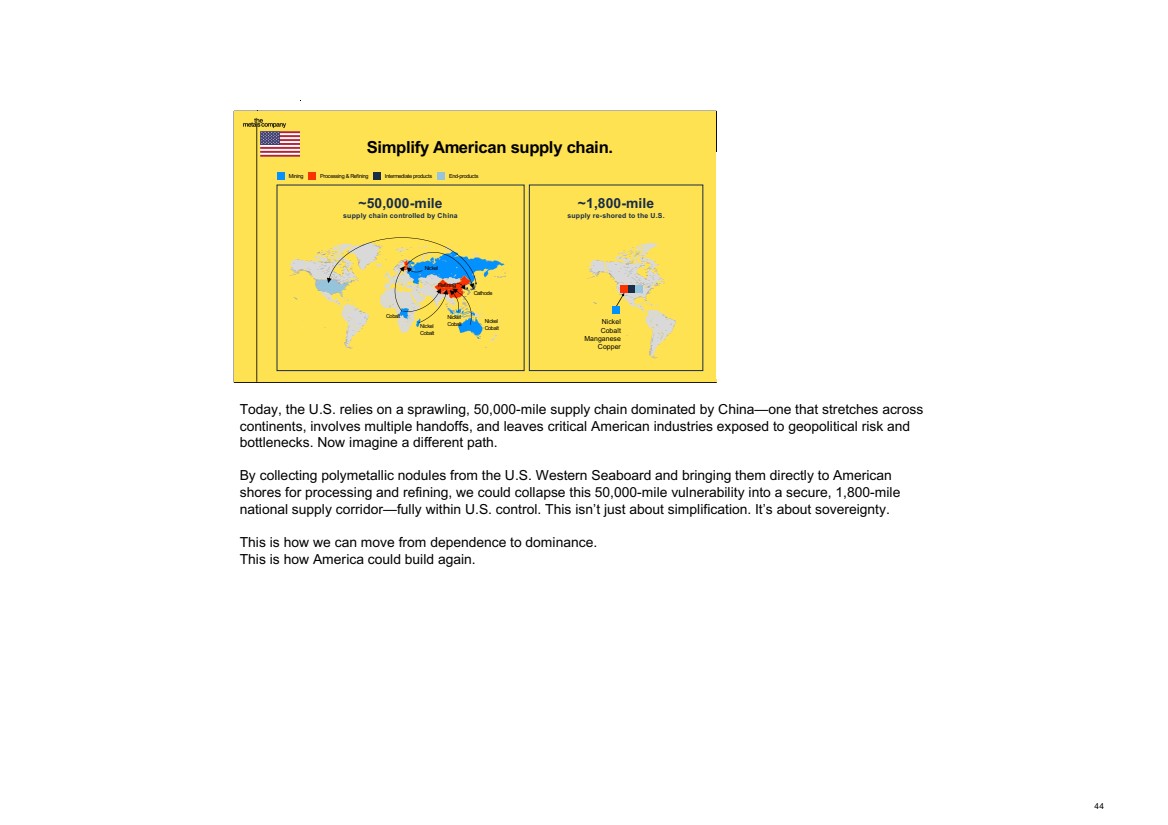
| Today, the U.S. relies on a sprawling, 50,000-mile supply chain dominated by China—one that stretches across continents, involves multiple handoffs, and leaves critical American industries exposed to geopolitical risk and bottlenecks. Now imagine a different path. By collecting polymetallic nodules from the U.S. Western Seaboard and bringing them directly to American shores for processing and refining, we could collapse this 50,000-mile vulnerability into a secure, 1,800-mile national supply corridor—fully within U.S. control. This isn’t just about simplification. It’s about sovereignty. This is how we can move from dependence to dominance. This is how America could build again. 44 25 45 70 0 145 255 253 226 83 169 170 174 249 50 0 115 175 210 Master Headline | Arial 25, Bold Headline | Arial 21, Bold BLUE SUBHEAD | Arial 12, all caps Subhead | Arial 16, Bold Body Copy | Arial 14 For Bullets, use - 44 ~50,000-mile supply chain controlled by China Mining Processing & Refining Intermediate products End-products Nickel Cobalt Cobalt Nickel Cobalt Nickel Cobalt Nickel Cathode Refining ~1,800-mile supply re-shored to the U.S. Nickel Cobalt Manganese Copper Simplify American supply chain. |
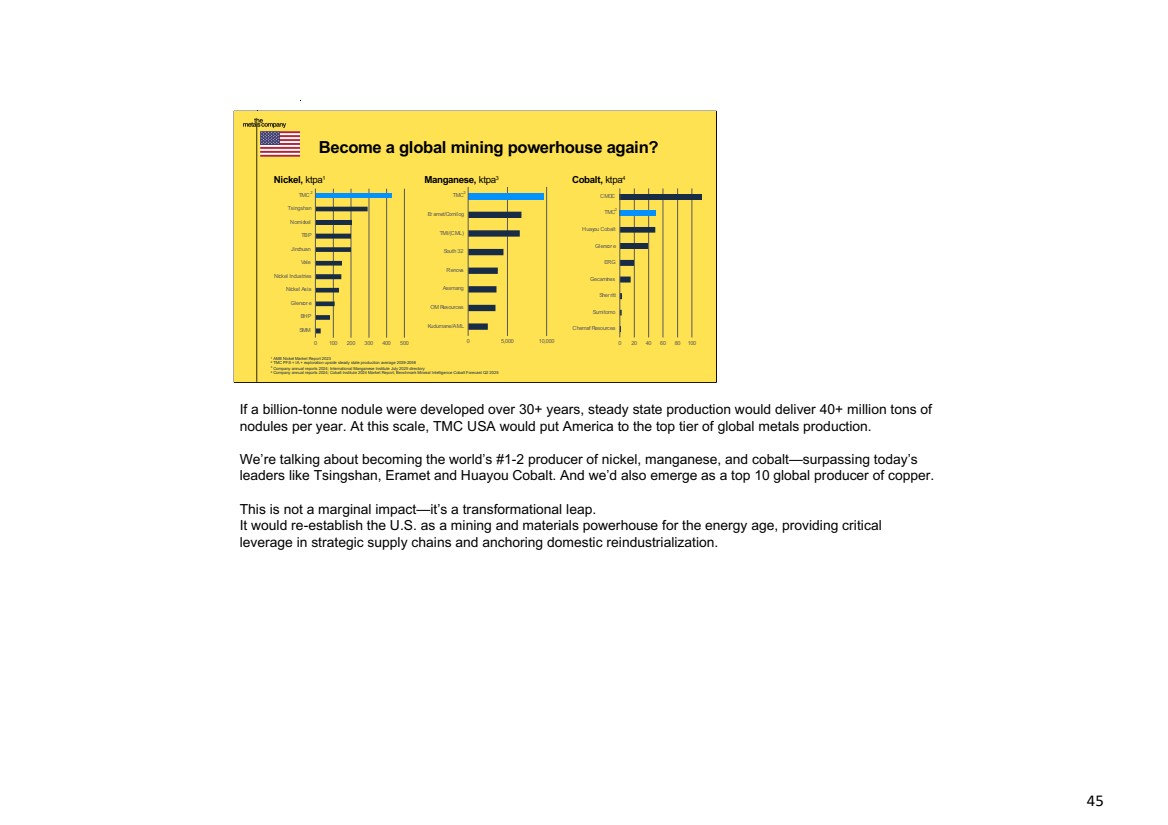
| If a billion-tonne nodule were developed over 30+ years, steady state production would deliver 40+ million tons of nodules per year. At this scale, TMC USA would put America to the top tier of global metals production. We’re talking about becoming the world’s #1-2 producer of nickel, manganese, and cobalt—surpassing today’s leaders like Tsingshan, Eramet and Huayou Cobalt. And we’d also emerge as a top 10 global producer of copper. This is not a marginal impact—it’s a transformational leap. It would re-establish the U.S. as a mining and materials powerhouse for the energy age, providing critical leverage in strategic supply chains and anchoring domestic reindustrialization. 45 25 45 70 0 145 255 253 226 83 169 170 174 249 50 0 115 175 210 Master Headline | Arial 25, Bold Headline | Arial 21, Bold BLUE SUBHEAD | Arial 12, all caps Subhead | Arial 16, Bold Body Copy | Arial 14 For Bullets, use - 45 Nickel, ktpa1 2 Manganese, ktpa3 Become a global mining powerhouse again? 0 100 200 300 400 500 SMM BHP Glencor e Nickel Asia Nickel Industries Vale Jinchuan TBP Nornickel Tsingshan TMC 0 5,000 10,000 Kudumane/AML OM Resources Assmang Renova South 32 TMI/(CML) Er amet/Comilog TMC2 Cobalt, ktpa4 0 20 40 60 80 100 Chemaf Resources Sumitomo Sher ritt Gecamines ERG Glencor e Huayou Cobalt TMC CMOC 2 ------------------------------------------------------------------------------------ Mn: Eramet – 6,800 kt Mn https://www.eramet.com/en/news/eramet-confirms-its-resilience-and-successfully-delivers-on-its-strategic-roadmap/ South32 – 4,500kt Mn slide 18 in https://www.listcorp.com/asx/s32/south32- limited/news/2024-full-year-financial-results-3076162.html TMI/ConsMin – 6,600 kt Mn IMnI July 2025 Mn directory Assmang – 3,600kt https://www.assmang.co.za/assmang-manganese-ore/ OM Holdings – 3,500kt https://www.listcorp.com/asx/omh/om-holdings-limited/news/2024-annual-report-3181159.html Renova – 3,800kt IMnI July 2025 Mn directory Kudumane – 2,500 kt IMnI July 2025 Mn directory 1 AME Nickel Market Report 2023 2 TMC PFS + IA + exploration upside steady state production average 2039-2058 3 Company annual reports 2024; International Manganese Institute July 2025 directory 4 Company annual reports 2024; Cobalt Institute 2024 Market Report; Benchmark Mineral Intelligence Cobalt Forecast Q2 2025 |
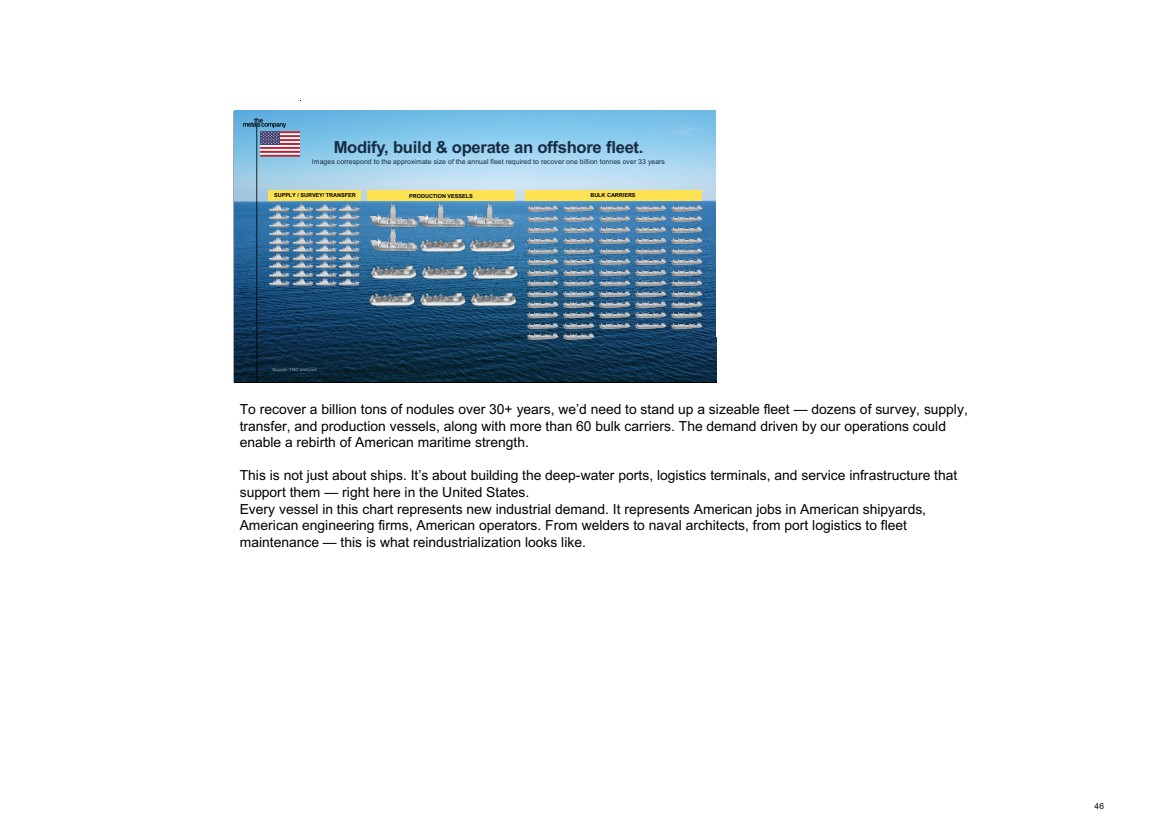
| To recover a billion tons of nodules over 30+ years, we’d need to stand up a sizeable fleet — dozens of survey, supply, transfer, and production vessels, along with more than 60 bulk carriers. The demand driven by our operations could enable a rebirth of American maritime strength. This is not just about ships. It’s about building the deep-water ports, logistics terminals, and service infrastructure that support them — right here in the United States. Every vessel in this chart represents new industrial demand. It represents American jobs in American shipyards, American engineering firms, American operators. From welders to naval architects, from port logistics to fleet maintenance — this is what reindustrialization looks like. 46 25 45 70 0 145 255 253 226 83 169 170 174 249 50 0 115 175 210 Master Headline | Arial 25, Bold Headline | Arial 21, Bold BLUE SUBHEAD | Arial 12, all caps Subhead | Arial 16, Bold Body Copy | Arial 14 For Bullets, use - 46 Modify, build & operate an offshore fleet. Images correspond to the approximate size of the annual fleet required to recover one billion tonnes over 33 years SUPPLY / SURVEY/ TRANSFER PRODUCTION VESSELS BULK CARRIERS Source: TMC analysis ------------------------------------------------------- Assuming 43 Mtpa for PFS+IA+EU during steady period 2039-2058 - 12 production vessels - 14 transfer vessels - 38 supply & survey vessels - 62 bulk carriers |
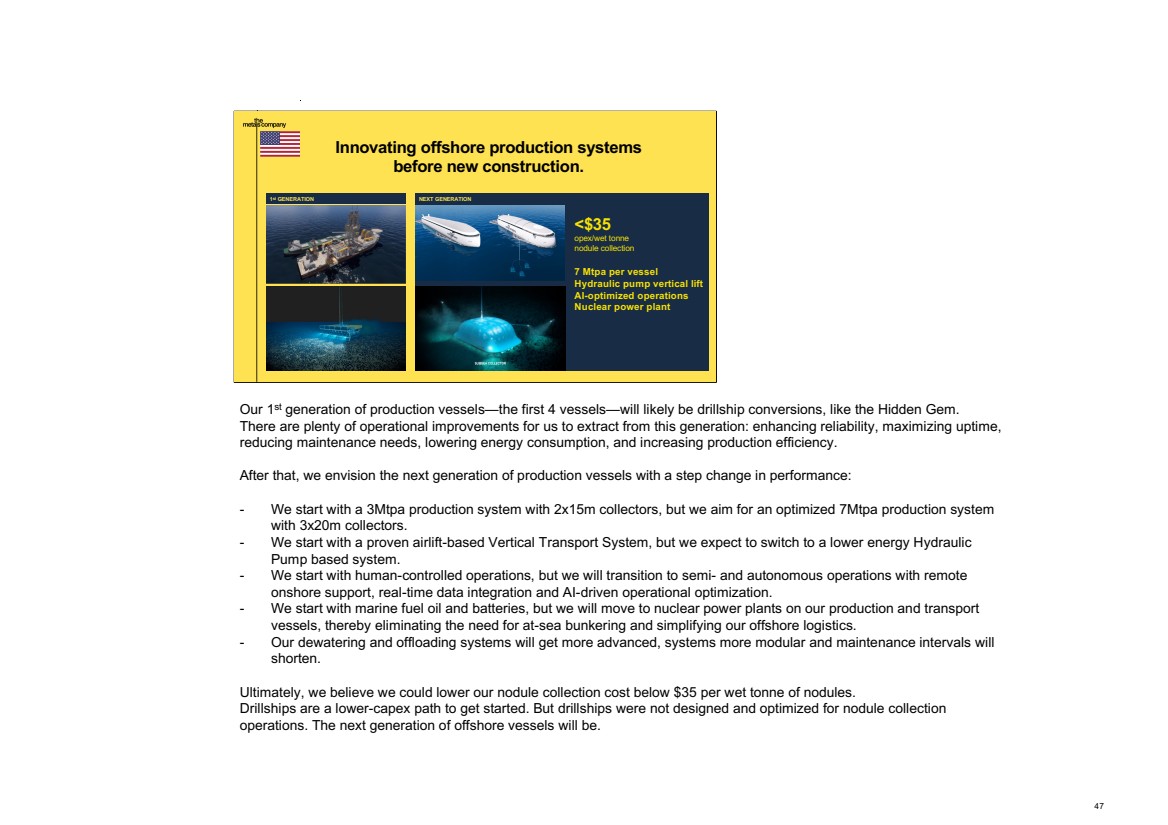
| Our 1st generation of production vessels—the first 4 vessels—will likely be drillship conversions, like the Hidden Gem. There are plenty of operational improvements for us to extract from this generation: enhancing reliability, maximizing uptime, reducing maintenance needs, lowering energy consumption, and increasing production efficiency. After that, we envision the next generation of production vessels with a step change in performance: - We start with a 3Mtpa production system with 2x15m collectors, but we aim for an optimized 7Mtpa production system with 3x20m collectors. - We start with a proven airlift-based Vertical Transport System, but we expect to switch to a lower energy Hydraulic Pump based system. - We start with human-controlled operations, but we will transition to semi- and autonomous operations with remote onshore support, real-time data integration and AI-driven operational optimization. - We start with marine fuel oil and batteries, but we will move to nuclear power plants on our production and transport vessels, thereby eliminating the need for at-sea bunkering and simplifying our offshore logistics. - Our dewatering and offloading systems will get more advanced, systems more modular and maintenance intervals will shorten. Ultimately, we believe we could lower our nodule collection cost below $35 per wet tonne of nodules. Drillships are a lower-capex path to get started. But drillships were not designed and optimized for nodule collection operations. The next generation of offshore vessels will be. 47 25 45 70 0 145 255 253 226 83 169 170 174 249 50 0 115 175 210 Master Headline | Arial 25, Bold Headline | Arial 21, Bold BLUE SUBHEAD | Arial 12, all caps Subhead | Arial 16, Bold Body Copy | Arial 14 For Bullets, use - 47 Innovating offshore production systems before new construction. <$35 opex/wet tonne nodule collection 7 Mtpa per vessel Hydraulic pump vertical lift AI-optimized operations Nuclear power plant 1st GENERATION NEXT GENERATION |
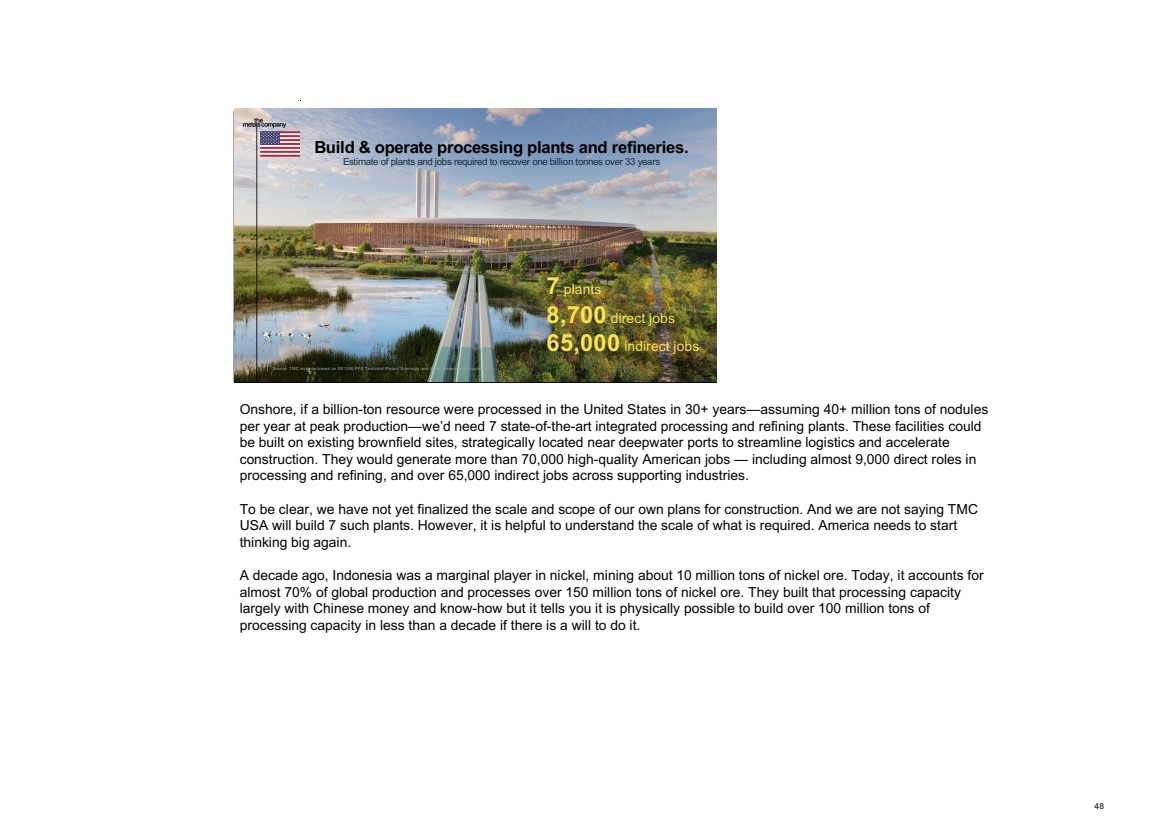
| Onshore, if a billion-ton resource were processed in the United States in 30+ years—assuming 40+ million tons of nodules per year at peak production—we’d need 7 state-of-the-art integrated processing and refining plants. These facilities could be built on existing brownfield sites, strategically located near deepwater ports to streamline logistics and accelerate construction. They would generate more than 70,000 high-quality American jobs — including almost 9,000 direct roles in processing and refining, and over 65,000 indirect jobs across supporting industries. To be clear, we have not yet finalized the scale and scope of our own plans for construction. And we are not saying TMC USA will build 7 such plants. However, it is helpful to understand the scale of what is required. America needs to start thinking big again. A decade ago, Indonesia was a marginal player in nickel, mining about 10 million tons of nickel ore. Today, it accounts for almost 70% of global production and processes over 150 million tons of nickel ore. They built that processing capacity largely with Chinese money and know-how but it tells you it is physically possible to build over 100 million tons of processing capacity in less than a decade if there is a will to do it. 48 25 45 70 0 145 255 253 226 83 169 170 174 249 50 0 115 175 210 Master Headline | Arial 25, Bold Headline | Arial 21, Bold BLUE SUBHEAD | Arial 12, all caps Subhead | Arial 16, Bold Body Copy | Arial 14 For Bullets, use - 48 Build & operate processing plants and refineries. Estimate of plants and jobs required to recover one billion tonnes over 33 years 7 plants 8,700 direct jobs 65,000 indirect jobs Source: TMC analysis based on SK1300 PFS Technical Report Summary and Initial Assessment, August 2025 |
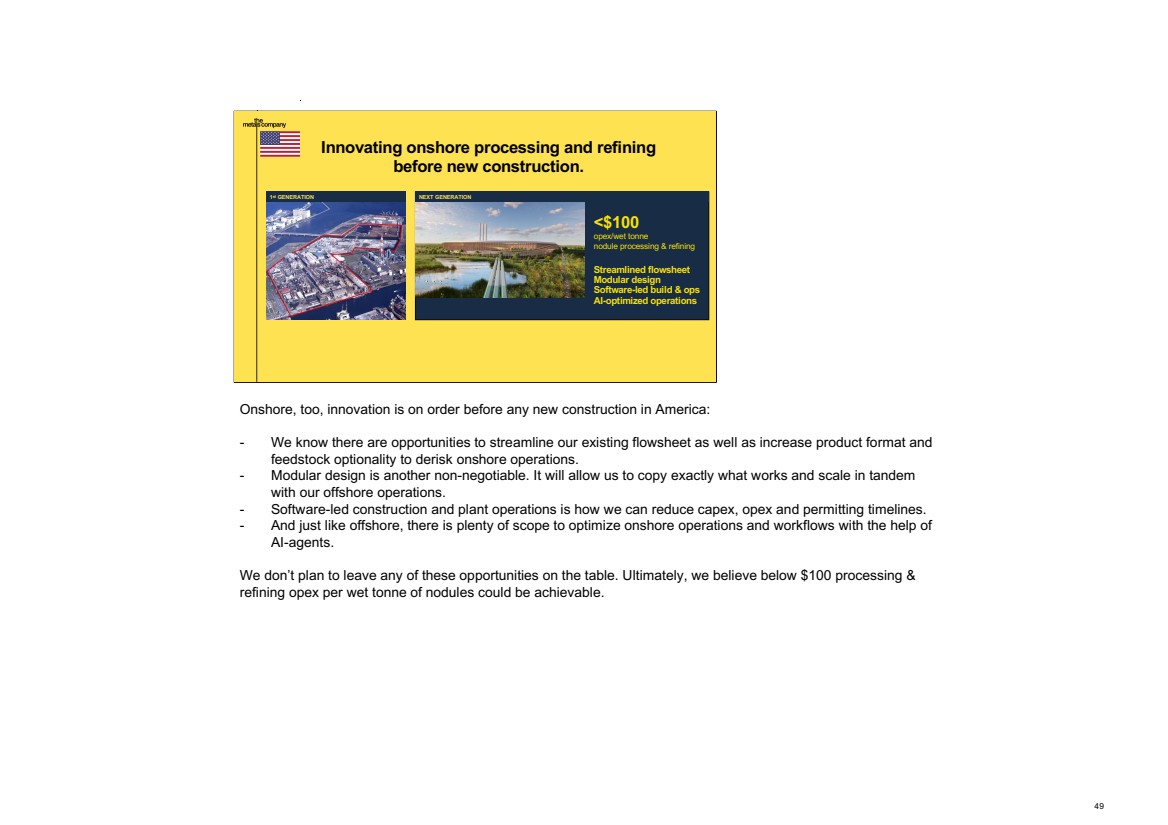
| Onshore, too, innovation is on order before any new construction in America: - We know there are opportunities to streamline our existing flowsheet as well as increase product format and feedstock optionality to derisk onshore operations. - Modular design is another non-negotiable. It will allow us to copy exactly what works and scale in tandem with our offshore operations. - Software-led construction and plant operations is how we can reduce capex, opex and permitting timelines. - And just like offshore, there is plenty of scope to optimize onshore operations and workflows with the help of AI-agents. We don’t plan to leave any of these opportunities on the table. Ultimately, we believe below $100 processing & refining opex per wet tonne of nodules could be achievable. 49 25 45 70 0 145 255 253 226 83 169 170 174 249 50 0 115 175 210 Master Headline | Arial 25, Bold Headline | Arial 21, Bold BLUE SUBHEAD | Arial 12, all caps Subhead | Arial 16, Bold Body Copy | Arial 14 For Bullets, use - 49 <$100 opex/wet tonne nodule processing & refining Streamlined flowsheet Modular design Software-led build & ops AI-optimized operations 1st GENERATION NEXT GENERATION Innovating onshore processing and refining before new construction. |
| Several years ago, as a private company, we worked with the naval and industrial designers at BIG to conceptualize what the next generation of operations could look like. Here is a video that may no longer capture all of the details of our current thinking, but it certainly captures our direction of travel. 50 25 45 70 0 145 255 253 226 83 169 170 174 249 50 0 115 175 210 Master Headline | Arial 25, Bold Headline | Arial 21, Bold BLUE SUBHEAD | Arial 12, all caps Subhead | Arial 16, Bold Body Copy | Arial 14 For Bullets, use - 50 Video: https://vimeo.com/1106731880/1907565031?share=copy |
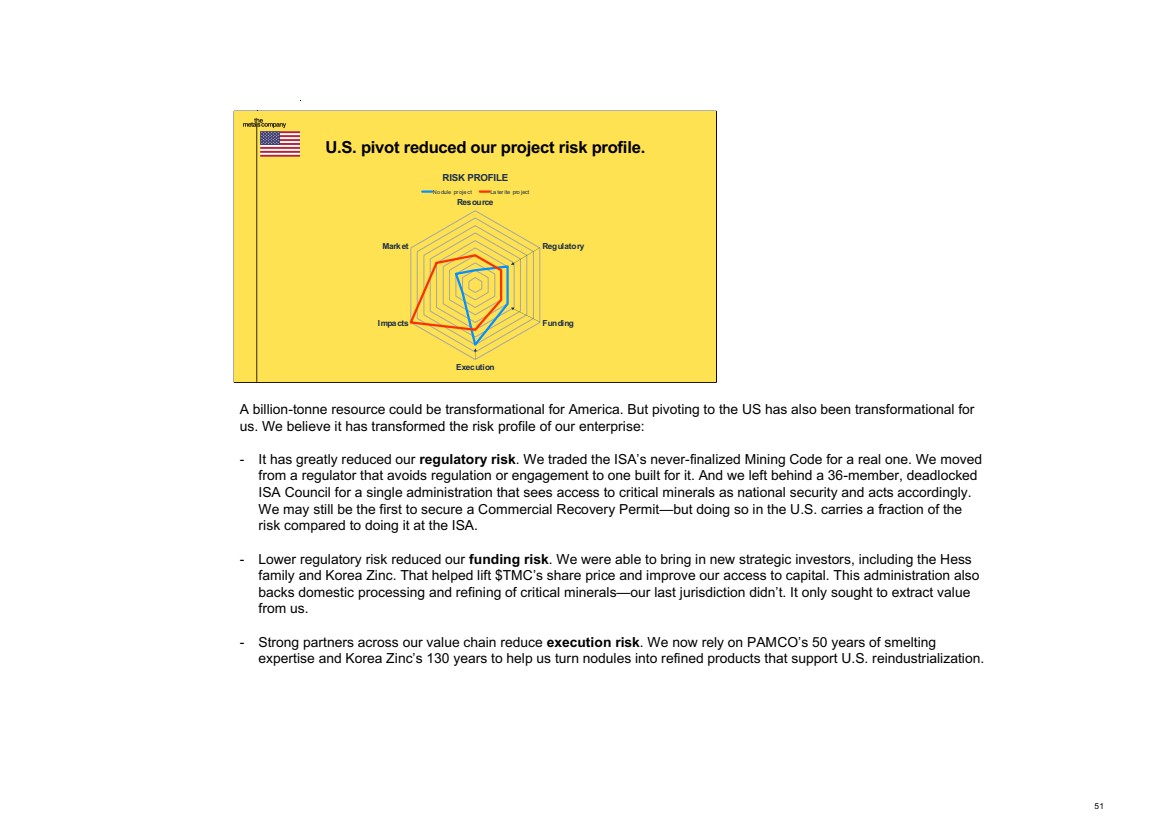
| A billion-tonne resource could be transformational for America. But pivoting to the US has also been transformational for us. We believe it has transformed the risk profile of our enterprise: - It has greatly reduced our regulatory risk. We traded the ISA’s never-finalized Mining Code for a real one. We moved from a regulator that avoids regulation or engagement to one built for it. And we left behind a 36-member, deadlocked ISA Council for a single administration that sees access to critical minerals as national security and acts accordingly. We may still be the first to secure a Commercial Recovery Permit—but doing so in the U.S. carries a fraction of the risk compared to doing it at the ISA. - Lower regulatory risk reduced our funding risk. We were able to bring in new strategic investors, including the Hess family and Korea Zinc. That helped lift $TMC’s share price and improve our access to capital. This administration also backs domestic processing and refining of critical minerals—our last jurisdiction didn’t. It only sought to extract value from us. - Strong partners across our value chain reduce execution risk. We now rely on PAMCO’s 50 years of smelting expertise and Korea Zinc’s 130 years to help us turn nodules into refined products that support U.S. reindustrialization. 51 25 45 70 0 145 255 253 226 83 169 170 174 249 50 0 115 175 210 Master Headline | Arial 25, Bold Headline | Arial 21, Bold BLUE SUBHEAD | Arial 12, all caps Subhead | Arial 16, Bold Body Copy | Arial 14 For Bullets, use - 51 U.S. pivot reduced our project risk profile. Resource Regulatory Funding Execution Impacts Market RISK PROFILE No dule pr oje ct La ter ite pro ject |
| With our risk profile reduced, we can focus on building and creating value. - Primary production of metal based on our total estimated resource gives us a conventional valuation. We can improve it by recovering more of the already estimated resource and by developing additional resource potential. - Using our primary production to launch a metals-as-a-service model won’t be simple, but the upside is material—for shareholders, for future generations and for nature. It’s worth the effort. - We know that our manganese silicate product will likely reduce downstream costs. Rather than passing that value to Mn alloy and metal producers, we could consider adding collocated processing of our manganese silicate product ourselves. The economics support it. We could meet domestic demand and become a leading global exporter. - With Korea Zinc as a strategic partner, it would be logical to close the gap in the U.S. supply chain by producing pCAM from our feedstock—for domestic use and even for export. - Nodules contain 500–1,100 ppm of rare earth elements. That’s potential for further revenue upside—currently untapped. Adjusting the flowsheet could unlock that value. We see our nodules as a platform—not just for primary production, but for building multiple metal businesses, each adding to our value creation potential. 52 25 45 70 0 145 255 253 226 83 169 170 174 249 50 0 115 175 210 Master Headline | Arial 25, Bold Headline | Arial 21, Bold BLUE SUBHEAD | Arial 12, all caps Subhead | Arial 16, Bold Body Copy | Arial 14 For Bullets, use - 52 Now we can focus on building. Relative valuation of metal businesses that could be built based on recovering one billion tonnes of wet nodules - 8.5M EVs x 80kWh = 680 GWh capacity - 70% x 680 GWh = 476 GWh uses nickel & manganese chemistries - 0.65 kg of pCAM (NMC) per KWh x 476 GWh = 309,400 tons of pCAM - $11,000 per ton of pCAM (conservative prices) x 309,400 tons of pCAM = $3.4B revenue - TMC USA/KZ would have 50% market share or $1.7B revenue - 12% EBITDA margin (CNGR at ~10-13%, Huayou at ~12-19%) - Annual EBITDA 12% x $1.7B revenue = $204 million - 10x EBITDA multiple (CATL at 11.6x and sector averages around 7-12x) - 10 x $204= $2B valuation - Potential for higher valuation because the OPEX of refinery+pCAM is almost the same as for pure refinery, so significant EBITDA synergies! Export potential - Assuming EVs are 30% of annual 90M car sales or 27M EVs - 50kWh average battery capacity (smaller in Europe, China) - 18.5M EVs (ex America) x 50kWh = 925 GWh capacity - 40% uses Ni & Mn chemistries x 925 GWh = 370GWh - 0.65 kg of pCAM (NMC) per KWh x 370 GWh = 240,500 tons of pCAM - $11,000 per ton of pCAM (conservative prices) x 240,500 tons of pCAM = $2.6B revenue - TMC USA/KZ would have 50% market share or $1.3B revenue - 12% EBITDA x $1.3B revenue x 10x EBITDA multiple = $1.6B valuation - Co: 19 ktpa Export - Ni: 121.9 ktpa - Mn: 14.3 ktpa - Co: 15.2 ktpa Mn alloy $0.5B USA $1.9B export $2.4B total +2.4 +9 +11.4 Domestic USA market - 370,000t of SiMn imported by USA in 2024 (240ktpa Mn at 65%) - TMC USA replaces 100% of imports - $1,200 per ton of SiMn x $370ktpa = $444 M - 12% EBITDA margin ( Eramet at 12%, Ferroglobe 16%, OM Holdings 12%) - 12% x $444M revenue = $53M - 9x EBITDA multiple (Eramet 10x, OM Holdings 4.3x, Indian Metals & Ferro Alloys at 7.7x). Picked higher end of the range due to (1) pre-reduced feedstock + (2) cost reductions due to co-location - 9x $53M EBITDA = $477M Export potential - The global market for silico-manganese alloy is 9 Mtpa (14 Mtpa at 65-68% Mn contents, 2023) - At 40Mtpa of wet nodules, we will have 8.6 Mtpa of Mn units – enough to do almost all of it - If we took 10% of that market or 900ktpa of contained Mn, we would increase this bucket by 3.75x or $0.5Bx3.75=$1.9B - Mn: 240,000 tpa Mn sulfate $0.12B (USA) $5.4B (export) $5.52B total +0.6 +25 +26 Domestic USA market - TMC USA produces 100% of Mn sulfate that goes into its own pCAM production (see above) - 100% of pCAM produced is NMC811; more Mn sulfate would be required for other chemistries like LMCR - $730 / t of battery-grade Mn sulfate or $2,246 per tonne of contained manganese, based on a manganese content of 32.5% in the compound - $2,246 x 17,850 tpa of Mn = $40M revenue - 50% EBITDA margin (Firebird Metals projects 47-48%, Giyani Metals 54%) - 50% EBITDA x $40M revenue = $20M EBITDA - 6x EBITDA multiple (Canadian Manganese modeled at 5.9-6.3x EBITDA; diversified chemicals 10-12x) - 6x $20M = $120M valuation Export potential - Global demand for battery-grade Mn sulfate is expected to reach 1.6 million metric tons on a contained Mn basis by 2035 (Giyani Metals) - If we took 50% of that market or 800ktpa of contained Mn, we would increase this bucket by 45x or $0.12x45=$5.4B - Mn: 17.9ktpa (pCAM USA) - Mn: 800ktpa (export) REE $3.5B +17 - 500-1,100 ppms of REEs in dry tonnes of CCZ nodules - $21.4-50 /dry ton of nodules; the value is driven primarily by neodymium, dysprosium, terbium, and praseodymium, while light REEs like lanthanum and cerium contribute minimally due to their low prices - 80% recovery rate - 40 Mtpa x 0.72% moisture x 80% recovery rate x $50 per dry ton = $1.15 billion - 50% EBITDA margin (Lynas Rare Earths 28.5% in FY2024 and down from 51% in FY2023 and 65% in FY2022 due to lower prices; MP Materials: historical averages 20-40% when profitable; Rainbow Rare Earths: Projected 75% for future operations, Margins are higher in high-price environments (up to 60-65%) but can turn negative during downturns, with industry averages aligning closer to specialty chemicals (20-40%). - 20x EBITDA valuation multiple (REE processing businesses range from 10x to 20x for growth-oriented firms, though current multiples can be higher due to volatility and low EBITDA in recent years. Industry benchmarks from metals/mining are 8.7x (positive EBITDA firms) to 11.3x (all firms), while specialty chemicals average 13.3x to 14.5x. For specific companies: Lynas Rare Earths: Current 83-154x (elevated due to compressed EBITDA); historical average ~51x; MP Materials: Current 68x; historical 21-84x, with targets around 19x for future projections. Multiples are influenced by strategic importance (e.g., supply chain security) and can reach 20-30x in optimistic scenarios, but 10-15x is more typical for stable operations) - $1.15B revenue x 50% EBITDA margin x 20 EBITDA multiple = $11.5B - Global market for REEs is $4-7B, although the market is expected to grow 9-13%...highest prediction is $37B by 2033 (IMARC Group) - If we took 50% of this market, we could add $3.5B short-term which would translate into a more reasonable 10% share by 2033 based on the most aggressive market forecast of $37B TOTAL $56.7B 240 Mn Co Cu Ni Primary production Metals as a service Value creation potential Exploration potential REE extraction Mn alloy, Mn sulfate pCAM |
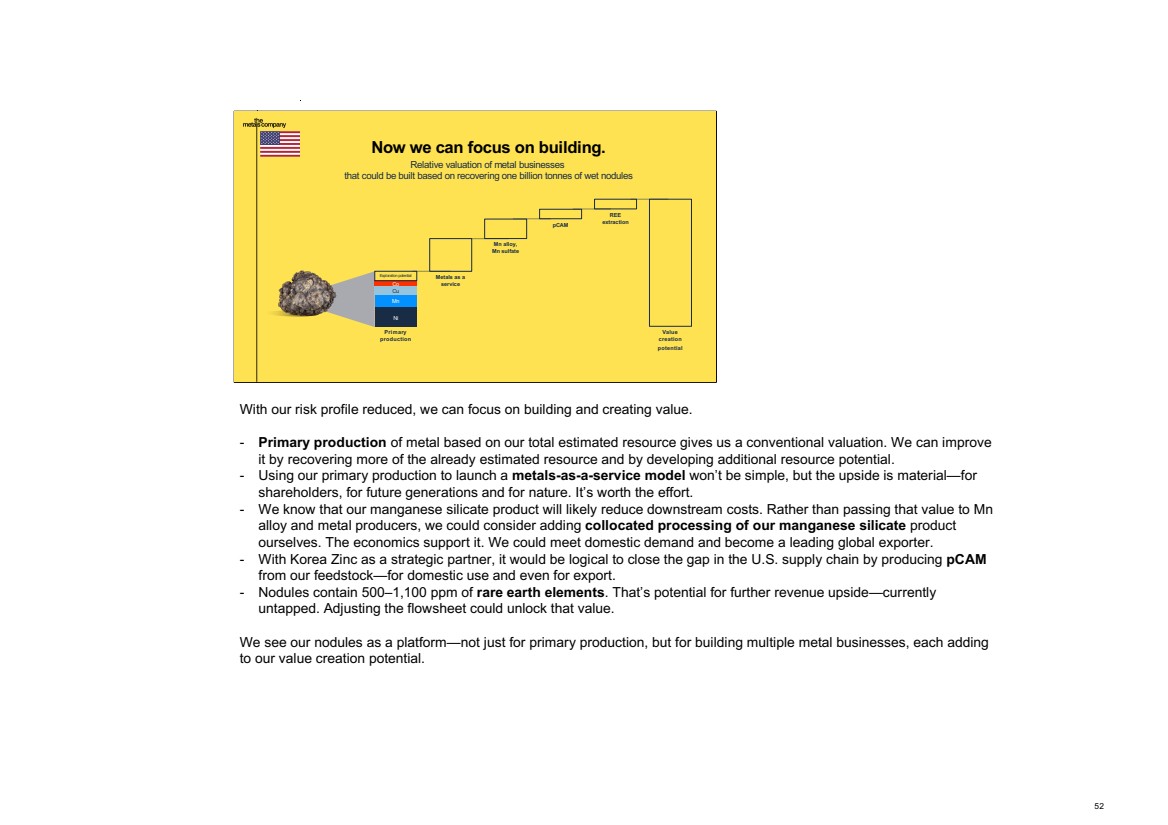
| 53 25 45 70 0 145 255 253 226 83 169 170 174 249 50 0 115 175 210 Master Headline | Arial 25, Bold Headline | Arial 21, Bold BLUE SUBHEAD | Arial 12, all caps Subhead | Arial 16, Bold Body Copy | Arial 14 For Bullets, use - 53 MISSION & MASTER-PLAN Gerard Barron, Chairman & CEO August 2025 |

| 1 ZERO TO ONE: PROJECT ECONOMICS Craig Shesky, CFO August 2025 It’s a pleasure to be here with you all. First, I’d like to say: thank you for your patience. For the last several years, many of you have been building models based on assumptions from the 2021 NORI-D Initial Assessment, knowing that things would likely be changing due to volatility in commodity prices, expenses and even regulations. Looking at the faces in this room, there have been many of you who have heard similar answers on calls from me or Gerard: “please wait for the PFS.’ In fact, out of the 8 research analysts who cover our stock, most of which are in this room, most of them have had to build models based on incremental updates and moving goalposts in the last few years. Since going public, it’s been lot of ‘one step forward, one step back’: a positive step with the 2022 collection test, a step back with ISA mining code delays of the last several years. But now, through the USA process: a quantum leap that allows us to achieve exit velocity, and break free from the regulatory uncertainty which has been holding us back. And along with that… the confidence to new share two landmark economic studies with the market. Today, I believe that your patience, and your faith in us, will be rewarded. We can finally release an independently verified economic roadmap: not just for NORI-D, but across the entire resource of 1.6 million wet tonnes of nodules. We are also shifting gears from exploration to development. While this is a common shift for any land-based miner – important to the miner itself but has been done by thousands of companies before them -- our context is quite different. But a few things should be clear by the end of this presentation: this resource is valuable, it is low cost, it is commercially viable… and first production is coming soon, the start of an entirely new industry. 1 |
| 2 We are starting a new industry. “To build a great company…you must start with a unique advantage and not be discouraged by lack of competition initially… Horizontal progress means copying things that work—going from 1 to n... Vertical progress means doing new things— going from 0 to 1. Vertical progress is harder to imagine because it requires doing something nobody else has ever done.” In starting a new industry, one might say that we are going from Zero to One. And as Peter Thiel notes, to build a great company, you must start with a unique advantage and not be discouraged by a lack of competition initially. We certainly fit that bill. We are not simply copying thousands of companies who came before us. Our operations are not easy to imagine because there are no existing commercial nodule collection and processing operations we can take you to. I would be remiss not to acknowledge that we did follow in the footsteps of four U.S.-based consortia who have successfully tested their pilot mining equipment and developed processing flowsheets back in the 1970s. But none of them transitioned out of exploration into development or applied for a commercial recovery permits. Here we are truly going from Zero to One. 2 |
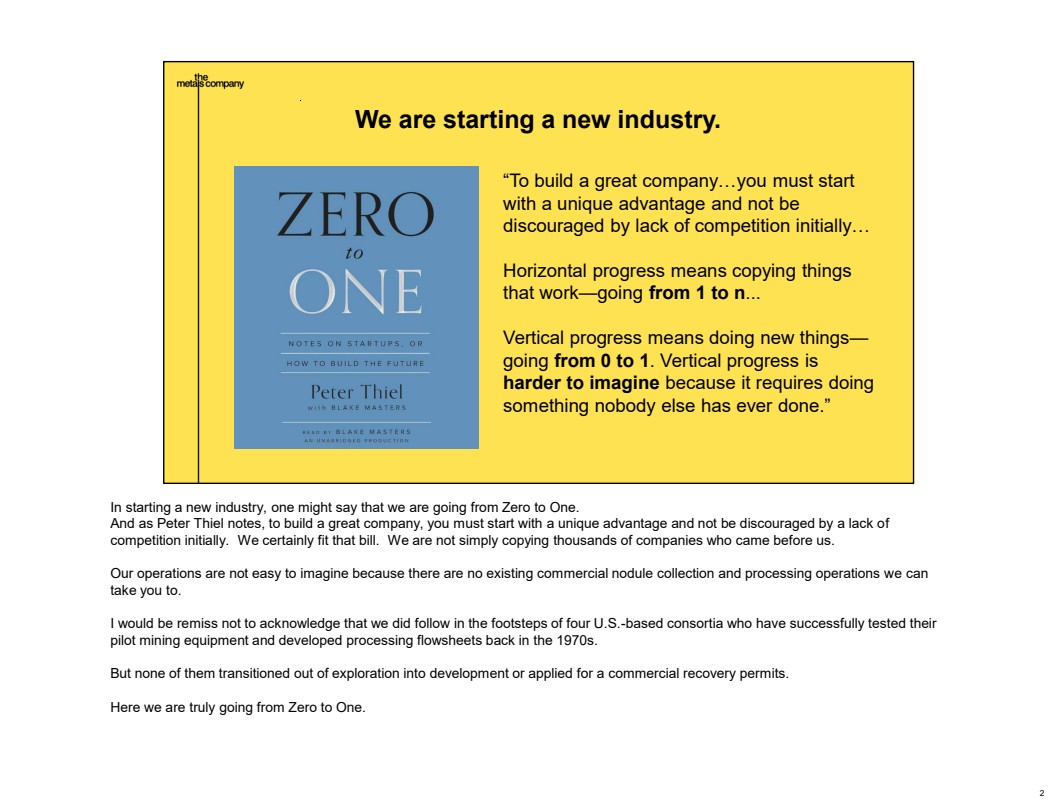
| 3 Going from Zero to One. HORIZONTAL INNOVATION VERTICAL INNOVATION Focus: Cost optimization Building fit-for-purpose assets OFFSHORE <$35 collection opex / wet tonne - 7 Mtpa vessels with 3 collectors - Hydraulic pump vertical transport - AI-optimized, autonomous operations - Nuclear power plant ONSHORE <$100 processing & refining opex / wet tonne - Streamlined flowsheet - Modular design - Software-led build & ops - AI-optimized operations Focus: Capital-light start Repurposing existing assets OFFSHORE $93 collection opex / wet tonne* - 3 Mtpa modified drillships with 2 collectors - Airlift vertical transport - Human operations - Conventional marine fuels & batteries ONSHORE $104 processing & refining opex / wet tonne* - Existing RKEFs - Existing / new build refineries 1 n 0 * Based on fundamental unit economics during steady state operations in year 2041 as per PFS 2025 To get started, we have had to be scrappy. We have chosen to pursue a capital light strategy and focus on re-using existing production assets where possible. This approach—while reducing our upfront capital requirements—is not without trade-offs. We have a long list of ideas for how we can improve our starting point, some we are already working on. But to get started and to model our project economics, we had to choose the most mature, proven solutions that are either in operations or in advanced stages of engineering. You will not see us use nuclear fuel instead of conventional marine fuels in our offshore operations or see us assume autonomously operating bulk carriers. Both of these improvement opportunities are on the horizon. But today we focus on what we know we can do. 3 |
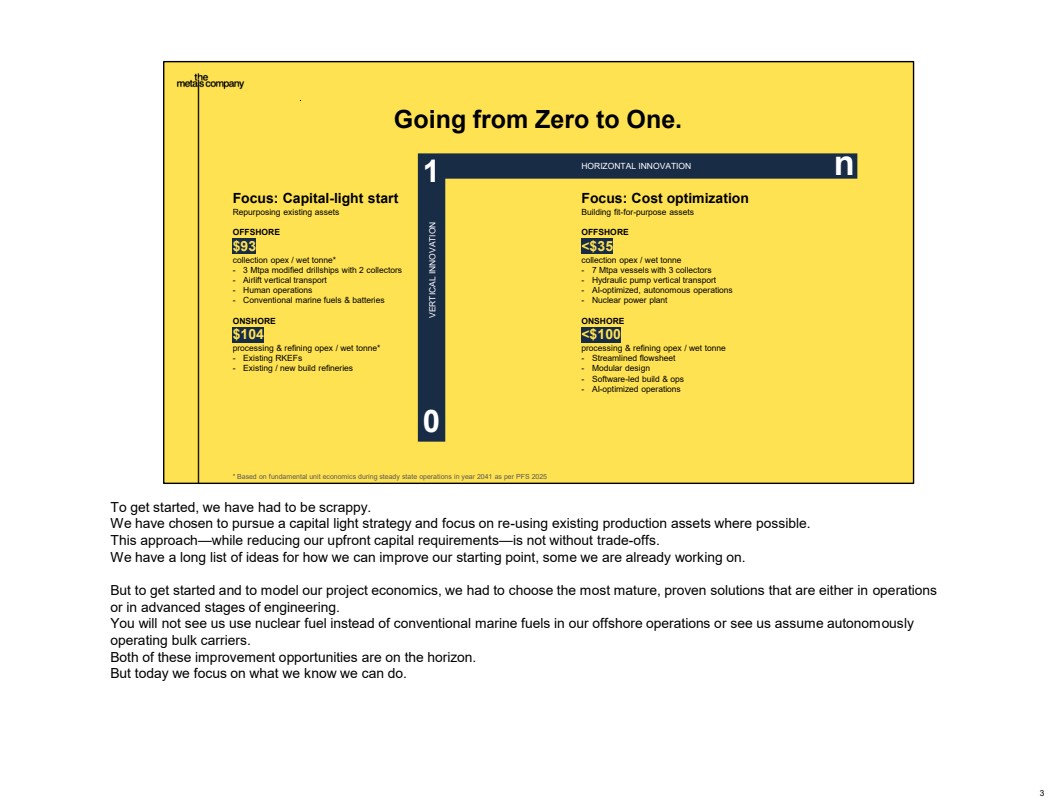
| 4 What are the economics of developing a 1.6 billion tonne resource? 1,634 ~300 million tonne existing estimated resource million tonne resource potential (mgmt. estimate) So what are the economics of developing a resource of 1.6 billion tonnes? Let’s first do some level-setting on what areas we’re focusing on in today’s presentation. This map shows the scope of our two NOAA exploration license applications. As most of you can tell, the colored patches correspond with the NORI and TOML areas (ranked as the #1 and #2 largest undeveloped nickel projects on earth by Mining.com) as does the 1.6 billion tonne resource estimate from previously issued technical reports. Still, to date, nearly all of the valuation discussion in the market has been about NORI-D, which was the only block to have any disclosable value assigned to it when we went public in 2021. NORI-D is just the beginning, as 22% of the total estimated resource of 1.6 billion tonnes. It’s finally time to answer the question that so many of you have been asking: What are the project economics of developing the entire resource through the U.S. regulatory regime? 4 |
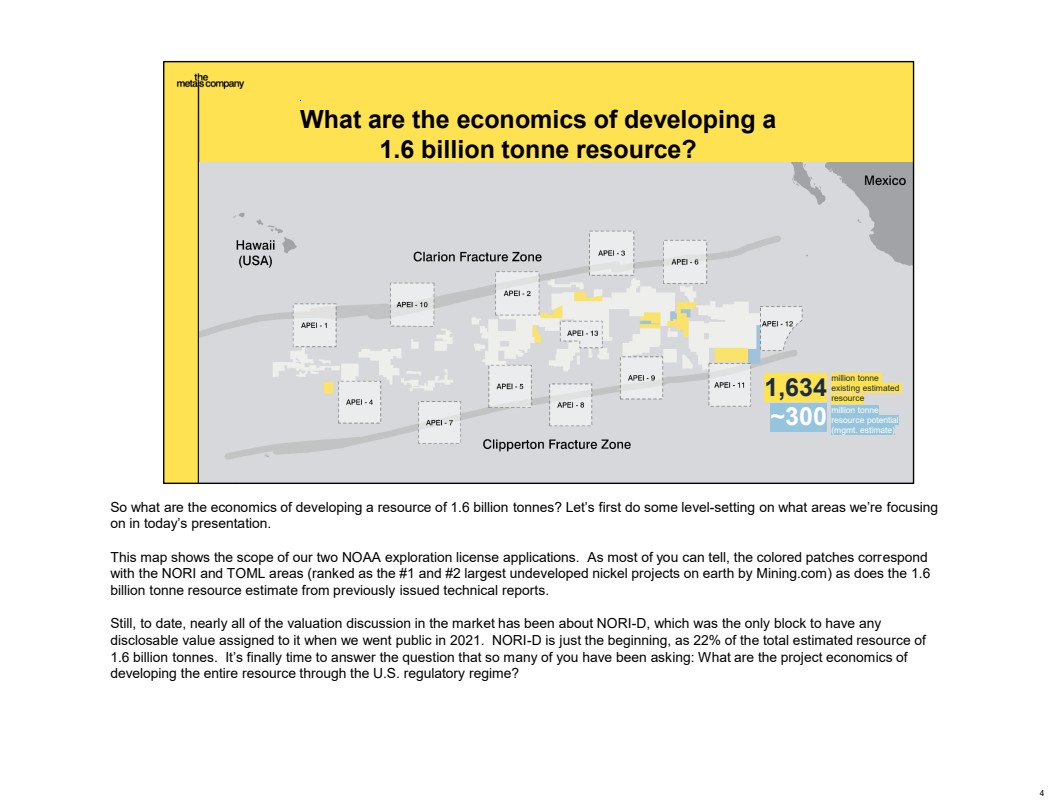
| 5 Our answer is subject to strict standards. SEC Regulation S-K 1300 - It’s the law. Publicly listed mining companies in the U.S. are legally required to follow SEC Regulation S-K 1300 when disclosing information about their mineral resources and reserves. - Aligns with global norms. SK 1300 is the U.S. version of international standards like Canada’s NI 43-101 or Australia’s JORC Code. - Requires real, validated data. SK 1300 ensures companies can’t just make bold claims about “massive resources” without real data and professional validation. - Defines levels of confidence. It helps investors see how confident the company is in the size, quality, and economics of a deposit — and what stage of development it’s in. - Requires verification & sign-off by Qualified Persons. Resource and reserve estimates must be reviewed by qualified experts, who take on legal responsibilities. As a U.S.-listed company, our answers are subject to strict standards. These standards can be found in SEC Regulation S-K 1300. For those unfamiliar with these regulations, think of them as the mining version of GAAP (Generally Accepted Accounting Principles) — but instead of financials, it’s about what’s on the seafloor, how sure we are about it and how we go about producing the economic studies on the development of our resource. These standards are there to protect investors from hype and fraud. They also define levels of confidence and the level of data and engineering required to support each level. Everything we say requires verification and sign-off by Qualified Persons. 5 |
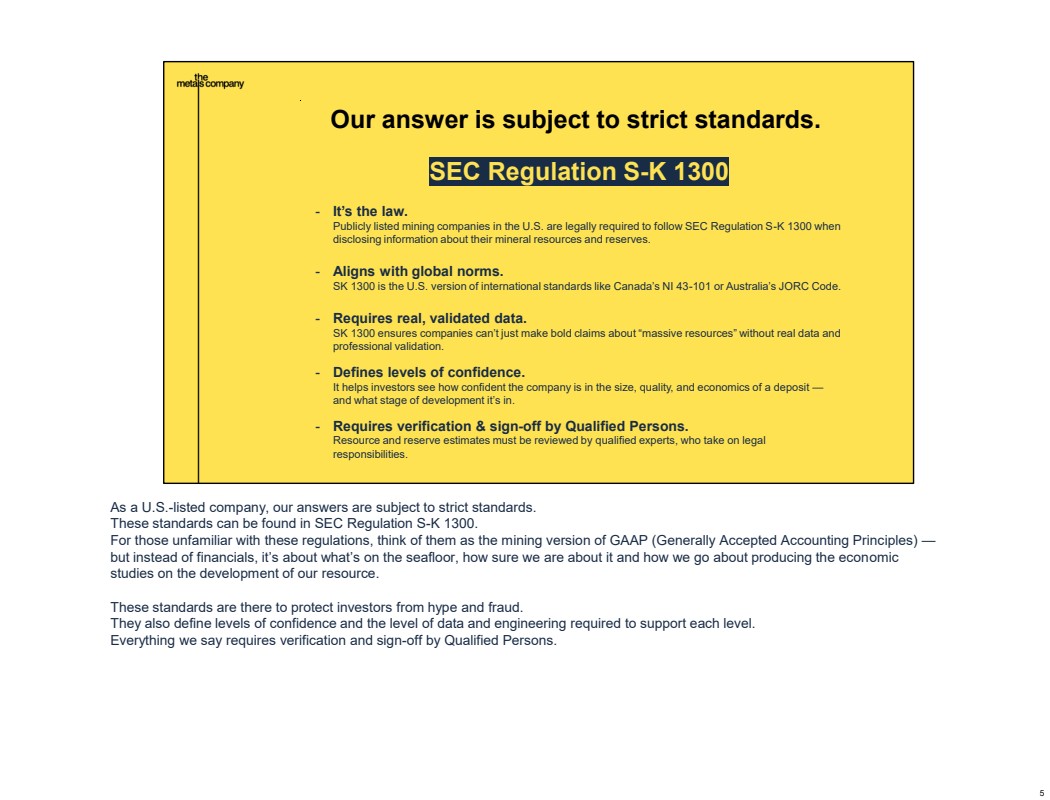
| 6 Project economics: three types of studies. SEC Regulations Subpart S-K 1300 STUDY IA Initial Assessment PFS Pre-feasibility Study FS Feasibility Study CONCEPT What it could be What it should be What it will be OBJECTIVE Early-stage conceptual assessment of the potential economic viability of mineral resources Realistic economic and engineering studies sufficient to demonstrate economic viability and establish mineral reserves Detailed study of how the mine will be built, used as the basis for a production decision COST ACCURACY +/- 50% +/- 25% +/- 15% MINERAL ESTIMATE OUTPUT Inferred, Indicated & Measured Resources Probable & Proven Reserves Probable & Proven Reserves CONFIDENCE LEVEL Project economic studies come in three levels of increasing confidence: - An Initial Assessment gives you a sense of what the project could be, within a broad band of plus-minus 50% cost estimate accuracy. We produced an IA in March 2021 over the NORI-D area. - A Pre-Feasibility Study gives you a sense of what the project should be and narrows the accuracy to within 25%. This typically requires much more mature level of engineering. PFS is the first time where a company would typically produce reserves. - And last, is the Feasibility Study that describes what the project will be, with an even tighter cost accuracy band and is often the basis for project finance. 6 |
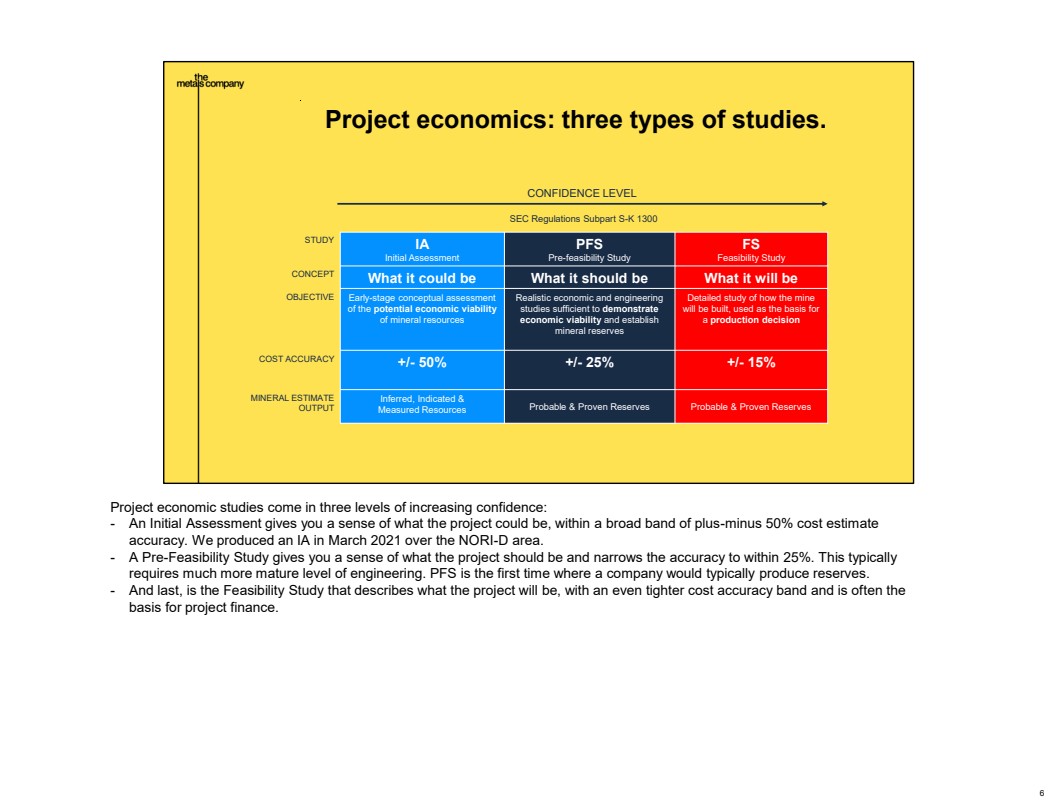
| 7 We’ve published two new studies. ✓SEC S-K 1300 compliant ✓Compiled by AMC ✓Commodity prices / payables from Benchmark Minerals & CRU ✓Offshore costing by Allseas ✓RKEF costing by PAMCO (Japan) and SMM (Indonesia) ✓Refinery costing by internationally-recognized engineering company ✓Signed off by 9 Qualified Persons PFS IA Today, we have published two new studies – - a PFS for our NORI-D area where we had previously published an IA - and a new IA that covers the rest of our resource. Together, these two studies should give you a good sense of what our first project should be in the NORI-D area and what the rest of our resource could deliver in terms of economics. 7 |
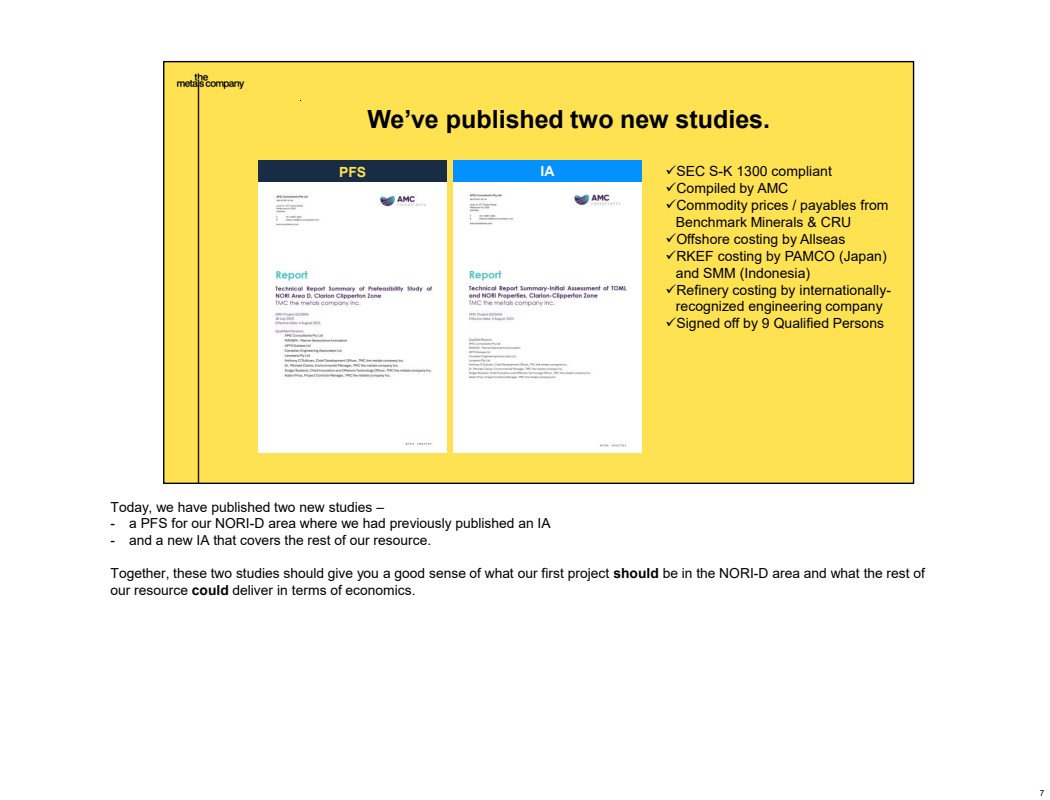
| 8 Two studies cover total estimated resource, with combined NPV today of $23.6 billion. PFS $5.5 billion NPV IA $18.1 billion NPV – Not covered by PFS / IA, no QP-verified resource estimate yet Note: TMC USA applied for an additional exploration area surrounding NORI-D and TOML-F with an expected exploration potential. These areas are excluded from the PFS and IA as no resource definition work has been undertaken by TMC USA on these areas yet. Here you can see what geographical areas each study covers: - PFS covers the area known as NORI-D. - IA covers everything else. Neither study covers the additional ground we have applied for under the U.S. law and where we now have priority of right. Our management team estimates these areas to have approximately 300 million tonnes of exploration potential given proximity to the NORI-D and TOML-F areas where we have a lot of exploration data. The headline numbers are very exciting: as of the middle of 2025, assuming an 8% discount rate, an NPV of $5.5 billion for the NORI-D area covered by the new PFS. On top of that, an additional $18.1B of NPV for everything else. Total combined NPV: $23.6 billion dollars. 8 |
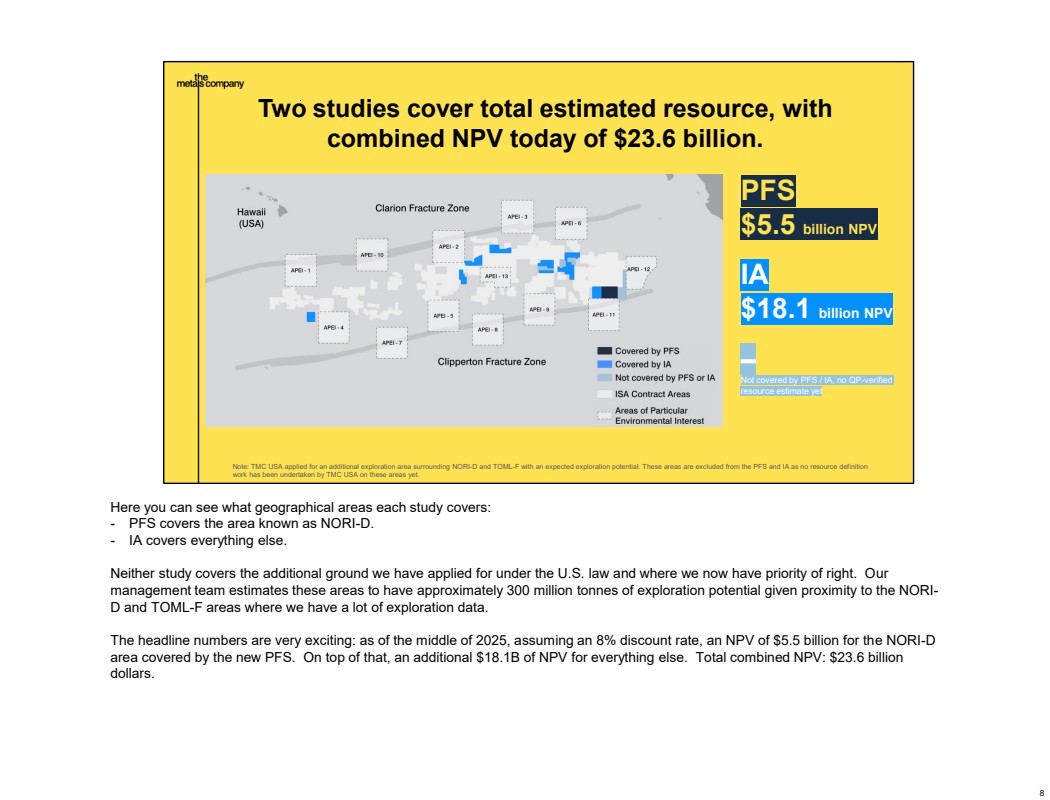
| 9 PFS is now our highest confidence study. NPV:: $5,502 million IRR:2 27% Area:: 25,160 km2 NORI-D Resource: 352 Mt (347 Mt Indicated, 5 Mt Measured) Recoverable: 164 Mt, incl. 51 Mt probable reserves Production start: Q4 2027 Life of Mine: 18 years Steady state production (2031-2043): 11 Mtpa of wet nodules - 97 ktpa nickel in alloy, matte & sulfate - 2,389 ktpa manganese payable production in silicate - 70 ktpa copper in alloy, matte & cathode - 7.4 ktpa cobalt in alloy, matte & sulfate Offshore production: - 4 converted drillships each with 2x15m wide collectors - 4 transfer vessels Onshore production: - RKEF plants (PAMCO/Japan, Indonesia) - Refinery (TMC USA X 2) PFS We’ll start with the PFS that is focused on the 25,160 km2 area known as NORI-D. The estimated amount of recoverable nodules for this study is 164 million wet tonnes. Assumed production start is Q4 2027, with a life of mine 18 years. Annual production in steady state was modelled at 11 million tonnes of wet nodules. Offshore, this level of steady state production will require 4 converted drillships. Onshore, we assumed processing in existing RKEFs and building refining capacity in the United States. 9 |
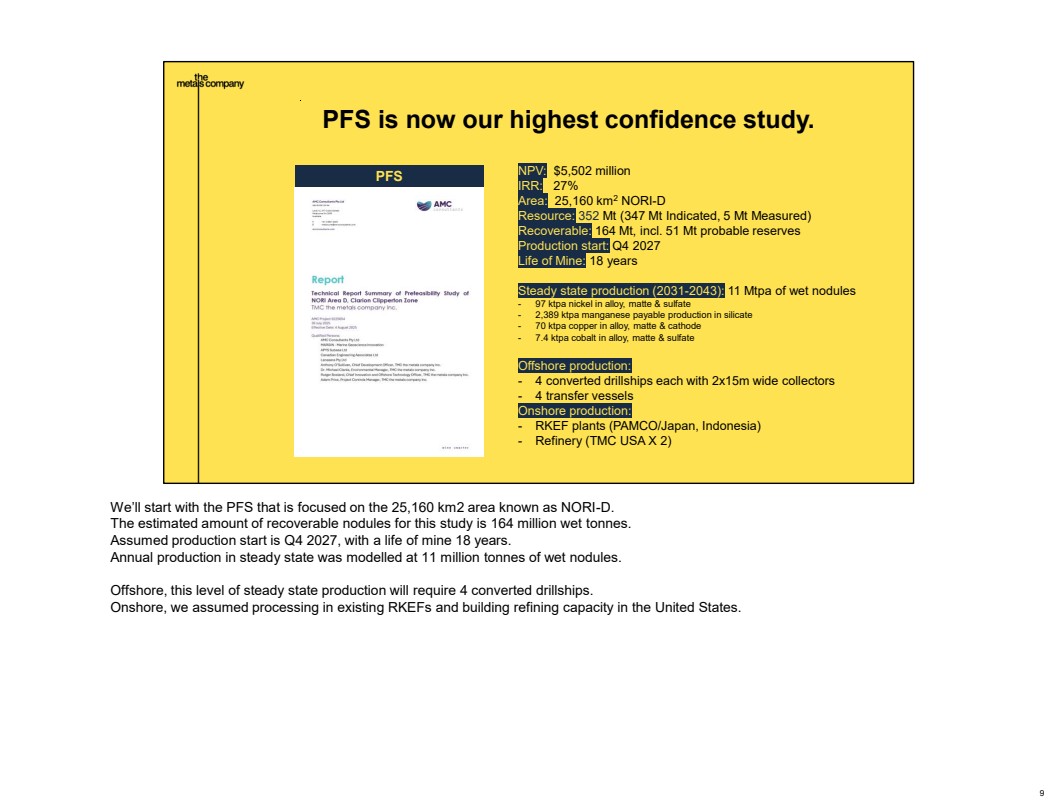
| 10 PFS: Recovering 46% of the total resource. Recoverable nodules IA 2021 More nodules left behind due to geo-obstacles, wider passes between collector runs New set-asides & buffers around sensitive areas NORI-D recoverable nodules Million wet tonnes Inf. Resources cannot be considered in a PFS Total resource IA 2021 164 254 Collection factors Enviro Inferred Inferred Measured Indicated 356 Collection factors Nodules left between and inside collector passes Recoverable nodules PFS 2025 Our 2021 IA for NORI-D had a larger basis of about 254 million tonnes of ‘recoverable’ nodules. In developing the PFS, based on key data collected over the last several years and learnings from the 2022 pilot collection system test, the team sharpened their pencils on the number of nodules that can be collected based on current technology, and based on the much more precise standards required by a pre-feasibility study. The 2025 PFS is now based on 164 million tonnes of recoverable nodules, after accounting for new assumptions on environmental buffers, nodules left behind in more detailed mine planning, and the 11 million tonnes of inferred resources from the 2021 IA that are not allowed to be incorporated into a PFS. 10 |
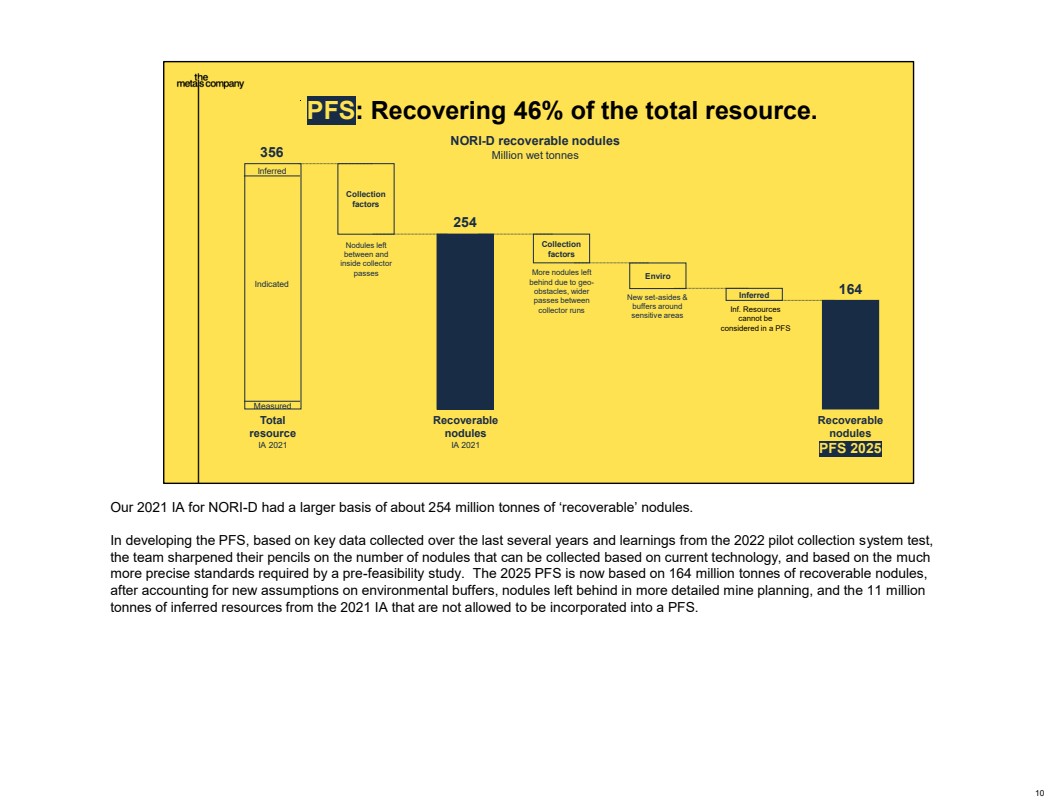
| 11 PFS: World’s first polymetallic nodule reserves. 51 Mt probable reserves It’s a world first. No other company has ever declared probable mineral reserves for polymetallic nodules — this is historic. While others are exploring, TMC is setting the technical benchmark for deep-sea mining. From “resources” to “reserves.” This marks a shift from talking about resources (what might be there) to reserves (what can be developed now). That’s a much higher level of certainty. Reserves = demonstrable economic value today. In mining, reserves are the gold standard. They’re what investors, analysts, and banks have the most confidence in, but it is not an upper limit on a project’s value as de-risking continues. Brings nodules closer to production. It signals that nodules are no longer just an exploration play — they’re on a clear path to becoming a real source of metals. Unlocks access to capital. Banks, institutional investors, and government programs often require reserves and a PFS to consider project funding. This opens those doors. Within this 164 million recoverable tonnes, we can zoom in on a number that is a world first for polymetallic nodules: probable reserves. As part of the PFS, we have been able to declare 51 million tonnes of wet nodules in probable reserves. The transition from resources to reserves is a gear shift in level of confidence. Reserves mean they can be mined economically, with a detailed mine plan and project economics backing up the numbers. Reserves are often a prerequisite to unlock access to capital and sometimes customers. It does not mean that some or all of the rest of the 164 million tonnes will not be converted to reserves. But we will need to collect higher resolution seafloor imagery and complete detailed mine planning in those areas. 11 |
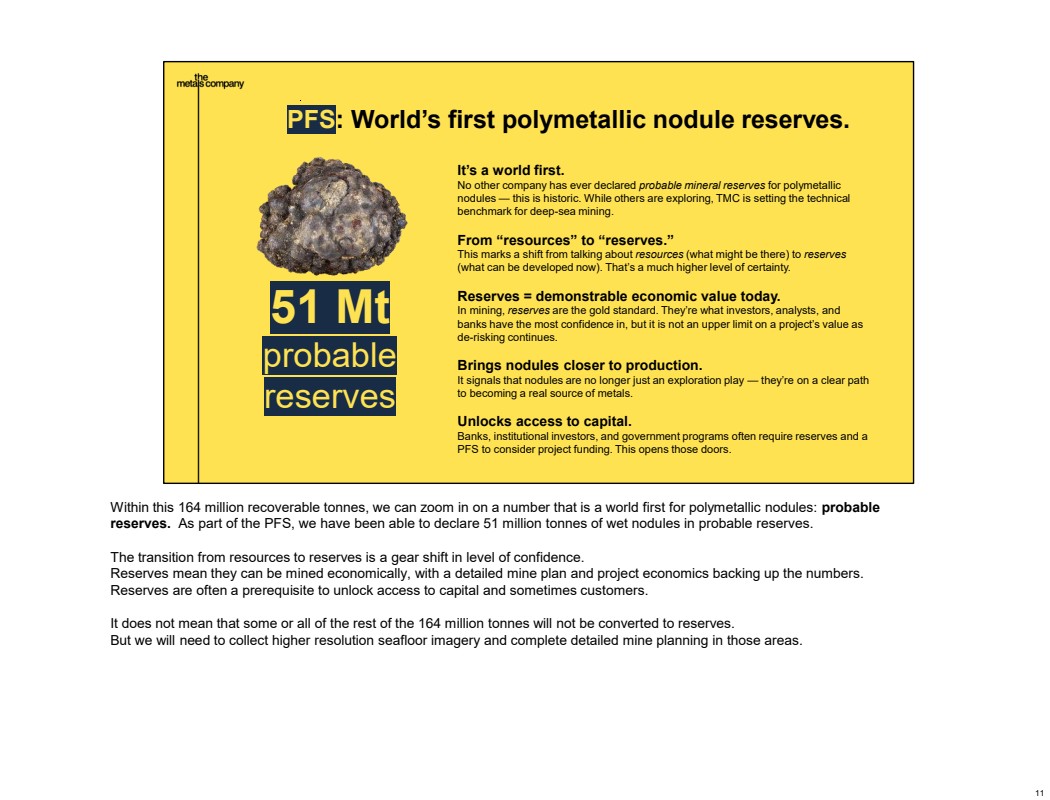
| 12 PFS: Start capital-light, then build. CAPEX Contracted service Contracted service $492 M Offshore development CAPEX RKEF lines (x9) Tolling Refineries (x2) CAPEX $4.4 B Onshore refinery development CAPEX (94% spent in 2030s) So how will we develop these commercially viable operations? The March 2021 Initial Assessment for NORI-D envisioned $7 billion CAPEX, of which $2.2 billion was for offshore vessel capex. For the PFS, we have been able to bring that offshore pre-production number down to roughly $500 million for the offshore component. Where possible, we have assumed contracting the services we need and only deploy CAPEX where without deploying CAPEX ourselves, we won’t be able to get the service. As a result, our development CAPEX assumes $4.4 billion onshore for construction of the refining capacity to match the offshore production. This approach ensures that we can deliver critical products to the U.S. as contemplated by the NOAA regulations, while significantly increasing our payables by producing higher-value products like nickel sulfate and cobalt sulfate. before any U.S. refineries are built, we have an opportunity to either give offtake to Korea Zinc for our alloy / matte on the condition processed materials are returned to the U.S. OR toll through their facility and return processed materials to the U.S. ourselves. Because we have not yet developed definitive agreements with Korea Zinc, some of the production is left at alloy/matte level. And that U.S. refining capacity? We are aiming to build it together. But let me be perfectly clear… we are not going to bite off more than we can chew, and we expect to be in production and producing significant revenue prior to greenlighting any such onshore spending. In fact, approximately $4.2 billion of this estimate is assumed to be spent in 2030s…well after we’ve been in production for some time and generating significant revenue. 12 |
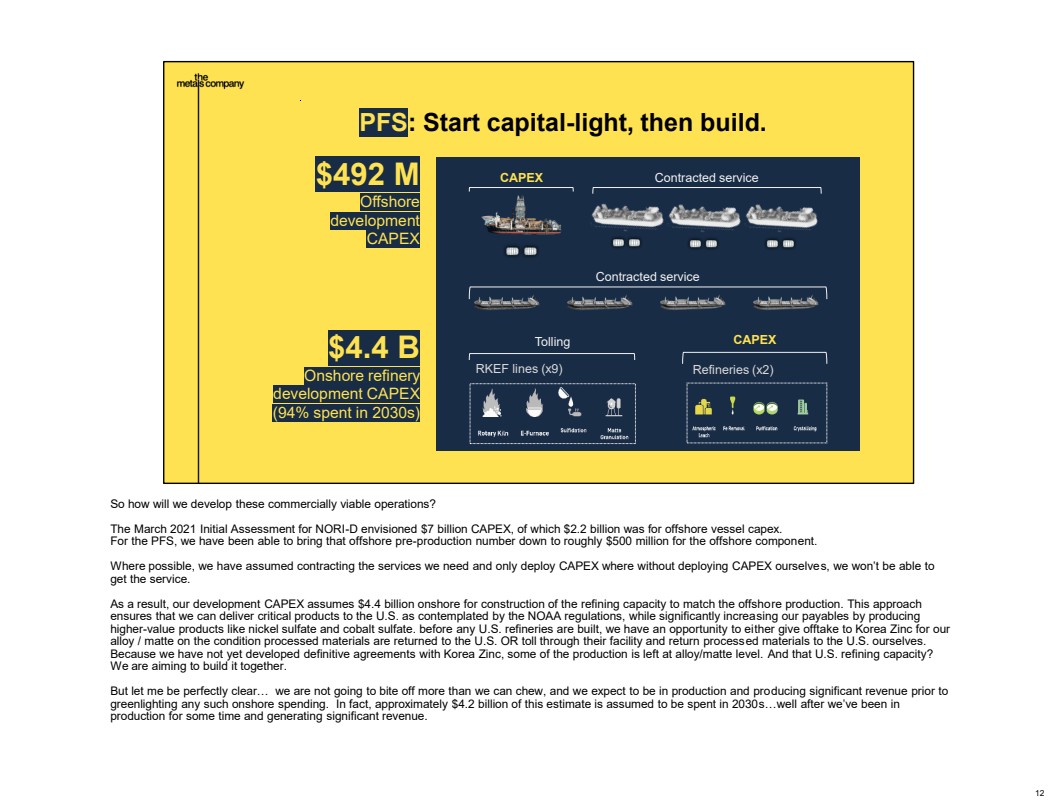
| 13 Pacific Ocean PFS: Pacific spread of productions assets. Japan United States Indonesia Gulf of America REFINING COLLECTION RKEF PROCESSING RKEF PROCESSING Let’s now move to a map of what this PFS operation will look like. This map is the product of having to work within several constraints: - To use existing facilities for processing, we have to go to Japan and Indonesia. - To optimize on transportation cost, we use large Capesize bulk carriers to take nodules from NORI-D to Asia. - Japan comes with port constraints, so we have to move nodules to a smaller bulk carrier in Indonesia to be able to enter Hachinohe. - Intermediate material gets shipped to the United States for refining. In the ideal world, refining would have taken place on the West coast. However, the Gulf of America offers much better site options, with better access to electricity, natural gas and consumables. The downside is needing to go through the Panama Canal. 13 |
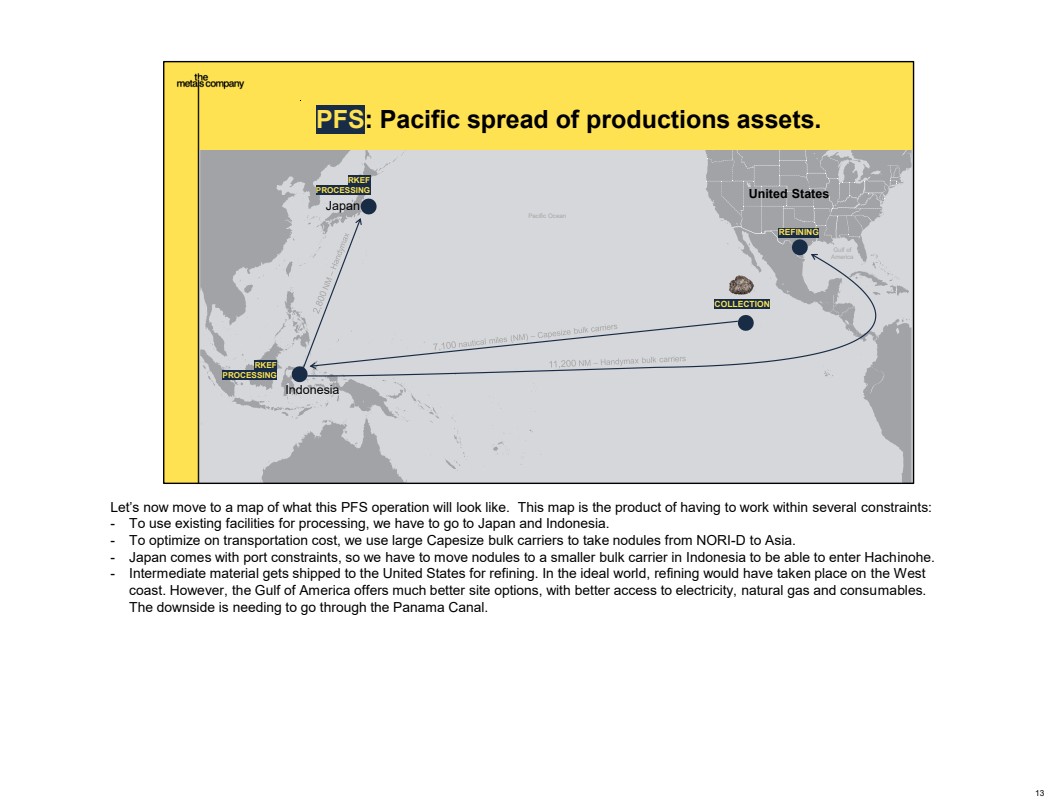
| 14 PFS: nodule collection & transport. Now I’d like to play a short video to give you a sense of what these offshore operations will look like. Video narration: The process begins with our collector designed to pick up nodules from the sea floor with minimal disturbance. Our flow lift system aims a jet of water at the nodules along the sea floor and then channels and lifts the nodules inside the collector. The jet also lifts up to 5 centimeters of seafloor mud which gets separated from the nodules inside the collector and returned back to the sea floor.Most of the mud particles will settle within 10s to hundreds of meters from where they were picked up, while the finest particles may travel up to thousands of meters. Our adaptive management system, a mix of deep sea ecological data, marine sensors, and artificial intelligence creates a digital twin of our operating environment. This system enables us to monitor what's happening in real time and will give eyes and ears into our offshore operations to the regulator and stakeholders. With this information we can adapt to stay within safe ecological boundaries. Next, the nodules as well as seawater and a small amount of residual mud will travel upward on compressed air bubbles through the riser system to our production vessel. Once aboard, these nodules are dewatered, riser water, along with any excess nodule and mud particles, gets returned to a depth below 2000 m that's scientifically chosen to have minimal impact. 14 |
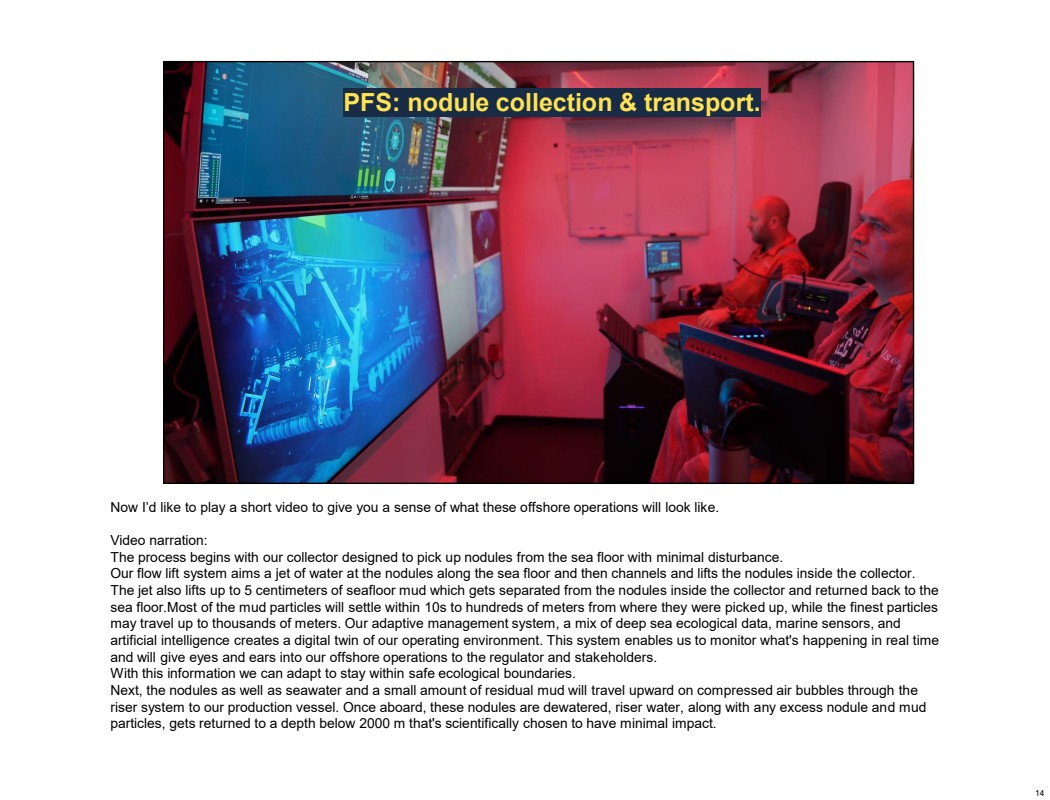
| 15 PFS: Starting small, steady-state by 2031. 0 2 4 6 8 10 12 14 0 1 2 3 4 5 6 7 8 9 10 11 12 13 14 15 16 17 18 2027 2028 2029 2030 2031 2032 2033 2034 2035 2036 2037 2038 2039 2040 2041 2042 2043 2044 2045 Mtpa (wet) We expect to start small in Q4 of 2027, gradually reach the nameplate capacity of our first production system before adding the second vessel in 2030 and ramp up to steady state with 4 vessels by 2031. Steady state annual production defined as 2031 through 2043 will run on average at 10.8 million tonnes of wet nodules, with a couple of years hitting the nameplate capacity of 12 million tonnes per year. 15 |
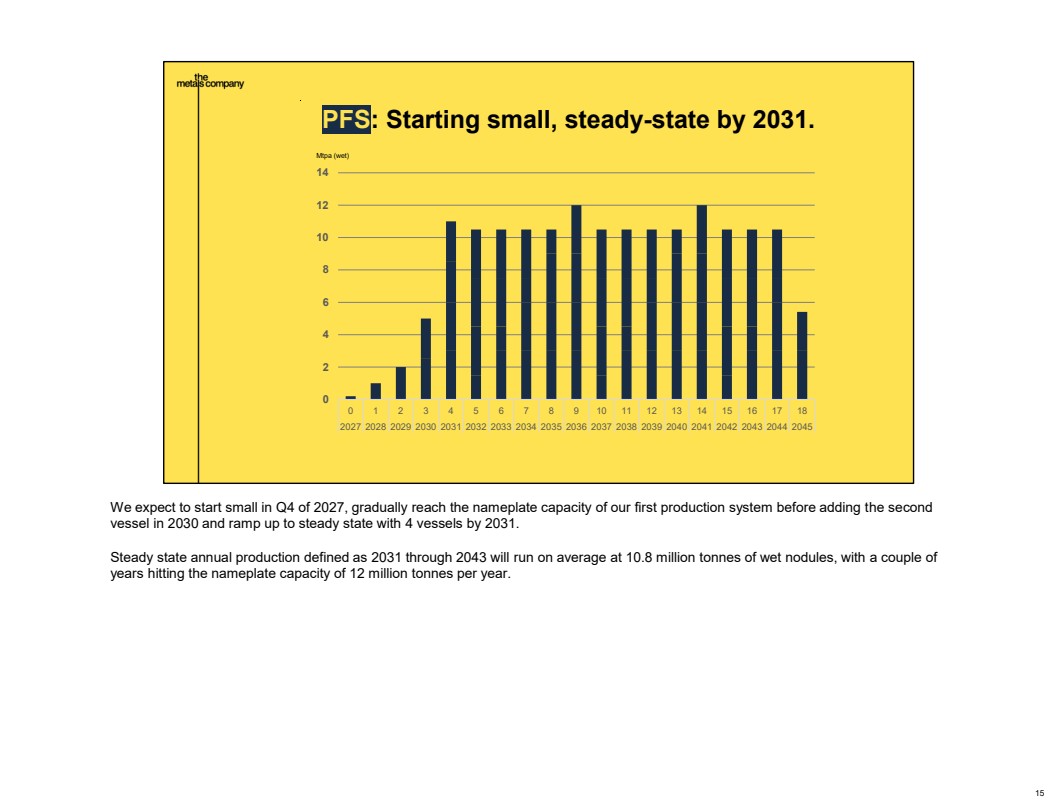
| 16 PFS: Steady state product mix and volumes. Mn – 28% Co – 9% Cu – 17% Ni – 45% Revenue $ per dry tonne of nodules, 2031- 2043 average $595 RKEF Refinery Only 50% of collected & processed nodules are refined. If 100% were refined, average revenue per tonne of dry nodules would be ~$640. We expect to generate almost $600 per dry tonne of nodules during steady state production, defined as average production from 2031 through 2043. As one might expect, this isn’t a smooth line: prior to the construction of USA refineries, the revenue per dry tonne will be a bit lower, a bit less than $500 per tonne in 2032 for example. By the end of the 2030s, with two U.S. refineries running, expected revenue per dry tonne is approximately $640. Overall, the revenue mix is expected to be very similar to what we’ve shared with the market over the last several years: - 45% of revenue will come from nickel products - 28% from manganese - 17% from copper - And at 9%, cobalt is our smallest source of revenue. 16 |
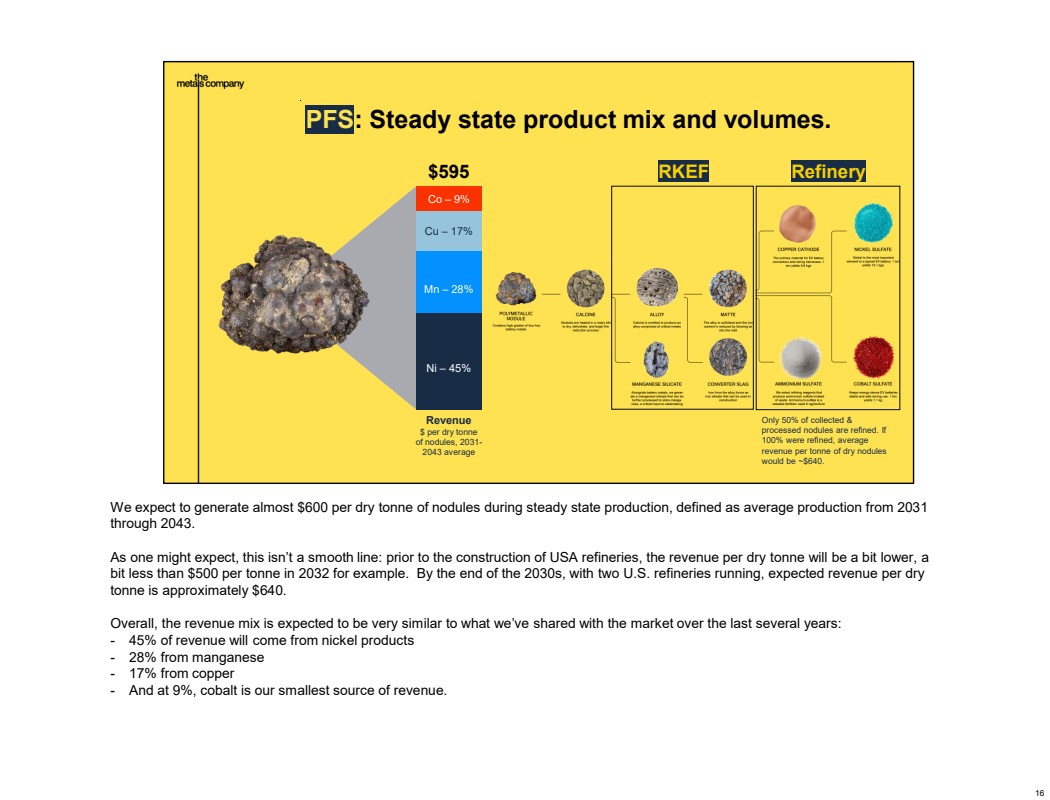
| 17 PFS: Assumed commodity prices. 0 5,000 10,000 15,000 20,000 25,000 30,000 35,000 40,000 45,000 50,000 2015 2016 2017 2018 2019 2020 2021 2022 2023 2024 2025 2026 2027 2028 2029 2030 2031 2032 2033 2034 2035 Nickel $/t 0 2,000 4,000 6,000 8,000 10,000 12,000 14,000 16,000 18,000 20,000 2015 2016 2017 2018 2019 2020 2021 2022 2023 2024 2025 2026 2027 2028 2029 2030 2031 2032 2033 2034 2035 $/t Copper 0 10,000 20,000 30,000 40,000 50,000 60,000 70,000 80,000 90,000 100,000 2015 2016 2017 2018 2019 2020 2021 2022 2023 2024 2025 2026 2027 2028 2029 2030 2031 2032 2033 2034 2035 Cobalt $/t 3.0 3.5 4.0 4.5 5.0 5.5 6.0 6.5 7.0 7.5 2022 2023 2024 2025 2026 2027 2028 2029 2030 2031 2032 2033 2034 2035 Manganese $/dmtu Forecast simple annual average: $19,601 Forecast simple annual average: $5.41 Forecast simple annual average: $52,859 Forecast simple annual average: $11,253 Our revenue estimates are based on 3rd party commodity price forecasts. For nickel, copper and cobalt, we relied on forecasts from Benchmark Minerals, one of the blue-chip research firms in the metals & mining space. For manganese, we relied on forecasts from CRU, another internationally recognized firm in our industry. Obviously, commodity prices don’t move in a straight line, as you can see from the left sides of these charts which look a bit like EKGs. But having 4 metals in one resource offers us a lower cost position through byproducts and a healthy margin of safety in most foreseeable commodity price environments. 17 |
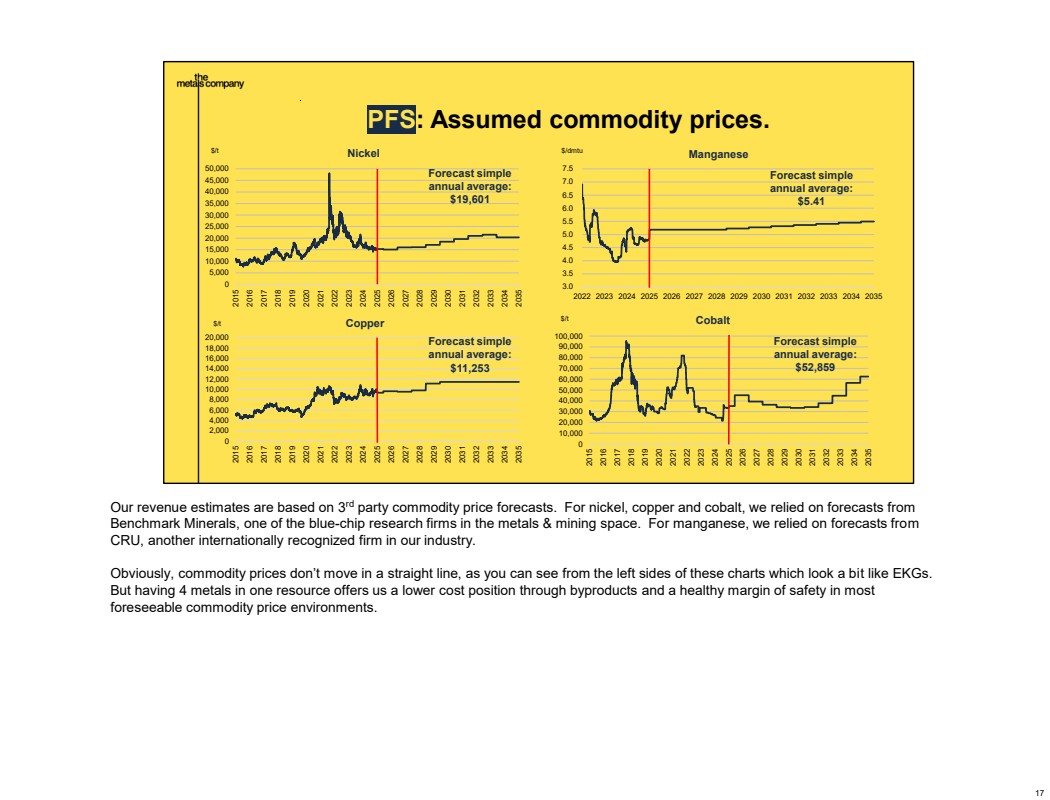
| 18 PFS: what offshore operation will cost. Collection vessels Other Transport vessels Fuel (collection + transport) 0 20 40 60 80 100 120 140 160 180 200 NORI-D to Asia Nodule collection & transport OPEX $ per dry tonne of nodules, steady state 2031-2043 $179 Note: $179 per dry tonne of nodules translates to $129 per wet tonne of nodules. ‘Transport vessel’ cost includes ~$2 per dry tonne shipping cost from Indonesia to Texas for refining. The total offshore operating costs associated with this operation are approximately $179 per dry tonne, which is equivalent to about $129 per wet tonne. The moisture content does vary a bit throughout the CCZ, but for the NORI-D area, our PFS is running 28% moisture content. Most of these offshore costs are spent on collection, but transport is also a significant expense as nodules headed to Japan need to be transferred to smaller vessels in Japan and all intermediate materials must travel through the Panama Canal for refining on the Gulf of America. 18 |
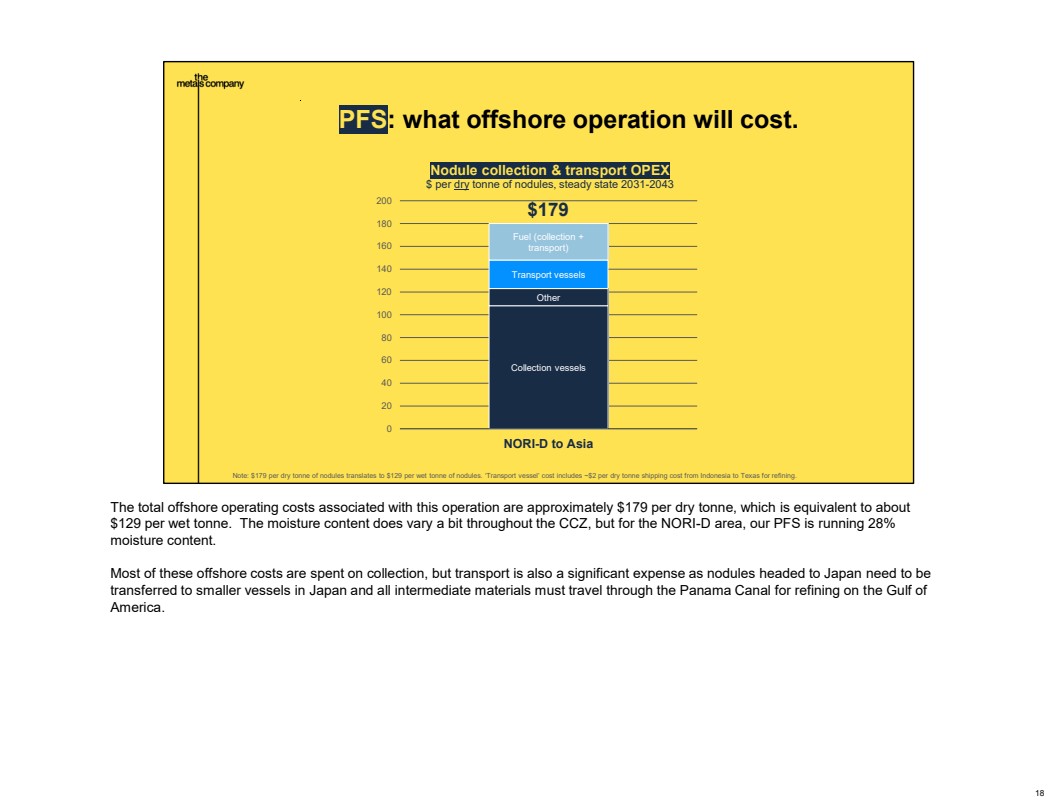
| 19 PFS: nodule processing & refining. I’d now like to again play a short video as the nodules continue their journey to the onshore component of operations: Video narration: The nodules will get transferred to a shuttle carrier and head to shore. Here, they'll be offloaded onto a conveyor and into a port side plant. Inside the plant, the nodules are heated in a rotary kiln and then melted in an electric arc furnace. The melted mass separates into two streams, a manganese silicate product that goes into production of manganese alloys and an alloy that contains high grade nickel, copper and cobalt. Using a multi-step process, we recover critical metals from the alloy typically converting it to matt first with flexibility to refine further for use in energy, defense and infrastructure. The entirety of each nodule's mass can be turned into products. Our metallurgical process produces near zero solid waste. In the future, the plant will be able to recover these metals at end of life and return them into circulation again and again. 19 |
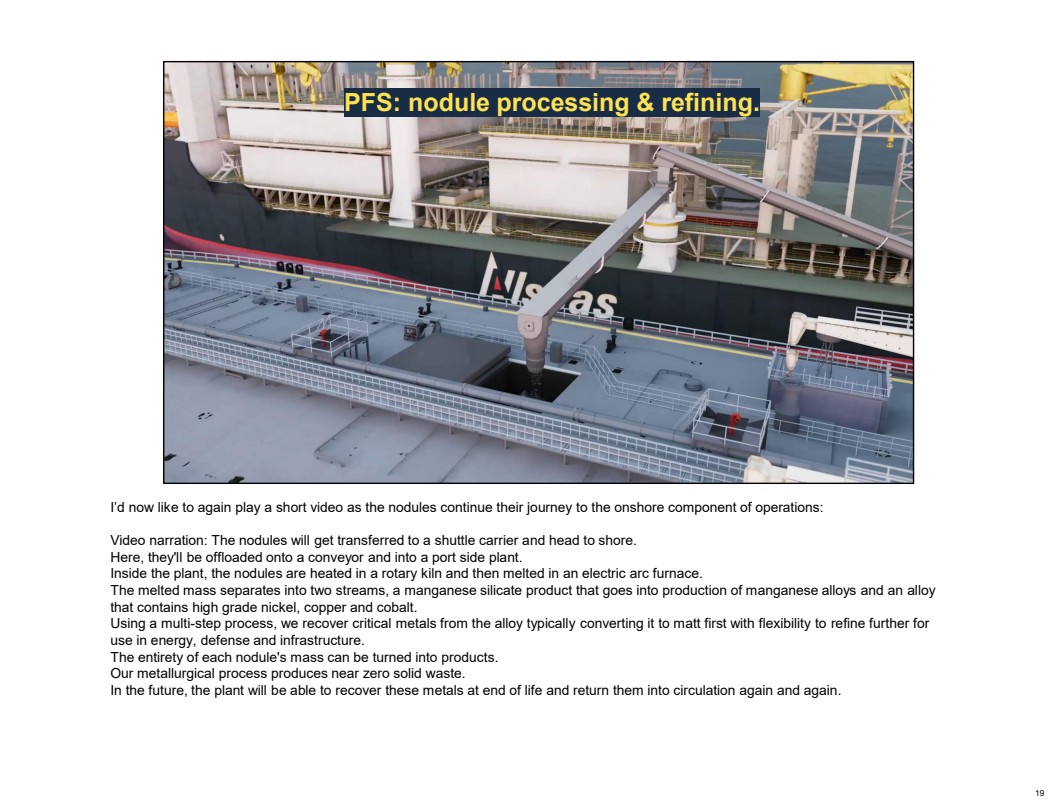
| 20 PFS: what onshore operations will cost. Processing Refining 0 20 40 60 80 100 120 140 160 RKEF (Asia), refining (USA) Processing & refining OPEX $ per dry tonne of nodules, steady state 2031-2043 $141 Note: $141 per dry tonne of nodules translates to $102 per wet tonne of nodules. Does not include ~$2 per dry tonne shipping cost (included instead in offshores costs) from Indonesia to Texas. Onshore, most of the operating costs come from processing, an energy and consumables intensive operation. The vast majority of the $141 opex per dry tonne during steady state years goes to production of intermediate matte material, through tolling fees paid to Asian partners. 20 |
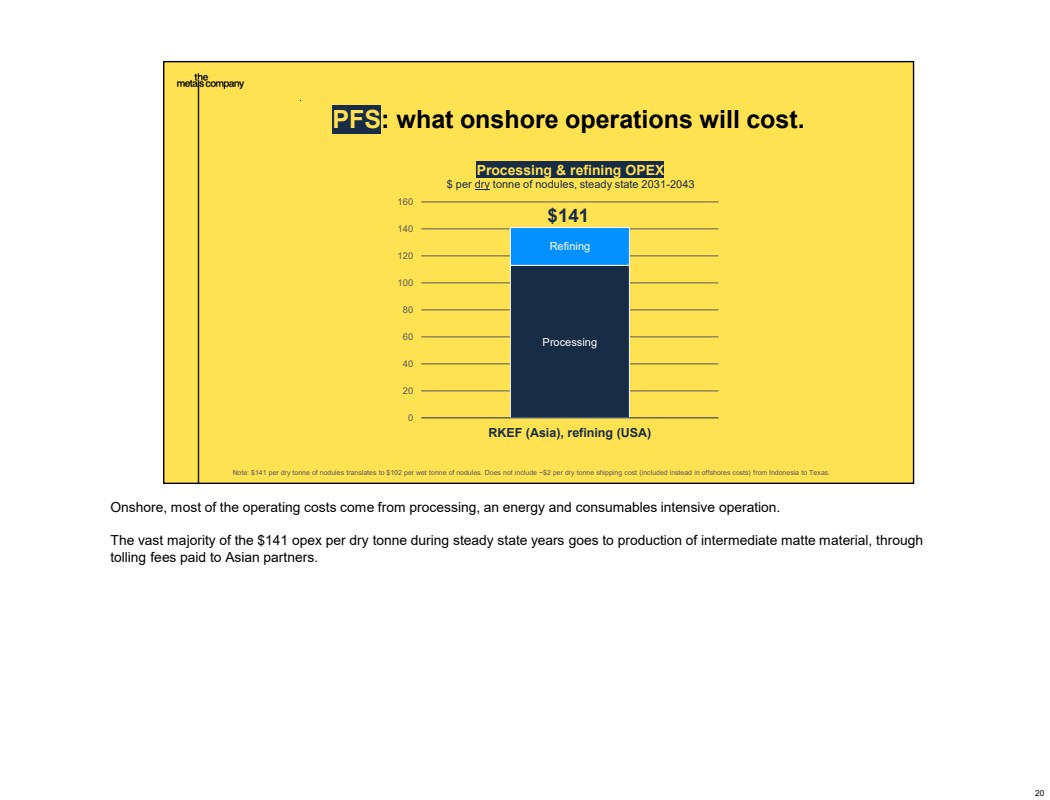
| 21 PFS: 1st quartile of the nickel cost curve. Source: CRU and TMC. TMC cost estimates have been provided by TMC and not independently verified by CRU. Underlying byproduct credit assessments align with CRU’s price assessments conducted in Q1 2024 for TMC to align with feasibility study. Production estimates for TMC are an average steady state production of 97 kt/y of nickel. Small outlier volumes have been removed from the cost curve for visual assistance. These assets account for ~35 kt of production at the bottom and top of the cost curve. Costs are inclusive of byproduct sales. 0 200 400 600 800 1,000 1,200 1,400 1,600 1,800 2,000 2,200 2,400 2,600 2,800 3,000 3,200 3,400 3,600 3,800 4,000 $/t Ni Cumulative Nickel Production (kt) Other production TMC 1 st quartile 2 nd quartile 3 rd quartile 4 th quartile Nickel C1 Cost Curve 2025 Value-adjusted cash costs, excluding royalties $20k $10k TMC: $1,065/t nickel C1 cash costs incl. byproduct credits Where does this put TMC on the cost curve? Including our valuable byproducts of copper, cobalt and manganese, estimated to account for about 55% of total revenue, our C1 nickel cash costs are just over $1k per tonne. That’s lower than nearly all producers outside of Russia… including Indonesia. Indonesia, of course, primarily produces nickel pig iron (or NPI), and Shanghai Metal Markets recently estimate that the average NPI producer in the world is underwater, a current margin of -4% on average. Even on an all-in sustaining cost basis, our nickel costs incl. byproduct credits would just be over $2.5k per tonne. Said simply: we expect to be profitable in any commodity price environment. 21 |
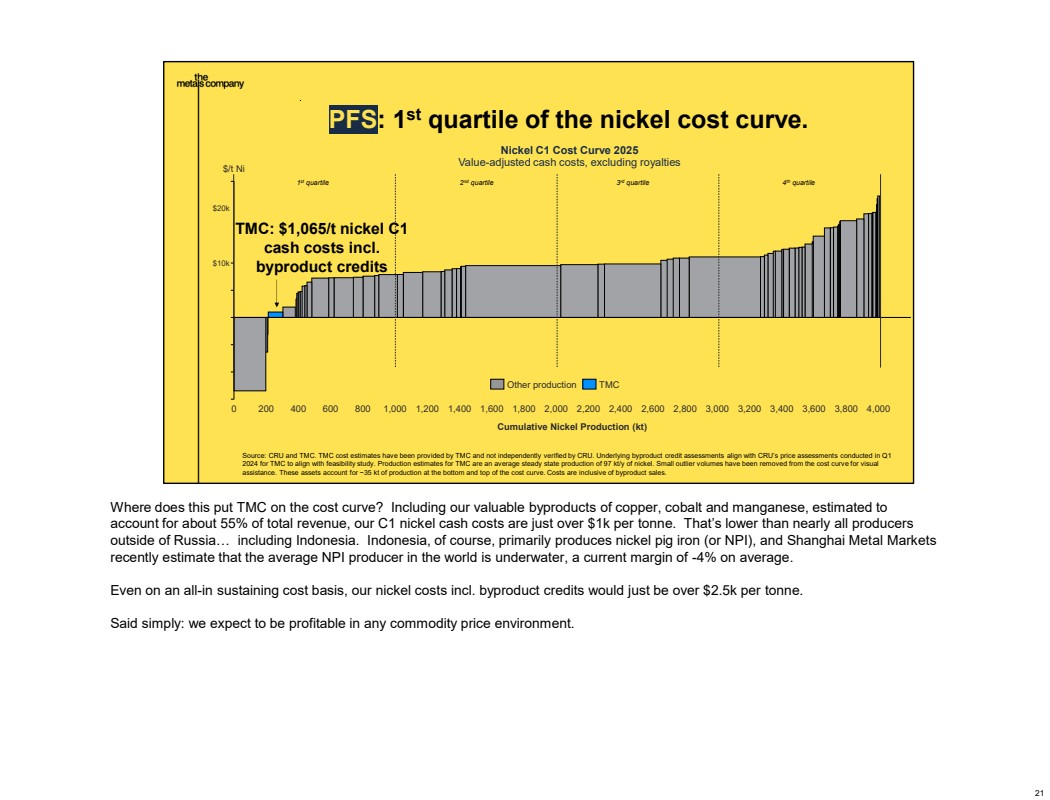
| 22 PFS: Operating margins remain robust. Offshore OPEX 179 Onshore OPEX 141 Royalties, Overhead & Other; 20 0 100 200 300 400 500 600 Operating economics $ per dry tonne of nodules, steady state 2031-2043 $595 revenue $254 (43%) EBITDA Note: EBITDA of $254 per dry tonne of nodules translates to $183 per wet tonne of nodules Putting it all together, with our steady state revenue per dry tonne of $595 and opex per tonne of $340 which accounts for corporate overhead and royalties too, we arrive at our EBITDA margin per tonne, expected to be about 43% or $254 per tonne during the steady state years defined as 2031 to 2043. During that time, of course, we expect to transition from mainly selling matte from Asia to mainly selling higher value refined products like nickel sulfate, cobalt sulfate and copper cathode in the United States. So the early 2030s would see EBITDA margins in the low 30s, but by 2040, that EBITDA margin is closer to 50%. This anticipating ramp-up in profitability is what makes the juice worth the squeeze on spending some onshore refinery capex after we begin production, while also taking a huge step toward helping the U.S. establish mineral independence. 22 |
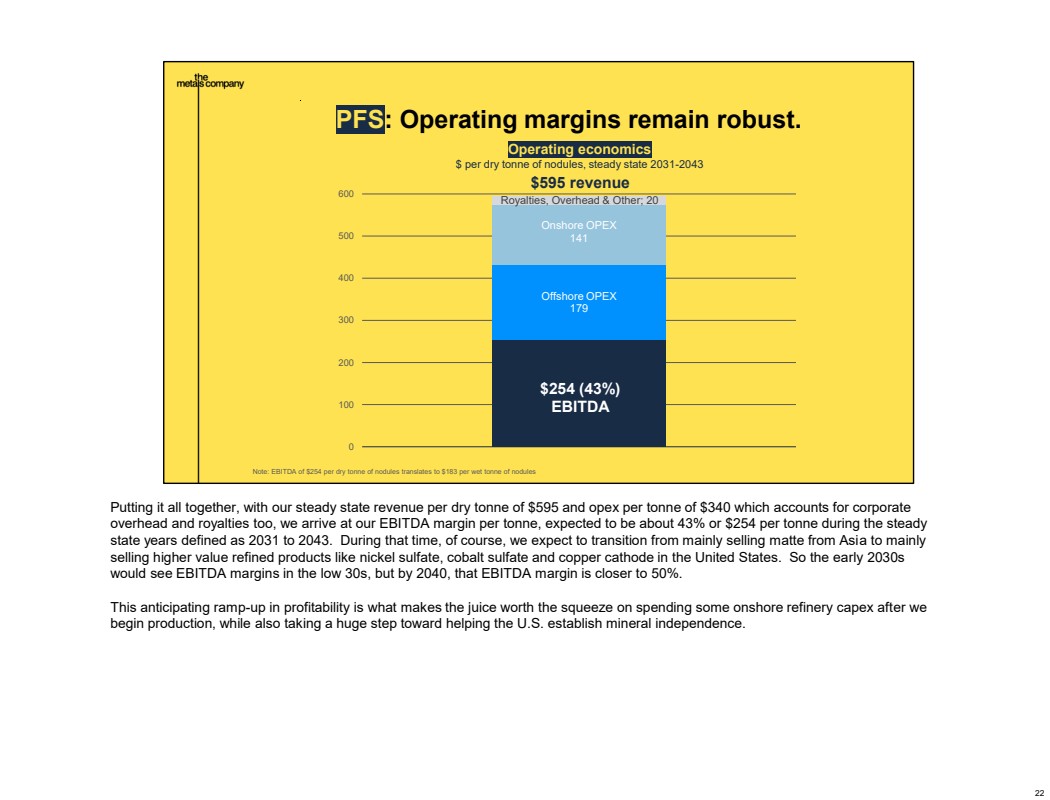
| 23 PFS: Strong project economics. 2021 IA 2025 PFS Approach New build1 Capital-light Recoverable nodules in wet tonnes 254 Mt 164 Mt Post-tax NPV (9% discount rate in 2021 IA; 8% in 2025 PFS) $6.8B $5.5B IRR (real terms) 29% 27% Revenue over life of project $95.1B $69.9B Revenue per tonne of dry nodules, steady state $503 $595 EBITDA over life of project $57.3B $29.2B EBITDA per tonne of dry nodules, steady state $306 $254 EBITDA margin per tonne, steady state 60% 43% C1 Cash cost per tonne of nickel incl. byproduct credits -$5,281 $1,065 All-In Sustaining Cost (AISC) per tonne of nickel incl. byproduct credits -$1,423 $2,569 1 Offshore, 50% of capacity was assumed to be new build, 50% drillship conversions; onshore, ~60% of RKEF capacity was assumed to be new build, 40% contracted on a tolling basis. Source: SK-1300 NORI-D Initial Assessment, March 2021; SK-1300 Technical Report Summary of Pre-feasibility Study of NORI-D area, August 2025. ‘Steady state’ was defined as 2030- 2045 in 2021 IA, while ‘steady state’ is defined as 2031-2043 in 2025 PFS. This new PFS reflects less revenue and profitability than the 2021 IA, but also a lighter capex burden, much of which isn’t spent until the 2030s. This is why the NPVs and returns are still within a similar ballpark, along with an 8% discount rate vs. 9% in the IA. We believe this is appropriate given how much de-risking on this project has occurred onshore and offshore in the last 4 years, not to mention a clearer permitting path ahead through the United States. 23 |
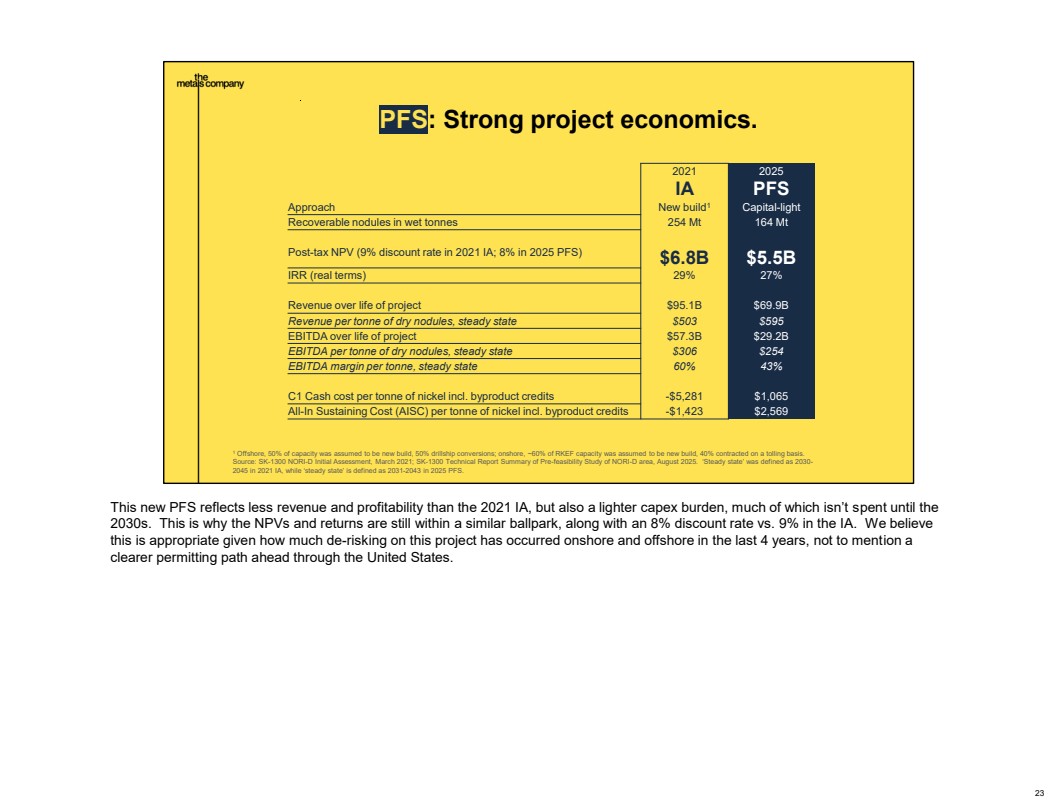
| 24 PFS: Sensitivity of $5.5B NPV. ($800.0) ($600.0) ($400.0) ($200.0) - $200.0 $400.0 $600.0 $800.0 Cobalt Product Price PAMCO - Matte Costs Sustaining Capex USA - Refined Costs Allseas Contractor Costs Overheads Costs Copper Product Price Transfer & Shipping Costs Marine Fuel Consumable Price Cobalt Sulfate Byproduct Price Offshore Consumables Costs Copper Cathode Byproduct Price Project Capex Nickel Product Price INDO - Matte Costs Collection Costs Manganese Product Price Nickel Sulfate Byproduct Price US$M NPV -20% 20% As one might expect, the PFS NPV is most sensitive to product prices: primarily nickel (and the nickel sulfate premium) and manganese prices. After that, the most sensitive cost inputs are offshore collection costs and the costs to produce matte material from Indonesian RKEFs. 24 |
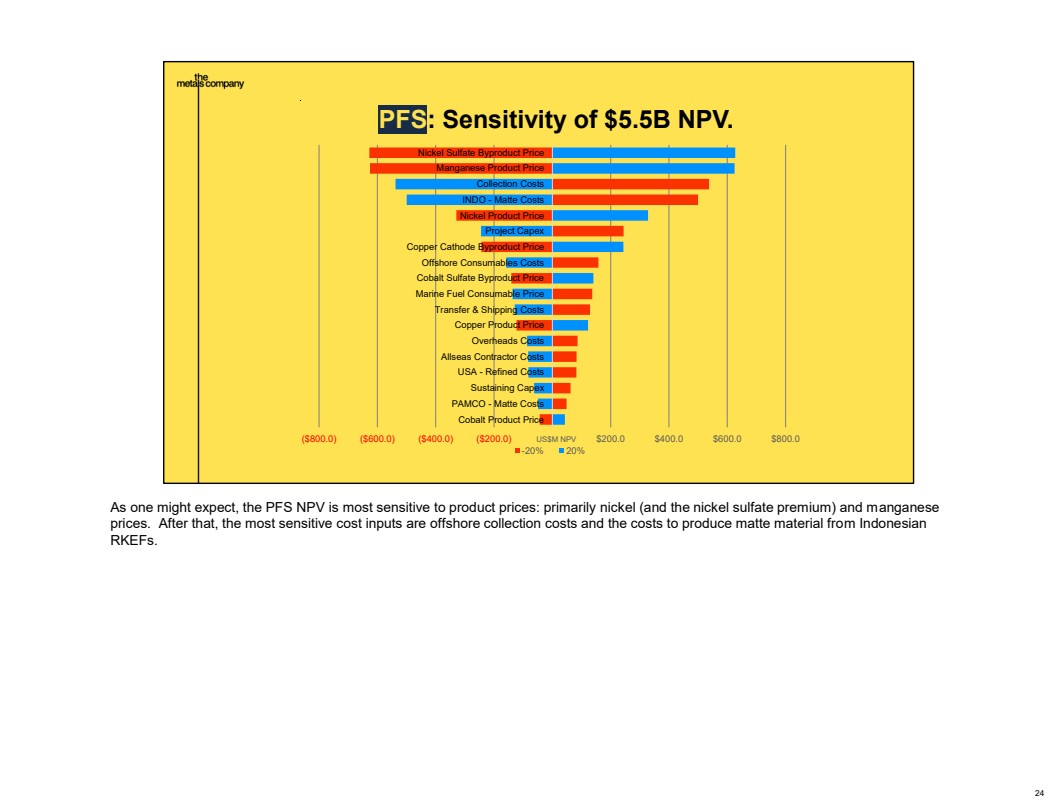
| 25 IA: Shows potential of the rest of our resource. NPV: $18,081 million IRR: 36% Area: 124,383 km2 TOML + NORI excl. NORI-D Resource: 1,276 Mt resource Recoverable nodules: 670 Mt Production start: 2037 Life of Mine: 23 years Steady state production: 40 Mtpa of wet nodules - 8,170kt Mn in Mn silicate - 36/ 27/ 5kt NiCuCo in matte - 318kt Ni in Ni sulfate - 245kt Cu cathode - 46kt Co in Co sulfate Offshore production assets (contracted): - 8 production vessels each with 3 x 20m collectors - No need for transfer vessels due to DP-enabled bulk carriers Onshore production assets: - RKEF plants (Indonesia) - Refinery (USA) IA The 2nd study just published is a new Initial Assessment, which shows the potential of the resource beyond NORI-D. The estimated amount of recoverable nodules for this study is 670 million wet tonnes. Assumed production start is 2037, with a life of mine 23 years. The Initial Assessment assumes contracted service offshore, with 8 production vessels each equipped with 3 collectors at 20 meters each. 25 |
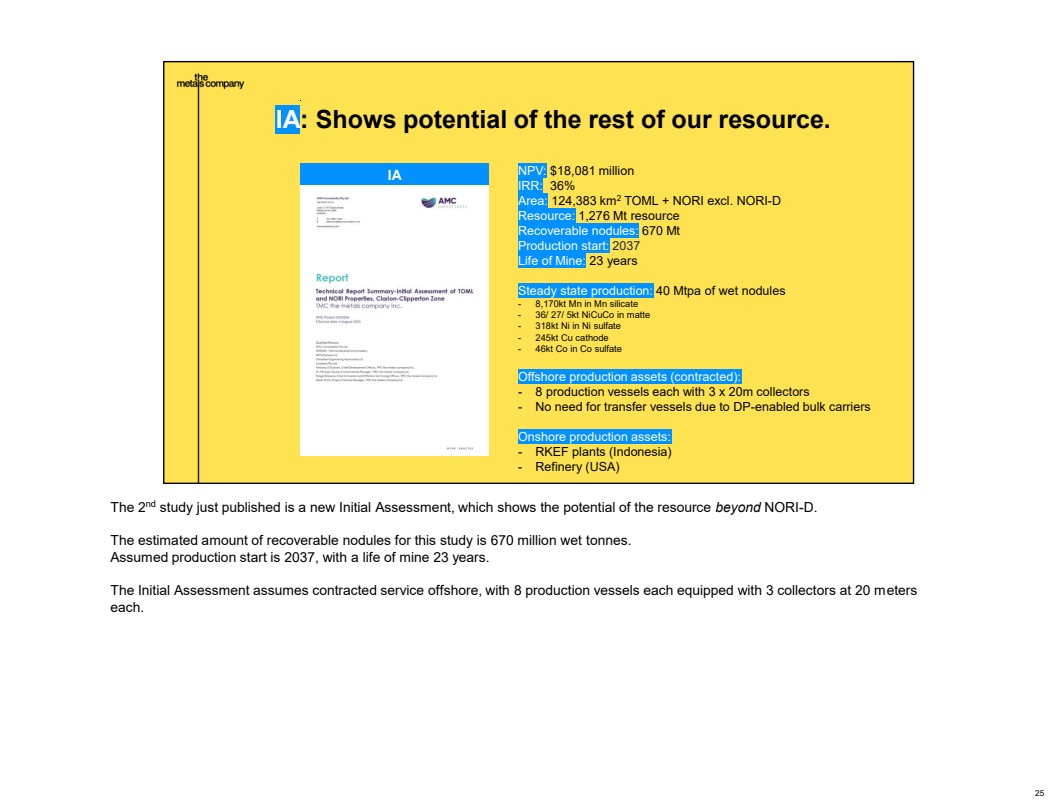
| 26 Pacific Ocean IA: Simplified logistics. United States Indonesia Gulf of America REFINING COLLECTION PROCESSING Let’s now move to a map of what the Initial Assessment logistics are expected to look like. This map is fairly simple , with just two legs to the journey: - Nodules delivered from the CCZ to Indonesia via cape-size bulk carriers with dynamic positioning, and - Delivering matte from Indonesia to Texas through the Panama canal on handymax vessels. 26 |
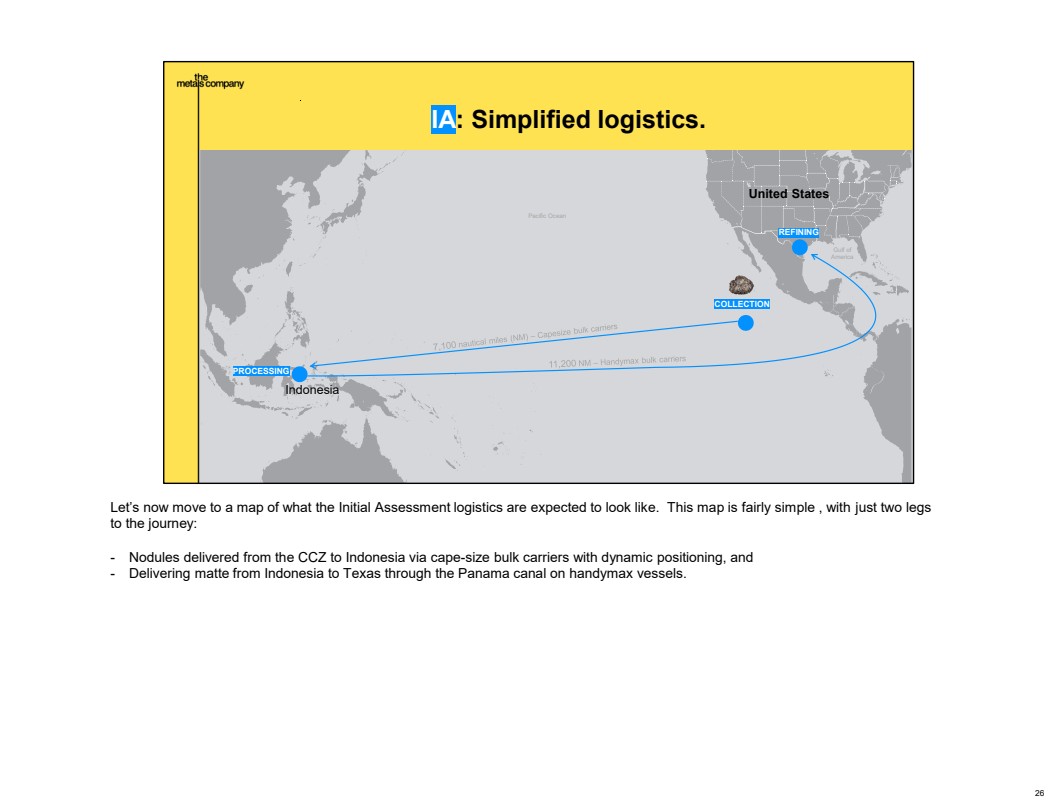
| 27 PFS + IA = economic potential of 1.6Bt resource. 2025 PFS 2025 IA Combined Approach Capital-light Contracted Resource base 363 Mt 1,276 Mt 1,639 Mt Recoverable nodules in wet tonnes 164 Mt 670 Mt 834 Mt Post-tax NPV8 $5.5B $18.1B $23.6B IRR (real terms) 27% 36% Revenue over life of project $69.9B $298.9B $368.8B Revenue per tonne of dry nodules, steady state $595 $607 EBITDA over life of project $29.2B $171.9B $201.1B EBITDA per tonne of dry nodules, steady state $254 $347 EBITDA margin per tonne, steady state 43% 57% C1 Cash cost per tonne of nickel incl. byproduct credits $1,065 -$6,939 All-In Sustaining Cost (AISC) per tonne of nickel incl. byproduct credits $2,569 -$5,903 Note: ‘Steady state’ defined as 2031-2043 for 2025 PFS and 2039-2058 for 2025 IA. Putting it all together, adding up the NPV of $18.1 billion for the IA and $5.5 billion for the PFS, we arrive at a total estimated resource NPV for $23.6 billion. Over the life of both projects, on an undiscounted basis, revenue of approximately $369 billion, EBITDA in excess of $200 billion, and a position in the first quartile of the cost curve that makes this model very difficult to break across any commodity cycle. 27 |
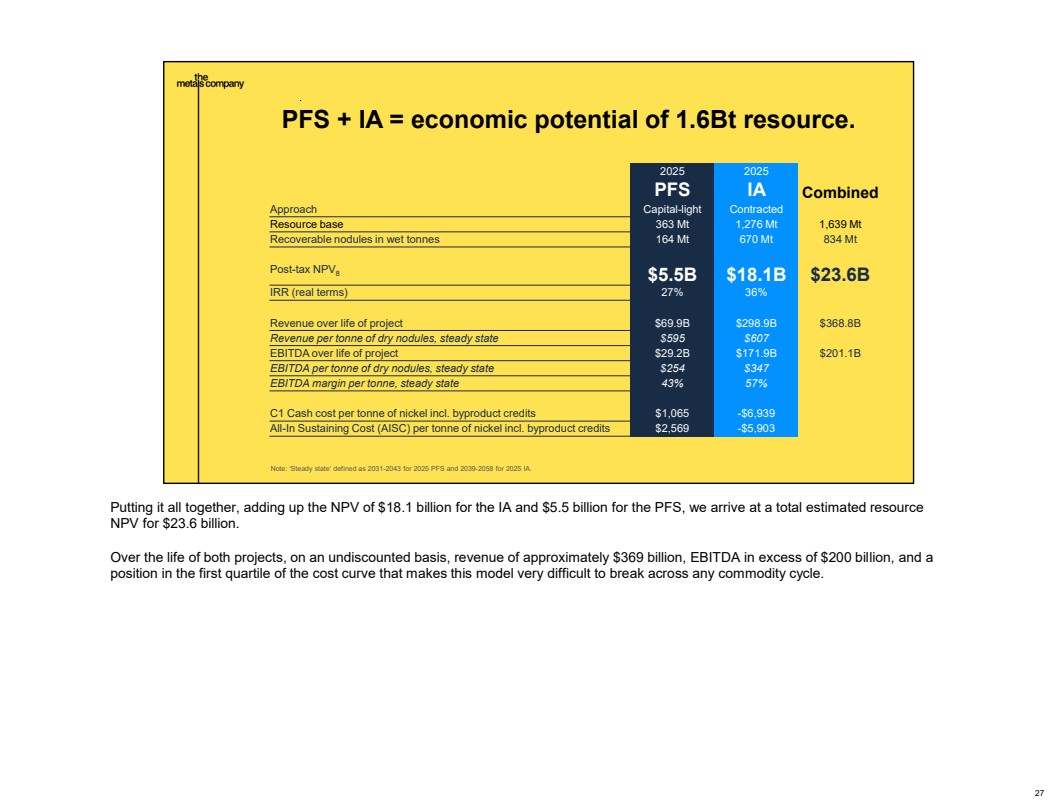
| 28 Source: Cantor Fitzgerald comparable company analysis, July 2025 * TMC current valuation based on combined PFS and IA NPVs of $23.6 billion and closing market capitalization as of August 1, 2025. We are still undervalued. 0.0 0.2 0.4 0.6 0.8 1.0 1.2 TMC today* FPX Nickel Lifezone Metals Chalice Mining Premium Nickel Talon Metals Bravo Mining Magna Mining Market cap/NAV of nickel developers and explorers 0.0 0.2 0.4 0.6 0.8 1.0 1.2 Vale Ivanhoe IGO South32 Lundin First Quantum Nickel Industries BHP Market cap/NAV of nickel / copper producers Average P/NAV: 1.0x TMC illustrative valuation based on comps: (PFS NPV x 50%) + (IA NPV x 35%) = $10 billion Average P/NAV: 0.35x Despite the undeniable quality and size of this resource, and our expected position in the first quartile of the cost curve, we remain undervalued compared to peer developers and explorers... On the left side of the page, you’ll see a TMC valuation example for illustrative purposes only: - Using upper end of nickel developer/explorer valuations applied to the PFS NPV: $5.5B x 50% = $3.75B - Using average of nickel developer/explorer valuations applied to the IA NPV: $18.1B x 35% = $6.33B - Total illustrative market value based on comps: $10.1B, or ~$25 per current shares - From there, you can see on the right side of this page what nickel or copper producers trade at as a multiple of NAV, showing the potential for multiple expansion as production approaches and begins. 28 |
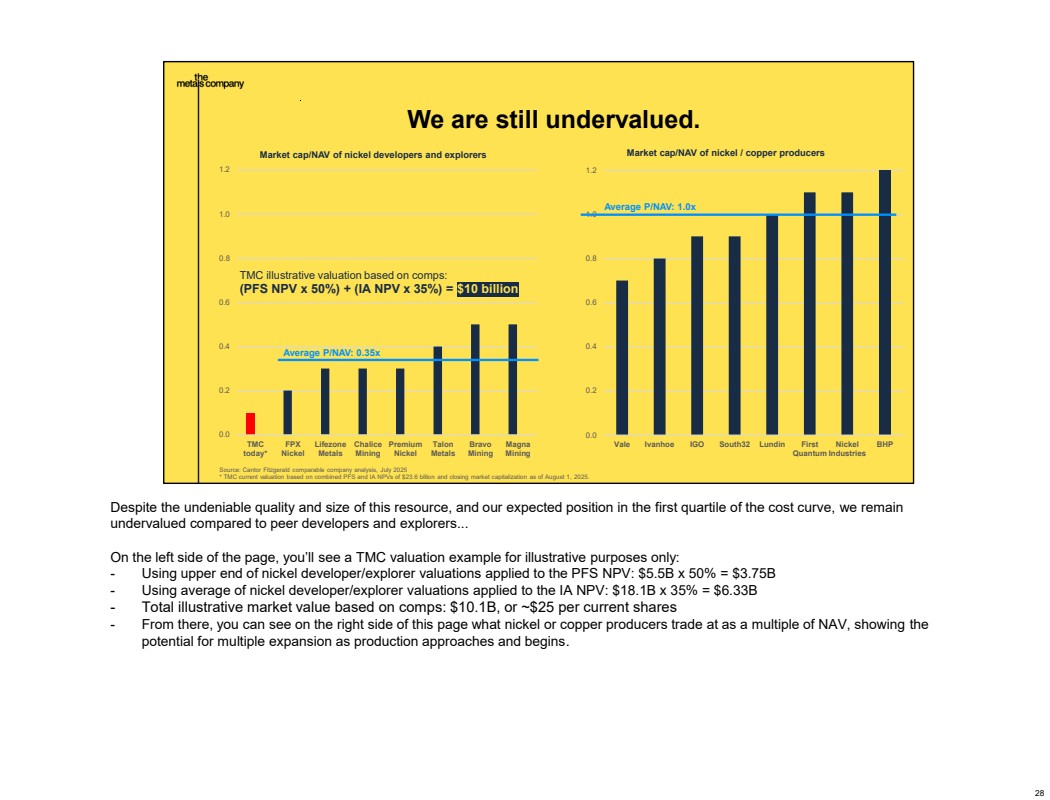
| 29 How we get started. $113M Hidden Gem pre-production CAPEX (TMC initial share) + + $113M TMC payback to Allseas once in production NODULE PROCESSING PAMCO: Tolling INTERMEDIATE REFINING, PCAM KZ: potential offtake / tolling Ktpa: thousands of tonnes per annum Mtpa: million of tonnes per annum Source: management estimate based on discussions with strategic partners; August 2025 NODULE COLLECTION & TRANSPORT Allseas: Co-financing & contract 1.5mpta wet nodules to start, growing to 3mpta 30/22/2.4 ktpa NiCuCo MANGANESE SMELTER Multiple parties: Offtake 685 ktpa Mn silicate How do we get started? We rely on existing assets: - To start nodule collection and transport, together with Allseas, we will make modifications to the Hidden Gem vessel to get it ready for first production. We anticipate that the direct capex costs for TMC on the Hidden Gem vessel, pre-production and excluding any contingences, will be $113 million. Once production begins, we expect to pay back Allseas for their $113 million investment in the first few years of production. - To start processing nodules, PAMCO needs to make minor modifications to its RKEF plant in Japan. Subject to us reaching a mutually agreeable commercial terms, they will finance these investments. Prior to our pivot to the U.S. when we were not subject to restrictions with regard to the return of nodule-derived materials back to the United States, we imagined we would stop here and just produce two products: a manganese silicate and a NiCuCo intermediate product. To the end, we secured Letters of Interest for the production of the Hidden Gem: - Interest in our manganese product exceeded our expected production over 3 times. - Interest in our intermediate NiCuCo product exceeded production over 4 times. But now that we have moved to the U.S. jurisdiction, we are facing the requirement to return nodule-derived materials to the United States, The offtake puzzle we must solve now is more complex: the United States is missing the downstream value chain to be able to consume our intermediate products. This means that we have to either toll our way to product formats that can be consumed in the United States or make similar arrangements to ensure our nodule-derived material end up being consumed in the United States. This was the driving force behind our strategic partnership with Korea Zinc – they can both, take our intermediate product and take it to product formats that can be consumed by the United States AND build a similar facility in the United States to fill the value chain gap. 29 |
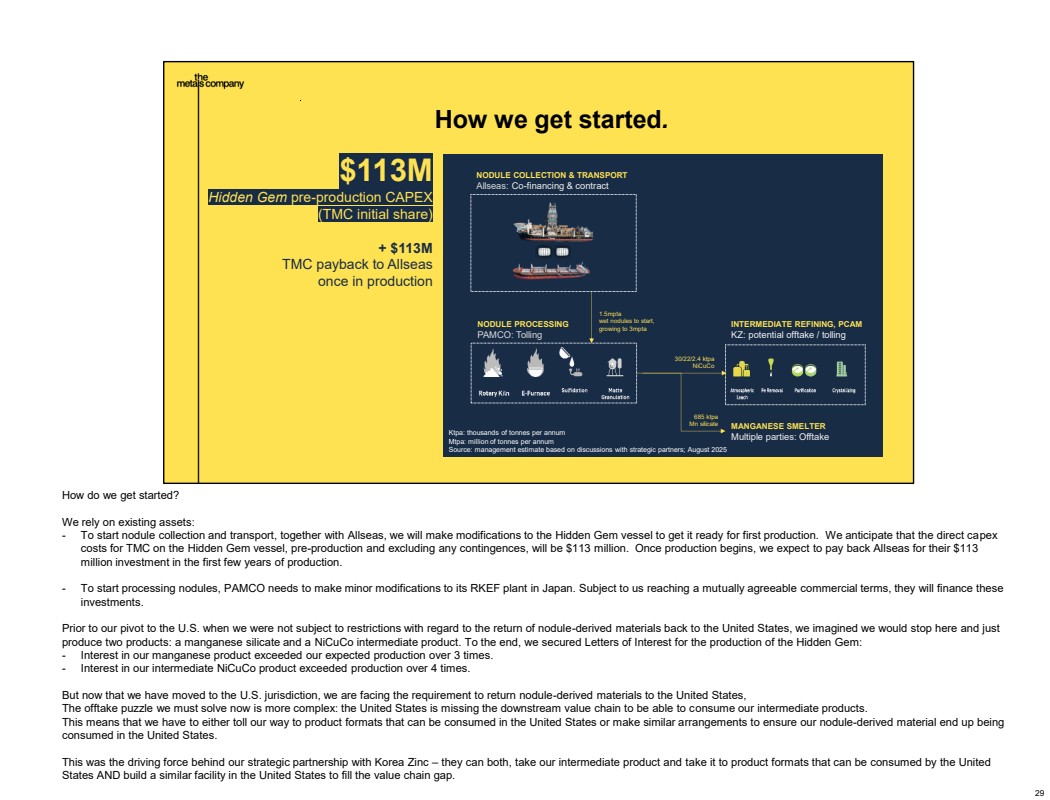
| 30 Targeting Q4 2027 to start production. CRP: Commercial Recovery Permit EIS: Environmental Impact Statement FID: Final Investment Decision pCAM: precursor Cathode Active Materials RKEF: Rotary Kiln Electric Arc Furnace TCRs: Terms, Conditions & Restriction Source: TMC management estimates 2025 2026 2027 Q3 Q4 Q1 Q2 Q3 Q4 Q1 Q2 Q3 Q4 Permitting Provisional CRP? Final CRP? Offshore system RFP packages Order long lead items Start production RKEF (Japan) FID Ready for production Refinery & pCAM (Korea) Ready for production Last year, we told the market that we’d hold off on any pre-production development capex until the ISA delivered a Mining Code. After seeing the continued dysfunction at the ISA over the last several meetings, it seems that their constantly moving target for adoption will keep on shifting to the right. But now, our confidence in the U.S. regulations has opened up a very alliterative possibility: a parallel path for permitting and preparation for production. With the support of key partners and our Board, we are pursuing a strategy that will allow us to get ready for production when we have sufficient certainty that a commercial recovery permit is coming, even if the official grant takes some additional time. This approach threads the needle of achieving a high permitting likelihood, based on all available information from our constant communication with the U.S. gov’t, while getting into production as soon as we can thereafter even if 100% certainty is not yet there. It also means that the actual date of a CRP grant can shift around some months or even quarters, without impacting our start date. 30 |
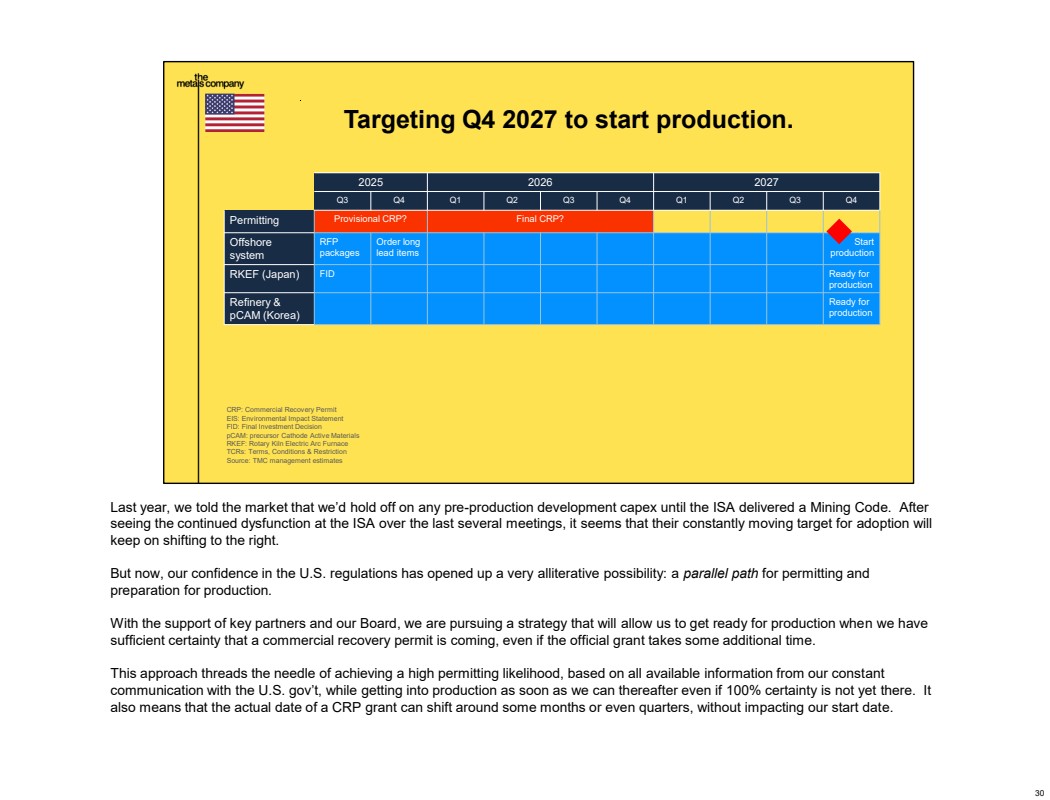
| 31 Strong data for a NEPA-compliant EIS. Biodiversity loss Concern: “Mining could lead to the extinction of species unknown to science.” Our work is making deep-sea species known to science at an unprecedented rate. ~43% of the CCZ is already set aside for protection. Midwater plumes Concern: “Midwater plumes could travel over a 1,000 km and poison tuna fisheries.” In-field data shows limited and very diluted midwater plume, released far deeper than fisheries. Noise Concern: “Noise from operations could disrupt whales’ communications.” Risk of injury to animal hearing from the sound generated by the scaled-up NORI deep sea mining activity is relatively low. Habitat destruction Concern: “Mining would irreversibly destroy ancient deep-sea habitats.” Nodule collection in the CCZ could change the habitat of 0.18% of the seafloor at most, and life returning to test area after just one year. Seafloor plumes Concern: “Seafloor plumes could travel 10,000s km beyond mining sites.” In-field observed data shows very localized and limited seafloor plume impact, with 95% of mobilized mass resettling within 1 km. Carbon Concern: “Planet’s biggest carbon sink could be disturbed.” Most ocean carbon is in the seawater, not the sediment. Further, no known path for seafloor carbon to reach atmosphere. But it’s not just one CRP that we’re hoping to get. Over the coming years, we’re looking to get a CRP again, and again, and again…no matter who sits in the Oval Office. That’s why the science remains at the forefront. Thankfully, the environmental data we’ve collected speaks for itself. We have now gathered over one petabyte of data alongside some of the finest research institutions globally. To give you a sense of scale, the largest library in the world, the U.S. Library of Congress, manages about 20 petabytes of data in total. We are now preparing our NEPA-compliant environmental impact statement to show there are no showstoppers across all of the key environmental questions. Our Environmental Manager, Dr. Michael Clarke, will provide some additional detail on this process a bit later today. Bottom line: we have the confidence today that we should move forward. 31 |
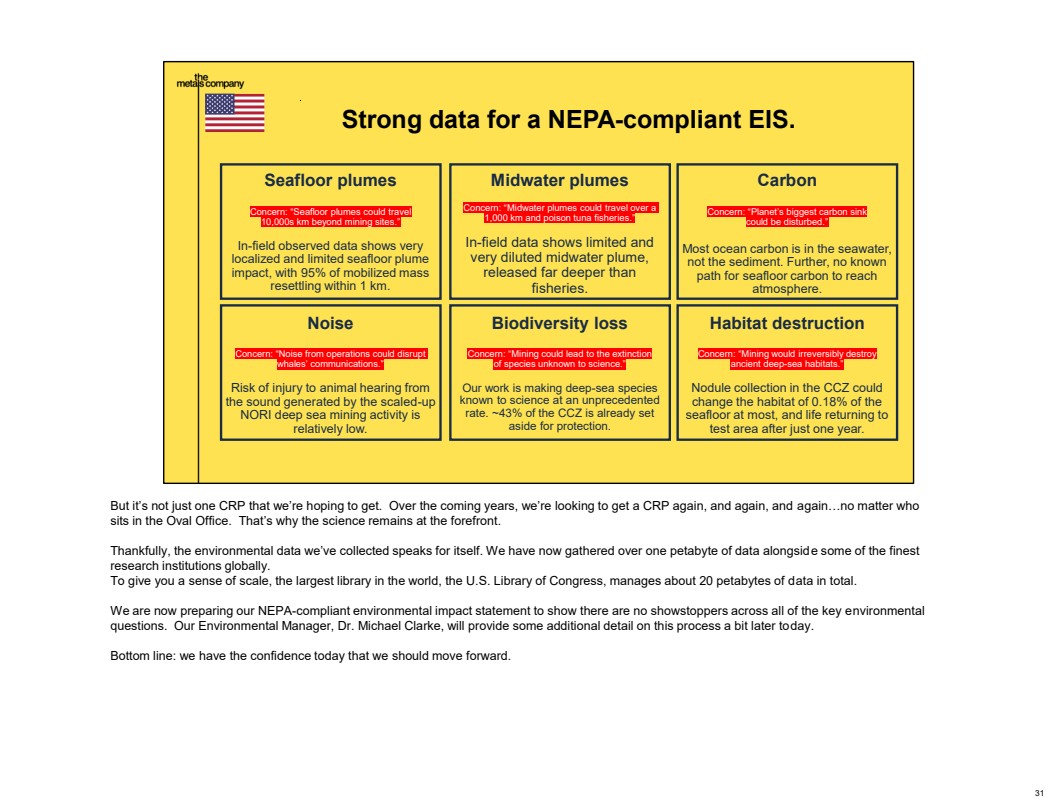
| 32 Zero to One. 51 Mt probable reserves Low cost. Starting capital-light. Starting soon. Valuable. Commercially viable. $113M Hidden Gem pre-production CAPEX (TMC initial share) + + $113M TMC payback to Allseas once in production Q4 2027 estimated first production $5.5 B PFS NPV $18.1 B IA NPV We’ve gone through a lot of data already today. But there a handful of key numbers and concepts that I liked to hammer home as we all visualize where this company is headed: - This project is very valuable: - $5.5B NPV on the PFS… the world’s-first ever PFS for a nodule collection project - $18.1B NPV on an updated initial assessment, showing what this project can be beyond NORI-D. - We’ve now demonstrated that this is commercially viable by a strict SEC Sk-1300 definition, with 51mt probable reserves….also a world-first for seafloor resources. - A position in the first quartile on the cost curve that can help us withstand any commodity market volatility - And we are starting with a capital light approach, and starting very soon, with expected first production in Q4 2027, with modest capex on Hidden Gem thanks to the support of our partner Allseas. Said simply, We are developing very good ground in a very good neighborhood, with a very large head start. We’ve been adding to our coalition of world-class partners, thanks in no small part to our progress with the U.S. gov’t. And we think this pace of strategic support is only going to accelerate as we approach commercial production, with a PFS and reserves in hand, as the ONLY commercially viable deep seabed resource opportunity in the coming years for any potential customers, commercial partners, and of course, public shareholders. Our partners and shareholders in this room today have seen us through some very dark days. Many other companies would have faced these odds and never gotten off the starting block, stuck on Zero. But with your support, the path from Zero to One is clear. And from there? The sky is the limit. 32 |

| 33 ZERO TO ONE: PROJECT ECONOMICS Craig Shesky, CFO August 2025 33 |