
| Page | |||||
| Earnings Release | |||||
| Consolidated Statements of Operations | |||||
| Consolidated Balance Sheets | |||||
| Schedule 1 - Funds From Operations and Core Funds From Operations | |||||
| Schedule 2 - Other Non-GAAP Financial Measurements | |||||
| Schedule 3 - Portfolio Summary | |||||
| Schedule 4 - Debt and Equity Capitalization | |||||
| Schedule 5 - Summarized Information for Unconsolidated Real Estate Ventures | |||||
| Schedule 6 - Same Store Performance Summary By MSA | |||||
| Schedule 7 - Same Store Operating Data - Trailing Five Quarters | |||||
| Schedule 8 - Reconciliation of Same Store Data and Net Operating Income to Net Income | |||||
| Schedule 9 - Selected Financial Information | |||||
| Glossary | |||||
($ in thousands, except per share and unit data) | Three Months Ended June 30, | Six Months Ended June 30, | |||||||||||||||||||||||||||||||||
| 2025 | 2024 | Change | 2025 | 2024 | Change | ||||||||||||||||||||||||||||||
| Net income | $ | 30,958 | $ | 32,280 | (4.1) | % | $ | 50,477 | $ | 127,368 | (60.4) | % | |||||||||||||||||||||||
Funds From Operations ("FFO")(1) | $ | 72,341 | $ | 70,118 | 3.2 | % | $ | 143,319 | $ | 142,012 | 0.9 | % | |||||||||||||||||||||||
Add acquisition costs | 457 | 480 | (4.8) | % | 860 | 987 | (12.9) | % | |||||||||||||||||||||||||||
Add integration and executive severance costs(2) | 1,583 | 626 | 152.9 | % | 3,625 | 626 | 479.1 | % | |||||||||||||||||||||||||||
Core FFO(1) | $ | 74,381 | $ | 71,224 | 4.4 | % | $ | 147,804 | $ | 143,625 | 2.9 | % | |||||||||||||||||||||||
Earnings per share - basic and diluted | $ | 0.19 | $ | 0.16 | 18.8 | % | $ | 0.29 | $ | 0.85 | (65.9) | % | |||||||||||||||||||||||
FFO per share and unit(1) | $ | 0.54 | $ | 0.61 | (11.5) | % | $ | 1.06 | $ | 1.20 | (11.7) | % | |||||||||||||||||||||||
Core FFO per share and unit(1) | $ | 0.55 | $ | 0.62 | (11.3) | % | $ | 1.09 | $ | 1.22 | (10.7) | % | |||||||||||||||||||||||
| (1) | Non-GAAP financial measures, including FFO, Core FFO and NOI, are defined in the Glossary in the supplemental financial information and, where appropriate, reconciliations of these measures and other non-GAAP financial measures to their most directly comparable GAAP measures are included in the Schedules to this press release and in the supplemental financial information. | |||||||||||||
| (2) | Executive severance costs relate to the three months ended June 30, 2024 and are recorded within the line items "General and administrative expenses" and "Non-operating income" in our consolidated statements of operations. Integration costs relate to expenses incurred as a part of the internalization of the PRO structure. | |||||||||||||
($ in thousands, except per square foot data) | Three Months Ended June 30, | Six Months Ended June 30, | |||||||||||||||||||||||||||||||||
| 2025 | 2024 | Change | 2025 | 2024 | Change | ||||||||||||||||||||||||||||||
Total revenues | $ | 168,975 | $ | 174,184 | (3.0) | % | $ | 337,632 | $ | 347,971 | (3.0) | % | |||||||||||||||||||||||
Property operating expenses | 52,720 | 50,407 | 4.6 | % | 104,965 | 100,810 | 4.1 | % | |||||||||||||||||||||||||||
Net Operating Income (NOI) | $ | 116,255 | $ | 123,777 | (6.1) | % | $ | 232,667 | $ | 247,161 | (5.9) | % | |||||||||||||||||||||||
| NOI Margin | 68.8 | % | 71.1 | % | (2.3) | % | 68.9 | % | 71.0 | % | (2.1) | % | |||||||||||||||||||||||
Average Occupancy | 84.2 | % | 86.6 | % | (2.4) | % | 84.1 | % | 86.2 | % | (2.1) | % | |||||||||||||||||||||||
Average Annualized Rental Revenue Per Occupied Square Foot | $ | 15.68 | $ | 15.72 | (0.3) | % | $ | 15.68 | $ | 15.79 | (0.7) | % | |||||||||||||||||||||||
| Current Ranges for Full Year 2025 | Prior Ranges for Full Year 2025 | Actual Results for Full Year 2024 | |||||||||||||||||||||||||||
| Low | High | Low | High | ||||||||||||||||||||||||||
Core FFO per share(1) | $2.17 | $2.23 | $2.30 | $2.38 | $2.44 | ||||||||||||||||||||||||
Same store operations(2) | |||||||||||||||||||||||||||||
Total revenue growth | (3.0)% | (2.0)% | (1.25)% | 1.25% | (3.0)% | ||||||||||||||||||||||||
Property operating expenses growth | 3.25% | 4.25% | 3.0% | 4.0% | 3.7% | ||||||||||||||||||||||||
NOI growth | (5.75)% | (4.25)% | (2.8)% | 0.0% | (5.5)% | ||||||||||||||||||||||||
General and administrative expenses | |||||||||||||||||||||||||||||
General and administrative expenses (excluding equity-based compensation), in millions | $42.0 | $44.0 | $45.5 | $47.5 | $49.7 | ||||||||||||||||||||||||
| Equity-based compensation, in millions | $8.0 | $8.5 | $8.0 | $8.5 | $7.9 | ||||||||||||||||||||||||
Management fees and other revenue, in millions | $49.0 | $51.0 | $49.5 | $51.5 | $42.7 | ||||||||||||||||||||||||
Core FFO from unconsolidated real estate ventures, in millions | $20.5 | $22.5 | $21.5 | $23.5 | $24.2 | ||||||||||||||||||||||||
Acquisitions - consolidated and joint venture (at share), in millions(3) | $50.0 | $100.0 | $100.0 | $300.0 | $101.8 | ||||||||||||||||||||||||
Dispositions - consolidated and joint venture (at share), in millions(3) | $100.0 | $300.0 | $100.0 | $300.0 | $273.1 | ||||||||||||||||||||||||
| Current Ranges for Full Year 2025 | Prior Ranges for Full Year 2025 | ||||||||||||||||||||||
| Low | High | Low | High | ||||||||||||||||||||
| Earnings per share - diluted | $0.71 | $0.74 | $0.63 | $0.69 | |||||||||||||||||||
Impact of the difference in weighted average number of shares and GAAP accounting for noncontrolling interests, two-class method and treasury stock method | (0.17) | (0.22) | (0.14) | (0.19) | |||||||||||||||||||
Add real estate depreciation and amortization | 1.43 | 1.46 | 1.47 | 1.50 | |||||||||||||||||||
| Add (subtract) equity in losses (earnings) of unconsolidated real estate ventures | 0.08 | 0.09 | 0.13 | 0.14 | |||||||||||||||||||
| Add NSA's share of FFO of unconsolidated real estate ventures | 0.15 | 0.17 | 0.16 | 0.17 | |||||||||||||||||||
| Less gain on sale of self storage properties | (0.08) | (0.08) | — | — | |||||||||||||||||||
Add acquisition costs and NSA's share of unconsolidated real estate venture acquisition costs | 0.01 | 0.02 | 0.01 | 0.02 | |||||||||||||||||||
Add integration costs | 0.04 | 0.05 | 0.04 | 0.05 | |||||||||||||||||||
Core FFO per share and unit | $2.17 | $2.23 | $2.30 | $2.38 | |||||||||||||||||||
| (1) | The table above provides a reconciliation of the range of estimated earnings per share - diluted to estimated Core FFO per share and unit. | |||||||||||||
| (2) | 2025 guidance reflects NSA's 2025 same store pool comprising 771 stores. 2024 actual results reflect NSA's 2024 same store pool comprising 776 stores. | |||||||||||||
| (3) | NSA's actual results for full year 2024 exclude the contribution of wholly-owned self storage properties into the 2024 Joint Venture for approximately $346.5 million. | |||||||||||||
| Three Months Ended June 30, | Six Months Ended June 30, | ||||||||||||||||||||||
| 2025 | 2024 | 2025 | 2024 | ||||||||||||||||||||
| REVENUE | |||||||||||||||||||||||
| Rental revenue | $ | 169,838 | $ | 174,369 | $ | 339,313 | $ | 354,751 | |||||||||||||||
| Other property-related revenue | 6,774 | 6,557 | 13,518 | 13,249 | |||||||||||||||||||
| Management fees and other revenue | 12,230 | 9,522 | 24,365 | 18,596 | |||||||||||||||||||
| Total revenue | 188,842 | 190,448 | 377,196 | 386,596 | |||||||||||||||||||
| OPERATING EXPENSES | |||||||||||||||||||||||
| Property operating expenses | 55,627 | 52,201 | 110,731 | 106,895 | |||||||||||||||||||
| General and administrative expenses | 12,804 | 16,189 | 25,949 | 31,863 | |||||||||||||||||||
| Depreciation and amortization | 47,612 | 46,710 | 95,728 | 94,041 | |||||||||||||||||||
| Other | 4,500 | 3,375 | 8,976 | 6,867 | |||||||||||||||||||
| Total operating expenses | 120,543 | 118,475 | 241,384 | 239,666 | |||||||||||||||||||
| OTHER (EXPENSE) INCOME | |||||||||||||||||||||||
| Interest expense | (41,269) | (37,228) | (81,744) | (75,345) | |||||||||||||||||||
Equity in (losses) of unconsolidated real estate ventures | (3,945) | (4,449) | (9,684) | (6,079) | |||||||||||||||||||
| Acquisition and integration costs | (2,040) | (480) | (4,485) | (987) | |||||||||||||||||||
| Non-operating income | 462 | 337 | 822 | 435 | |||||||||||||||||||
| Gain on sale of self storage properties | 9,571 | 2,668 | 10,996 | 63,841 | |||||||||||||||||||
| Other expense, net | (37,221) | (39,152) | (84,095) | (18,135) | |||||||||||||||||||
| Income before income taxes | 31,078 | 32,821 | 51,717 | 128,795 | |||||||||||||||||||
| Income tax expense | (120) | (541) | (1,240) | (1,427) | |||||||||||||||||||
| Net income | 30,958 | 32,280 | 50,477 | 127,368 | |||||||||||||||||||
Net income attributable to noncontrolling interests | (11,487) | (15,218) | (18,012) | (51,279) | |||||||||||||||||||
| Net income attributable to National Storage Affiliates Trust | 19,471 | 17,062 | 32,465 | 76,089 | |||||||||||||||||||
Distributions to preferred shareholders | (5,114) | (5,110) | (10,228) | (10,220) | |||||||||||||||||||
Net income attributable to common shareholders | $ | 14,357 | $ | 11,952 | $ | 22,237 | $ | 65,869 | |||||||||||||||
| Earnings per share - basic and diluted | $ | 0.19 | $ | 0.16 | $ | 0.29 | $ | 0.85 | |||||||||||||||
Weighted average shares outstanding - basic and diluted | 76,474 | 75,160 | 76,423 | 77,698 | |||||||||||||||||||
| June 30, | December 31, | ||||||||||
| 2025 | 2024 | ||||||||||
| ASSETS | |||||||||||
| Real estate | |||||||||||
| Self storage properties | $ | 5,826,852 | $ | 5,864,134 | |||||||
| Less accumulated depreciation | (1,131,235) | (1,051,638) | |||||||||
| Self storage properties, net | 4,695,617 | 4,812,496 | |||||||||
| Cash and cash equivalents | 26,121 | 50,408 | |||||||||
| Restricted cash | 1,824 | 345 | |||||||||
| Debt issuance costs, net | 4,244 | 5,632 | |||||||||
| Investment in unconsolidated real estate ventures | 231,360 | 246,193 | |||||||||
| Other assets, net | 195,453 | 218,482 | |||||||||
| Assets held for sale, net | 6,000 | — | |||||||||
| Operating lease right-of-use assets | 20,666 | 20,906 | |||||||||
| Total assets | $ | 5,181,285 | $ | 5,354,462 | |||||||
| LIABILITIES AND EQUITY | |||||||||||
| Liabilities | |||||||||||
| Debt financing | $ | 3,402,659 | $ | 3,449,087 | |||||||
| Accounts payable and accrued liabilities | 93,613 | 98,657 | |||||||||
| Interest rate swap liabilities | 4,041 | 471 | |||||||||
| Operating lease liabilities | 22,683 | 22,888 | |||||||||
| Deferred revenue | 20,607 | 20,012 | |||||||||
| Total liabilities | 3,543,603 | 3,591,115 | |||||||||
| Equity | |||||||||||
Preferred shares of beneficial interest, par value $0.01 per share. 50,000,000 authorized, 14,697,845 and 14,695,458 issued (in series) and outstanding at June 30, 2025 and December 31, 2024, respectively, at liquidation preference | 340,955 | 340,895 | |||||||||
Common shares of beneficial interest, par value $0.01 per share. 250,000,000 shares authorized, 76,558,740 and 76,344,661 shares issued and outstanding at June 30, 2025 and December 31, 2024, respectively | 765 | 763 | |||||||||
| Additional paid-in capital | 1,249,996 | 1,249,426 | |||||||||
| Distributions in excess of earnings | (595,627) | (530,652) | |||||||||
| Accumulated other comprehensive income | 5,993 | 15,548 | |||||||||
| Total shareholders' equity | 1,002,082 | 1,075,980 | |||||||||
| Noncontrolling interests | 635,600 | 687,367 | |||||||||
| Total equity | 1,637,682 | 1,763,347 | |||||||||
| Total liabilities and equity | $ | 5,181,285 | $ | 5,354,462 | |||||||
| Supplemental Schedule 1 | |||||||||||||||||||||||
| Funds From Operations and Core Funds From Operations | |||||||||||||||||||||||
| (in thousands, except per share and unit amounts) (unaudited) | |||||||||||||||||||||||
| Reconciliation of Net Income to FFO and Core FFO | |||||||||||||||||||||||
| Three Months Ended June 30, | Six Months Ended June 30, | ||||||||||||||||||||||
| 2025 | 2024 | 2025 | 2024 | ||||||||||||||||||||
| Net income | $ | 30,958 | $ | 32,280 | $ | 50,477 | $ | 127,368 | |||||||||||||||
| Add (subtract): | |||||||||||||||||||||||
| Real estate depreciation and amortization | 47,137 | 46,339 | 94,798 | 93,302 | |||||||||||||||||||
| Equity in losses of unconsolidated real estate ventures | 3,945 | 4,449 | 9,684 | 6,079 | |||||||||||||||||||
| Company's share of FFO in unconsolidated real estate ventures | 5,440 | 6,177 | 10,492 | 11,862 | |||||||||||||||||||
| Gain on sale of self storage properties | (9,571) | (2,668) | (10,996) | (63,841) | |||||||||||||||||||
| Distributions to preferred shareholders and unitholders | (5,568) | (5,568) | (11,136) | (11,136) | |||||||||||||||||||
FFO attributable to subordinated performance units(1) | — | (10,891) | — | (21,622) | |||||||||||||||||||
FFO attributable to common shareholders, OP unitholders, and LTIP unitholders | 72,341 | 70,118 | 143,319 | 142,012 | |||||||||||||||||||
| Add (subtract): | |||||||||||||||||||||||
| Acquisition costs | 457 | 480 | 860 | 987 | |||||||||||||||||||
Integration and executive severance costs(2) | 1,583 | 626 | 3,625 | 626 | |||||||||||||||||||
Core FFO attributable to common shareholders, OP unitholders, and LTIP unitholders | $ | 74,381 | $ | 71,224 | $ | 147,804 | $ | 143,625 | |||||||||||||||
Weighted average shares and units outstanding - FFO and Core FFO:(3) | |||||||||||||||||||||||
| Weighted average shares outstanding - basic | 76,474 | 75,160 | 76,423 | 77,698 | |||||||||||||||||||
| Weighted average restricted common shares outstanding | 26 | 21 | 24 | 22 | |||||||||||||||||||
Weighted average OP units outstanding | 52,115 | 37,644 | 52,131 | 37,638 | |||||||||||||||||||
Weighted average DownREIT OP unit equivalents outstanding | 5,769 | 2,120 | 5,769 | 2,120 | |||||||||||||||||||
Weighted average LTIP units outstanding | 888 | 673 | 906 | 683 | |||||||||||||||||||
Total weighted average shares and units outstanding - FFO and Core FFO | 135,272 | 115,618 | 135,253 | 118,161 | |||||||||||||||||||
| FFO per share and unit | $ | 0.54 | $ | 0.61 | $ | 1.06 | $ | 1.20 | |||||||||||||||
| Core FFO per share and unit | $ | 0.55 | $ | 0.62 | $ | 1.09 | $ | 1.22 | |||||||||||||||
| (1) | Amounts represent distributions declared for subordinated performance unitholders and DownREIT subordinated performance unitholders for the periods presented. | |||||||||||||
| (2) | Executive severance costs relate to the three months ended June 30, 2024 and are recorded within the line items "General and administrative expenses" and "Non-operating income" in our consolidated statements of operations. Integration costs relate to expenses incurred as a part of the internalization of the PRO structure. | |||||||||||||
| (3) | NSA combines OP units and DownREIT OP units with common shares because, after the applicable lock-out periods, OP units in the Company's operating partnership are redeemable for cash or, at NSA's option, exchangeable for common shares on a one-for-one basis and DownREIT OP units are also redeemable for cash or, at NSA's option, exchangeable for OP units in the Company's operating partnership on a one-for-one basis, subject to certain adjustments in each case. LTIP units may also, under certain circumstances, be convertible into or exchangeable for common shares (or other units that are convertible into or exchangeable for common shares). All subordinated performance units and DownREIT subordinated performance units were converted into OP units on July 1, 2024, in connection with the internalization of the PRO structure. See footnote(4) for additional discussion of subordinated performance units, DownREIT subordinated performance units, and LTIP units in the calculation of FFO and Core FFO per share and unit. | |||||||||||||
| Supplemental Schedule 1 (continued) | |||||||||||||||||||||||
| Funds From Operations and Core Funds From Operations | |||||||||||||||||||||||
| (in thousands, except per share and unit amounts) (unaudited) | |||||||||||||||||||||||
| Reconciliation of Earnings Per Share - Diluted to FFO and Core FFO Per Share and Unit | |||||||||||||||||||||||
| Three Months Ended June 30, | Six Months Ended June 30, | ||||||||||||||||||||||
| 2025 | 2024 | 2025 | 2024 | ||||||||||||||||||||
| Earnings per share - diluted | $ | 0.19 | $ | 0.16 | $ | 0.29 | $ | 0.85 | |||||||||||||||
Impact of the difference in weighted average number of shares(4) | (0.08) | (0.06) | (0.12) | (0.29) | |||||||||||||||||||
Impact of GAAP accounting for noncontrolling interests, two-class method and treasury stock method(5) | 0.08 | 0.13 | 0.12 | 0.42 | |||||||||||||||||||
| Add real estate depreciation and amortization | 0.35 | 0.40 | 0.70 | 0.79 | |||||||||||||||||||
| Add equity in losses of unconsolidated real estate ventures | 0.03 | 0.04 | 0.07 | 0.05 | |||||||||||||||||||
| Add Company's share of FFO in unconsolidated real estate ventures | 0.04 | 0.05 | 0.08 | 0.10 | |||||||||||||||||||
| Subtract gain on sale of self storage properties | (0.07) | (0.02) | (0.08) | (0.54) | |||||||||||||||||||
| FFO attributable to subordinated performance unitholders | — | (0.09) | — | (0.18) | |||||||||||||||||||
FFO per share and unit | 0.54 | 0.61 | 1.06 | 1.20 | |||||||||||||||||||
Add acquisition costs | — | — | — | 0.01 | |||||||||||||||||||
| Add integration and executive severance costs | 0.01 | 0.01 | 0.03 | 0.01 | |||||||||||||||||||
Core FFO per share and unit | $ | 0.55 | $ | 0.62 | $ | 1.09 | $ | 1.22 | |||||||||||||||
| (4) | Adjustment accounts for the difference between the weighted average number of shares used to calculate diluted earnings per share and the weighted average number of shares used to calculate FFO and Core FFO per share and unit. Diluted earnings per share is calculated using the two-class method for the company's restricted common shares and the treasury stock method for certain unvested LTIP units, and assumes the conversion of vested LTIP units into OP units on a one-for-one basis and the hypothetical conversion of subordinated performance units and DownREIT subordinated performance units into OP units, even though such units may have only been convertible into OP units (i) after a lock-out period and (ii) upon certain events or conditions. All outstanding subordinated performance units and DownREIT subordinated performance units were converted into OP units on July 1, 2024, in connection with the internalization of the PRO structure. The computation of weighted average shares and units for FFO and Core FFO per share and unit includes all restricted common shares and LTIP units that participate in distributions and excludes all subordinated performance units and DownREIT subordinated performance units because their effect has been accounted for through the allocation of FFO to the related unitholders based on distributions declared. | |||||||||||||
| (5) | Represents the effect of adjusting the numerator to consolidated net income prior to GAAP allocations for noncontrolling interests, after deducting preferred share and unit distributions, and before the application of the two-class method and treasury stock method, as described in footnote(4). | |||||||||||||
| Supplemental Schedule 2 | |||||||||||||||||||||||
| Other Non-GAAP Financial Measurements | |||||||||||||||||||||||
| (dollars in thousands) (unaudited) | |||||||||||||||||||||||
| Net Operating Income | |||||||||||||||||||||||
| Three Months Ended June 30, | Six Months Ended June 30, | ||||||||||||||||||||||
| 2025 | 2024 | 2025 | 2024 | ||||||||||||||||||||
| Net income | $ | 30,958 | $ | 32,280 | $ | 50,477 | $ | 127,368 | |||||||||||||||
| (Subtract) add: | |||||||||||||||||||||||
| Management fees and other revenue | (12,230) | (9,522) | (24,365) | (18,596) | |||||||||||||||||||
| General and administrative expenses | 12,804 | 16,189 | 25,949 | 31,863 | |||||||||||||||||||
| Depreciation and amortization | 47,612 | 46,710 | 95,728 | 94,041 | |||||||||||||||||||
| Other | 4,500 | 3,375 | 8,976 | 6,867 | |||||||||||||||||||
| Interest expense | 41,269 | 37,228 | 81,744 | 75,345 | |||||||||||||||||||
| Equity in losses of unconsolidated real estate ventures | 3,945 | 4,449 | 9,684 | 6,079 | |||||||||||||||||||
| Acquisition and integration costs | 2,040 | 480 | 4,485 | 987 | |||||||||||||||||||
| Non-operating income | (462) | (337) | (822) | (435) | |||||||||||||||||||
| Gain on sale of self storage properties | (9,571) | (2,668) | (10,996) | (63,841) | |||||||||||||||||||
| Income tax expense | 120 | 541 | 1,240 | 1,427 | |||||||||||||||||||
Net Operating Income | $ | 120,985 | $ | 128,725 | $ | 242,100 | $ | 261,105 | |||||||||||||||
| EBITDA and Adjusted EBITDA | |||||||||||||||||||||||
| Three Months Ended June 30, | Six Months Ended June 30, | ||||||||||||||||||||||
| 2025 | 2024 | 2025 | 2024 | ||||||||||||||||||||
| Net income | $ | 30,958 | $ | 32,280 | $ | 50,477 | $ | 127,368 | |||||||||||||||
| Add: | |||||||||||||||||||||||
| Depreciation and amortization | 47,612 | 46,710 | 95,728 | 94,041 | |||||||||||||||||||
Company's share of unconsolidated real estate venture depreciation and amortization | 5,217 | 5,141 | 10,628 | 9,693 | |||||||||||||||||||
| Interest expense | 41,269 | 37,228 | 81,744 | 75,345 | |||||||||||||||||||
| Income tax expense | 120 | 541 | 1,240 | 1,427 | |||||||||||||||||||
EBITDA | 125,176 | 121,900 | 239,817 | 307,874 | |||||||||||||||||||
| Add (subtract): | |||||||||||||||||||||||
| Acquisition costs | 457 | 480 | 860 | 987 | |||||||||||||||||||
Effect of hypothetical liquidation at book value (HLBV) accounting for unconsolidated 2024 Joint Venture(1) | 4,167 | 5,485 | 9,548 | 8,249 | |||||||||||||||||||
| Gain on sale of self storage properties | (9,571) | (2,668) | (10,996) | (63,841) | |||||||||||||||||||
Integration and executive severance costs, excluding equity-based compensation(2) | 458 | 223 | 1,388 | 223 | |||||||||||||||||||
Equity-based compensation expense(3) | 3,138 | 2,331 | 6,217 | 4,186 | |||||||||||||||||||
Adjusted EBITDA | $ | 123,825 | $ | 127,751 | $ | 246,834 | $ | 257,678 | |||||||||||||||
| (1) | Reflects the non-cash impact of applying HLBV to the 2024 Joint Venture, which allocates GAAP income (loss) on a hypothetical liquidation of the underlying joint venture at book value as of the reporting date. | |||||||||||||
| (2) | Executive severance costs relate to the three months ended June 30, 2024 and are recorded within the line items "General and administrative expenses" and "Non-operating income" in our consolidated statements of operations. Integration costs relate to expenses incurred as a part of the internalization of the PRO structure. | |||||||||||||
| (3) | Equity-based compensation expense is a non-cash item recorded within general and administrative expenses and acquisition and integration costs in our consolidated statements of operations. For the three and six months ended June 30, 2025, $1.1 million and $2.2 million, respectively, relates to the internalization of the PRO structure and is included in acquisition and integration costs. | |||||||||||||
| Supplemental Schedule 3 | ||||||||||||||||||||||||||||||||||||||||||||||||||||||||
| Portfolio Summary | ||||||||||||||||||||||||||||||||||||||||||||||||||||||||
| As of June 30, 2025 | ||||||||||||||||||||||||||||||||||||||||||||||||||||||||
| (dollars in thousands) (unaudited) | ||||||||||||||||||||||||||||||||||||||||||||||||||||||||
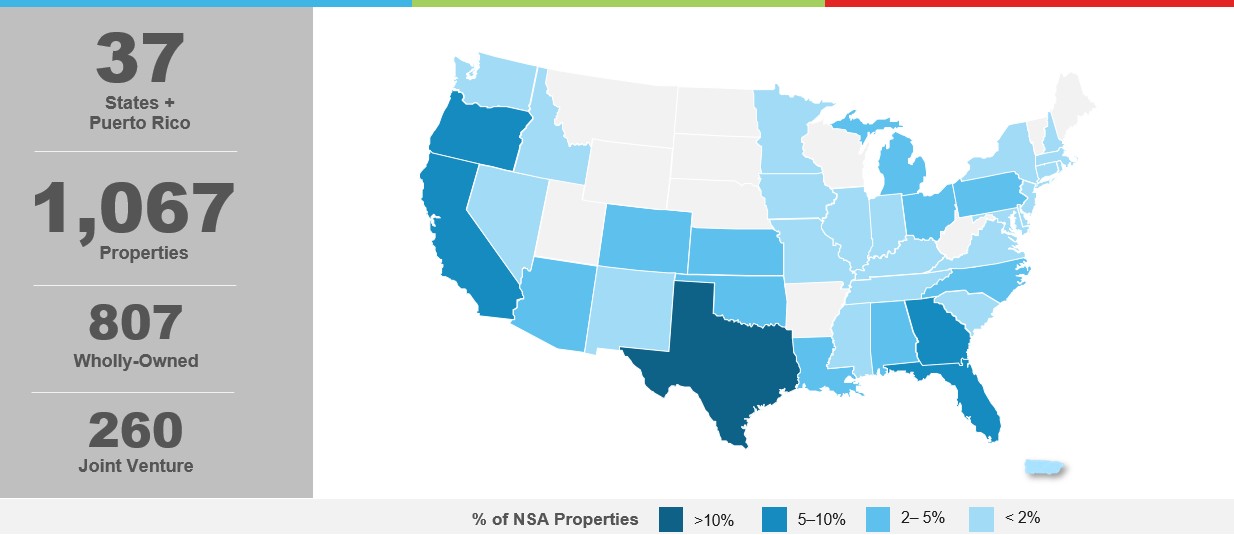
| Wholly-Owned Store Data by State (Consolidated) | Total Operated Store Data by State (Consolidated & Unconsolidated) | |||||||||||||||||||||||||||||||||||||||||||||||||||||||
| State/Territories | Stores | Units | Rentable Square Feet | Occupancy at Period End | State/Territories | Stores | Units | Rentable Square Feet | Occupancy at Period End | |||||||||||||||||||||||||||||||||||||||||||||||
| Texas | 176 | 80,985 | 11,290,212 | 85.0 | % | Texas | 203 | 98,078 | 13,401,230 | 85.0 | % | |||||||||||||||||||||||||||||||||||||||||||||
| California | 86 | 51,686 | 6,495,864 | 82.7 | % | Florida | 105 | 60,427 | 6,817,419 | 82.7 | % | |||||||||||||||||||||||||||||||||||||||||||||
| Florida | 78 | 45,393 | 5,100,869 | 81.6 | % | California | 98 | 58,333 | 7,275,198 | 82.9 | % | |||||||||||||||||||||||||||||||||||||||||||||
| Oregon | 70 | 29,265 | 3,662,029 | 89.9 | % | Georgia | 72 | 33,526 | 4,600,447 | 82.0 | % | |||||||||||||||||||||||||||||||||||||||||||||
| Georgia | 50 | 21,956 | 3,019,547 | 81.4 | % | Oregon | 70 | 29,265 | 3,662,029 | 89.9 | % | |||||||||||||||||||||||||||||||||||||||||||||
| North Carolina | 35 | 17,270 | 2,160,512 | 89.0 | % | Oklahoma | 52 | 22,402 | 3,269,435 | 80.4 | % | |||||||||||||||||||||||||||||||||||||||||||||
| Arizona | 34 | 18,881 | 2,174,935 | 79.2 | % | Arizona | 36 | 19,890 | 2,285,065 | 78.8 | % | |||||||||||||||||||||||||||||||||||||||||||||
| Oklahoma | 33 | 15,293 | 2,139,781 | 81.9 | % | North Carolina | 35 | 17,270 | 2,160,512 | 89.0 | % | |||||||||||||||||||||||||||||||||||||||||||||
| Louisiana | 25 | 11,455 | 1,388,685 | 79.8 | % | Ohio | 27 | 14,894 | 1,854,267 | 86.2 | % | |||||||||||||||||||||||||||||||||||||||||||||
| Pennsylvania | 22 | 10,441 | 1,296,020 | 86.5 | % | Michigan | 25 | 15,945 | 2,020,448 | 87.5 | % | |||||||||||||||||||||||||||||||||||||||||||||
| Colorado | 21 | 9,124 | 1,145,382 | 89.4 | % | Pennsylvania | 25 | 12,075 | 1,456,490 | 86.9 | % | |||||||||||||||||||||||||||||||||||||||||||||
| Washington | 19 | 6,643 | 871,889 | 87.9 | % | Alabama | 25 | 11,825 | 1,759,741 | 81.8 | % | |||||||||||||||||||||||||||||||||||||||||||||
| Puerto Rico | 15 | 12,853 | 1,379,297 | 89.1 | % | Louisiana | 25 | 11,455 | 1,388,685 | 79.8 | % | |||||||||||||||||||||||||||||||||||||||||||||
| Nevada | 15 | 7,564 | 963,287 | 89.2 | % | Kansas | 22 | 8,428 | 1,121,017 | 91.3 | % | |||||||||||||||||||||||||||||||||||||||||||||
| New Hampshire | 15 | 7,160 | 890,295 | 86.2 | % | Colorado | 21 | 9,124 | 1,145,382 | 89.4 | % | |||||||||||||||||||||||||||||||||||||||||||||
| Kansas | 15 | 5,577 | 721,918 | 90.5 | % | New Jersey | 20 | 13,512 | 1,603,307 | 86.2 | % | |||||||||||||||||||||||||||||||||||||||||||||
| Indiana | 12 | 6,530 | 827,524 | 81.4 | % | Tennessee | 20 | 10,243 | 1,309,829 | 88.5 | % | |||||||||||||||||||||||||||||||||||||||||||||
| New Mexico | 12 | 5,775 | 750,298 | 81.1 | % | Indiana | 19 | 9,821 | 1,286,329 | 82.6 | % | |||||||||||||||||||||||||||||||||||||||||||||
| Alabama | 11 | 6,034 | 909,280 | 78.2 | % | Nevada | 19 | 9,449 | 1,247,605 | 87.1 | % | |||||||||||||||||||||||||||||||||||||||||||||
Other(1) | 63 | 35,984 | 4,426,653 | 86.1 | % | Washington | 19 | 6,643 | 871,889 | 87.9 | % | |||||||||||||||||||||||||||||||||||||||||||||
Total | 807 | 405,869 | 51,614,277 | 84.5 | % | Puerto Rico | 15 | 12,853 | 1,379,297 | 89.1 | % | |||||||||||||||||||||||||||||||||||||||||||||
| Massachusetts | 15 | 11,058 | 1,209,811 | 86.7 | % | |||||||||||||||||||||||||||||||||||||||||||||||||||
| New Hampshire | 15 | 7,160 | 890,295 | 86.2 | % | |||||||||||||||||||||||||||||||||||||||||||||||||||
| New Mexico | 12 | 5,775 | 750,298 | 81.1 | % | |||||||||||||||||||||||||||||||||||||||||||||||||||
| Minnesota | 11 | 5,558 | 708,445 | 88.5 | % | |||||||||||||||||||||||||||||||||||||||||||||||||||
| Illinois | 10 | 6,766 | 727,418 | 85.8 | % | |||||||||||||||||||||||||||||||||||||||||||||||||||
Other(2) | 51 | 28,071 | 3,471,293 | 86.4 | % | |||||||||||||||||||||||||||||||||||||||||||||||||||
| Total | 1,067 | 549,846 | 69,673,181 | 84.8 | % | |||||||||||||||||||||||||||||||||||||||||||||||||||
| (1) | Other states in NSA's owned portfolio as of June 30, 2025 include Connecticut, Idaho, Illinois, Iowa, Kentucky, Maryland, Massachusetts, Minnesota, Missouri, New Jersey, New York, Ohio, South Carolina, Tennessee and Virginia. | |||||||||||||
| (2) | Other states in NSA's operated portfolio as of June 30, 2025 include Connecticut, Delaware, Idaho, Iowa, Kentucky, Maryland, Mississippi, Missouri, New York, Rhode Island, South Carolina and Virginia. | |||||||||||||
| Supplemental Schedule 3 (continued) | ||||||||||||||||||||||||||||||||||||||||||||
| Portfolio Summary | ||||||||||||||||||||||||||||||||||||||||||||
| (dollars in thousands) (unaudited) | ||||||||||||||||||||||||||||||||||||||||||||
2025 Acquisition Activity | ||||||||||||||||||||||||||||||||||||||||||||
| Self Storage Properties Acquired During the Quarter Ended: | Summary of Investment | |||||||||||||||||||||||||||||||||||||||||||
| Stores | Units | Rentable Square Feet | Cash and Acquisition Costs | Value of Equity | Other | Total | ||||||||||||||||||||||||||||||||||||||
| March 31, 2025 | 3 | 1,031 | 107,041 | $ | 12,434 | $ | — | $ | 1,060 | $ | 13,494 | |||||||||||||||||||||||||||||||||
| June 30, 2025 | 1 | 718 | 86,906 | 11,328 | — | 48 | 11,376 | |||||||||||||||||||||||||||||||||||||
Unconsolidated Real Estate Ventures (at 100%)(3) | ||||||||||||||||||||||||||||||||||||||||||||
| March 31, 2025 | — | — | — | — | — | — | — | |||||||||||||||||||||||||||||||||||||
| June 30, 2025 | 1 | 623 | 54,750 | 17,963 | — | 50 | 18,013 | |||||||||||||||||||||||||||||||||||||
Total Investments(4) | 5 | 2,372 | 248,697 | $ | 41,725 | $ | — | $ | 1,158 | $ | 42,883 | |||||||||||||||||||||||||||||||||
2025 Disposition & Divestiture Activity | ||||||||||||||||||||||||||
Dispositions Closed During the Quarter Ended:(5) | Stores | Units | Rentable Square Feet | Net Proceeds | ||||||||||||||||||||||
| Self Storage Properties sold to 3rd Parties | ||||||||||||||||||||||||||
| March 31, 2025 | 2 | 394 | 82,270 | $ | 9,752 | |||||||||||||||||||||
| June 30, 2025 | 8 | 3,817 | 580,002 | 57,350 | ||||||||||||||||||||||
| Total Dispositions and Divestitures | 10 | 4,211 | 662,272 | $ | 67,102 | |||||||||||||||||||||
| (3) | Values represent entire unconsolidated real estate ventures at 100%, not NSA's proportionate share. NSA's ownership in each of the unconsolidated real estate ventures is 25%. | |||||||||||||
| (4) | NSA through its unconsolidated real estate ventures and wholly-owned portfolio acquired self storage properties located in Kansas (1), New Mexico (2), New York (1) and Texas (1). | |||||||||||||
| (5) | NSA disposed of self storage properties located in Arkansas (5), Colorado (1), Florida (1), Montana (1), Utah (1) and Wyoming (1). | |||||||||||||
| Supplemental Schedule 4 | |||||||||||||||||||||||||||||||||||||||||||||||||||||||||||||||||||||||
| Debt and Equity Capitalization | BBB Rated | ||||||||||||||||||||||||||||||||||||||||||||||||||||||||||||||||||||||
| As of June 30, 2025 | (with Stable Outlook) | ||||||||||||||||||||||||||||||||||||||||||||||||||||||||||||||||||||||
| (unaudited) | by Kroll Bond Rating Agency | ||||||||||||||||||||||||||||||||||||||||||||||||||||||||||||||||||||||
Debt Summary (dollars in thousands) | |||||||||||||||||||||||||||||||||||||||||||||||||||||||||||||||||||||||
Effective Interest Rate(1) | Basis of Rate | Maturity Date | 2025 | 2026 | 2027 | 2028 | 2029 | 2030 | 2031 | Thereafter | Total | ||||||||||||||||||||||||||||||||||||||||||||||||||||||||||||
| Credit Facility: | |||||||||||||||||||||||||||||||||||||||||||||||||||||||||||||||||||||||
Revolving line of credit(2) | 5.84% | Variable(3) | January 2027 | $ | — | $ | — | $ | 398,900 | $ | — | $ | — | $ | — | $ | — | $ | — | $ | 398,900 | ||||||||||||||||||||||||||||||||||||||||||||||||||
| Term loan - Tranche D | 4.11% | Swapped To Fixed | July 2026 | — | 275,000 | — | — | — | — | — | — | 275,000 | |||||||||||||||||||||||||||||||||||||||||||||||||||||||||||
| Term loan - Tranche E | 5.04% | Swapped To Fixed(3) | March 2027 | — | — | 130,000 | — | — | — | — | — | 130,000 | |||||||||||||||||||||||||||||||||||||||||||||||||||||||||||
| Term loan facility - 2028 | 4.17% | Swapped To Fixed | December 2028 | — | — | — | 75,000 | — | — | — | — | 75,000 | |||||||||||||||||||||||||||||||||||||||||||||||||||||||||||
| Term loan facility - April 2029 | 3.77% | Swapped To Fixed | April 2029 | — | — | — | — | 100,000 | — | — | — | 100,000 | |||||||||||||||||||||||||||||||||||||||||||||||||||||||||||
| Term loan facility - June 2029 | 5.07% | Swapped To Fixed | June 2029 | — | — | — | — | 285,000 | — | — | — | 285,000 | |||||||||||||||||||||||||||||||||||||||||||||||||||||||||||
| May 2026 Senior Unsecured Notes | 2.16% | Fixed | May 2026 | — | 35,000 | — | — | — | — | — | — | 35,000 | |||||||||||||||||||||||||||||||||||||||||||||||||||||||||||
| October 2026 Senior Unsecured Notes | 6.46% | Fixed | October 2026 | — | 65,000 | — | — | — | — | — | — | 65,000 | |||||||||||||||||||||||||||||||||||||||||||||||||||||||||||
| July 2028 Senior Unsecured Notes | 5.75% | Fixed | July 2028 | — | — | — | 120,000 | — | — | — | — | 120,000 | |||||||||||||||||||||||||||||||||||||||||||||||||||||||||||
| September 2028 Senior Unsecured Notes | 5.40% | Fixed | September 2028 | — | — | — | 75,000 | — | — | — | — | 75,000 | |||||||||||||||||||||||||||||||||||||||||||||||||||||||||||
| October 2028 Senior Unsecured Notes | 6.55% | Fixed | October 2028 | — | — | — | 100,000 | — | — | — | — | 100,000 | |||||||||||||||||||||||||||||||||||||||||||||||||||||||||||
| 2029 Senior Unsecured Notes | 3.98% | Fixed | August 2029 | — | — | — | — | 100,000 | — | — | — | 100,000 | |||||||||||||||||||||||||||||||||||||||||||||||||||||||||||
| August 2030 Senior Unsecured Notes | 2.99% | Fixed | August 2030 | — | — | — | — | — | 150,000 | — | — | 150,000 | |||||||||||||||||||||||||||||||||||||||||||||||||||||||||||
| October 2030 Senior Unsecured Notes | 6.66% | Fixed | October 2030 | — | — | — | — | — | 35,000 | — | — | 35,000 | |||||||||||||||||||||||||||||||||||||||||||||||||||||||||||
| November 2030 Senior Unsecured Notes | 2.72% | Fixed | November 2030 | — | — | — | — | — | 75,000 | — | — | 75,000 | |||||||||||||||||||||||||||||||||||||||||||||||||||||||||||
| May 2031 Senior Unsecured Notes | 3.00% | Fixed | May 2031 | — | — | — | — | — | — | 90,000 | — | 90,000 | |||||||||||||||||||||||||||||||||||||||||||||||||||||||||||
| August 2031 Senior Unsecured Notes | 4.08% | Fixed | August 2031 | — | — | — | — | — | — | 50,000 | — | 50,000 | |||||||||||||||||||||||||||||||||||||||||||||||||||||||||||
| September 2031 Senior Unsecured Notes | 5.55% | Fixed | September 2031 | — | — | — | — | — | — | 125,000 | — | 125,000 | |||||||||||||||||||||||||||||||||||||||||||||||||||||||||||
| November 2031 Senior Unsecured Notes | 2.81% | Fixed | November 2031 | — | — | — | — | — | — | 175,000 | — | 175,000 | |||||||||||||||||||||||||||||||||||||||||||||||||||||||||||
| August 2032 Senior Unsecured Notes | 3.09% | Fixed | August 2032 | — | — | — | — | — | — | — | 100,000 | 100,000 | |||||||||||||||||||||||||||||||||||||||||||||||||||||||||||
| November 2032 Senior Unsecured Notes | 5.06% | Fixed | November 2032 | — | — | — | — | — | — | — | 200,000 | 200,000 | |||||||||||||||||||||||||||||||||||||||||||||||||||||||||||
| May 2033 Senior Unsecured Notes | 3.10% | Fixed | May 2033 | — | — | — | — | — | — | — | 55,000 | 55,000 | |||||||||||||||||||||||||||||||||||||||||||||||||||||||||||
| October 2033 Senior Unsecured Notes | 6.73% | Fixed | October 2033 | — | — | — | — | — | — | — | 50,000 | 50,000 | |||||||||||||||||||||||||||||||||||||||||||||||||||||||||||
| November 2033 Senior Unsecured Notes | 2.96% | Fixed | November 2033 | — | — | — | — | — | — | — | 125,000 | 125,000 | |||||||||||||||||||||||||||||||||||||||||||||||||||||||||||
| 2034 Senior Unsecured Notes | 5.74% | Fixed | September 2034 | — | — | — | — | — | — | — | 150,000 | 150,000 | |||||||||||||||||||||||||||||||||||||||||||||||||||||||||||
| 2036 Senior Unsecured Notes | 3.06% | Fixed | November 2036 | — | — | — | — | — | — | — | 75,000 | 75,000 | |||||||||||||||||||||||||||||||||||||||||||||||||||||||||||
| Fixed rate mortgages payable | 3.54% | Fixed | August 2027 - October 2031 | — | — | 84,900 | 88,000 | — | — | 26,818 | — | 199,718 | |||||||||||||||||||||||||||||||||||||||||||||||||||||||||||
Total Principal/Weighted Average | 4.52% | 4.5 years | $ | — | $ | 375,000 | $ | 613,800 | $ | 458,000 | $ | 485,000 | $ | 260,000 | $ | 466,818 | $ | 755,000 | $ | 3,413,618 | |||||||||||||||||||||||||||||||||||||||||||||||||||
| Weighted average effective interest rate of maturing debt | —% | 4.33% | 5.44% | 5.04% | 4.58% | 3.41% | 3.80% | 4.36% | |||||||||||||||||||||||||||||||||||||||||||||||||||||||||||||||
Unamortized debt issuance costs and debt premium, net | (10,959) | ||||||||||||||||||||||||||||||||||||||||||||||||||||||||||||||||||||||
Total Debt | $ | 3,402,659 | |||||||||||||||||||||||||||||||||||||||||||||||||||||||||||||||||||||
| (1) | Effective interest rate incorporates the stated rate plus the impact of interest rate cash flow hedges and discount and premium amortization, if applicable. | |||||||||||||
| (2) | NSA may, at its election, extend the maturity date of the revolving line of credit to January 2028, subject to meeting customary conditions and payment of an extension fee. | |||||||||||||
| (3) | For the $950 million revolving line of credit, the effective interest rate is calculated based on Daily Simple SOFR plus an applicable margin of 1.45% and a SOFR Index Adjustment of 0.10%, and excludes fees which range from 0.15% to 0.20% for unused borrowings. $125.0 million of the Tranche E term loan is subject to interest rate swaps, the maturity of which extends through the Tranche E maturity. | |||||||||||||
| Supplemental Schedule 4 (continued) | |||||||||||||||||
| Debt and Equity Capitalization | |||||||||||||||||
| As of June 30, 2025 | |||||||||||||||||
| (unaudited) | |||||||||||||||||
| Debt Ratios | |||||||||||||||||
Covenant | Amount | ||||||||||||||||
| Net Debt to Annualized Current Quarter Adjusted EBITDA | n/a | 6.8x | |||||||||||||||
Trailing Twelve Month Fixed Charge Coverage Ratio | > 1.5x | 2.6x | |||||||||||||||
| Total Leverage Ratio | < 60.0% | 45.8% | |||||||||||||||
| Preferred Shares and Units | |||||
| Outstanding | |||||
| 6.000% Series A cumulative redeemable preferred shares of beneficial interest | 9,029,717 | ||||
| 6.000% Series B cumulative redeemable preferred shares of beneficial interest | 4,608,445 | ||||
Preferred shares of beneficial interest(4) | 13,638,162 | ||||
| 6.000% Series A-1 cumulative redeemable preferred units | 1,200,211 | ||||
| Common Shares and Units | |||||
| Outstanding | |||||
| Common shares of beneficial interest | 76,533,806 | ||||
| Restricted common shares | 24,934 | ||||
Total shares outstanding | 76,558,740 | ||||
| Operating partnership units | 52,111,896 | ||||
DownREIT operating partnership unit equivalents | 5,769,214 | ||||
Total operating partnership units | 57,881,110 | ||||
| Long-term incentive plan units | 850,663 | ||||
Total common shares and units outstanding | 135,290,513 | ||||
| (4) | The Company's balance sheet at June 30, 2025 reflects 14,697,845 preferred shares of beneficial interest, which includes 5,668,128 Series B Preferred Shares issued and outstanding. We have reflected 13,638,162 preferred shares herein, which corresponds to the $341.0 million liquidation preference reflected on the balance sheet at June 30, 2025. As part of a 2023 property acquisition of 15 properties from one of the Company's former participating regional operators (the "Contributor"), the Company recorded a $26.1 million promissory note receivable from the Contributor, and the Contributor used the loan proceeds to acquire $26.1 million of OP equity. The promissory note bears interest at a rate equivalent to the dividends paid on 1,059,683 Series B Preferred Shares. As a result of these agreements, in accordance with GAAP, the $26.1 million promissory note receivable, interest income on the promissory note receivable, $26.1 million of Series B Preferred Shares value, and dividends on such Series B Preferred Shares have been offset for presentation purposes in the accompanying consolidated balance sheets and consolidated statements of operations. | |||||||||||||
| Supplemental Schedule 5 | ||||||||||||||||||||||||||||||||||||||||||||||||||
| Summarized Information for Unconsolidated Real Estate Ventures | ||||||||||||||||||||||||||||||||||||||||||||||||||
| (dollars in thousands) (unaudited) | ||||||||||||||||||||||||||||||||||||||||||||||||||
Real Estate Venture Balance Sheet Data as of June 30, 2025 | ||||||||||||||||||||||||||||||||||||||||||||||||||
Number of Stores at June 30, | Occupancy at Period End | |||||||||||||||||||||||||||||||||||||||||||||||||
| Real Estate Ventures | Carrying Value of NSA's Investment(1) | Gross Book Value of Real Estate Assets | Outstanding Debt | 2025 | 2024 | Total Rentable Square Feet | 2Q 2025 | 2Q 2024 | ||||||||||||||||||||||||||||||||||||||||||
| 2016 Joint Venture | $ | 96,997 | $ | 929,646 | $ | 358,370 | 81 | 81 | 5,690,420 | 86.1 | % | 88.4 | % | |||||||||||||||||||||||||||||||||||||
| 2018 Joint Venture | 92,113 | 1,284,209 | 646,238 | 104 | 104 | 7,857,967 | 86.6 | % | 88.8 | % | ||||||||||||||||||||||||||||||||||||||||
| 2023 Joint Venture | 40,959 | 165,329 | — | 19 | — | 1,290,309 | 75.4 | % | — | |||||||||||||||||||||||||||||||||||||||||
| 2024 Joint Venture | 1,291 | 343,722 | 209,140 | 56 | 56 | 3,220,208 | 86.3 | % | 88.0 | % | ||||||||||||||||||||||||||||||||||||||||
| Total | $ | 231,360 | $ | 2,722,906 | $ | 1,213,748 | 260 | 241 | 18,058,904 | 85.6 | % | 88.5 | % | |||||||||||||||||||||||||||||||||||||
Combined Operating Information(2) | ||||||||||||||||||||||||||||||||||||||||||||||||||||||||||||||
Three Months Ended June 30, 2025 | Six Months Ended June 30, 2025 | |||||||||||||||||||||||||||||||||||||||||||||||||||||||||||||
| 2016 Joint Venture | 2018 Joint Venture | 2023 Joint Venture | 2024 Joint Venture | Total | 2016 Joint Venture | 2018 Joint Venture | 2023 Joint Venture | 2024 Joint Venture | Total | |||||||||||||||||||||||||||||||||||||||||||||||||||||
| Total revenue | $ | 22,323 | $ | 27,686 | $ | 2,469 | $ | 9,192 | $ | 61,670 | $ | 44,646 | $ | 55,314 | $ | 4,921 | $ | 18,413 | $ | 123,294 | ||||||||||||||||||||||||||||||||||||||||||
| Property operating expenses | 7,699 | 8,981 | 1,079 | 3,650 | 21,409 | 15,325 | 18,367 | 2,203 | 7,930 | 43,825 | ||||||||||||||||||||||||||||||||||||||||||||||||||||
| Net operating income | 14,624 | 18,705 | 1,390 | 5,542 | 40,261 | 29,321 | 36,947 | 2,718 | 10,483 | 79,469 | ||||||||||||||||||||||||||||||||||||||||||||||||||||
Supervisory, administrative and other expenses | (1,610) | (1,720) | (173) | (484) | (3,987) | (3,232) | (3,424) | (407) | (965) | (8,028) | ||||||||||||||||||||||||||||||||||||||||||||||||||||
| Depreciation and amortization | (5,608) | (10,221) | (1,982) | (3,058) | (20,869) | (11,211) | (20,421) | (3,906) | (6,975) | (42,513) | ||||||||||||||||||||||||||||||||||||||||||||||||||||
| Interest expense | (3,308) | (7,192) | — | (3,235) | (13,735) | (6,575) | (14,336) | — | (6,469) | (27,380) | ||||||||||||||||||||||||||||||||||||||||||||||||||||
| Non-operating income | 86 | 309 | 22 | 224 | 641 | 44 | 209 | 14 | 224 | 491 | ||||||||||||||||||||||||||||||||||||||||||||||||||||
| Net income (loss) | $ | 4,184 | $ | (119) | $ | (743) | $ | (1,011) | $ | 2,311 | $ | 8,347 | $ | (1,025) | $ | (1,581) | $ | (3,702) | $ | 2,039 | ||||||||||||||||||||||||||||||||||||||||||
| Add (subtract): | ||||||||||||||||||||||||||||||||||||||||||||||||||||||||||||||
Unconsolidated real estate venture depreciation and amortization | 5,608 | 10,221 | 1,982 | 3,058 | 20,869 | 11,211 | 20,421 | 3,906 | 6,975 | 42,513 | ||||||||||||||||||||||||||||||||||||||||||||||||||||
FFO and Core FFO for unconsolidated real estate ventures | $ | 9,792 | $ | 10,102 | $ | 1,239 | $ | 2,047 | $ | 23,180 | $ | 19,558 | $ | 19,396 | $ | 2,325 | $ | 3,273 | $ | 44,552 | ||||||||||||||||||||||||||||||||||||||||||
| (1) | NSA's investment in its unconsolidated real estate ventures are recorded under the equity method of accounting. Under the equity method, NSA’s investments in unconsolidated real estate ventures are stated at cost and adjusted for NSA’s share of net earnings or losses and reduced by distributions. | |||||||||||||
| (2) | Values represent entire unconsolidated real estate ventures at 100%, not NSA's proportionate share. NSA's ownership in each of the unconsolidated real estate ventures is 25%. The operating agreements of the unconsolidated real estate ventures provide for the distribution of net cash flow to the unconsolidated real estate ventures' investors no less than monthly, generally in proportion to the investors’ respective ownership interests, subject to a promoted distribution to NSA upon the achievement of certain performance benchmarks by the non-NSA investor. | |||||||||||||
| Supplemental Schedule 6 | |||||||||||||||||||||||||||||||||||||||||||||||||||||||||||||||||||||||||||||
Same Store Performance Summary By MSA(1) | |||||||||||||||||||||||||||||||||||||||||||||||||||||||||||||||||||||||||||||
| (dollars in thousands, except per square foot data) (unaudited) | |||||||||||||||||||||||||||||||||||||||||||||||||||||||||||||||||||||||||||||
| Three Months Ended June 30, 2025 compared to Three Months Ended June 30, 2024 | |||||||||||||||||||||||||||||||||||||||||||||||||||||||||||||||||||||||||||||
| Total Revenue | Property Operating Expenses | Net Operating Income | Net Operating Income Margin | ||||||||||||||||||||||||||||||||||||||||||||||||||||||||||||||||||||||||||
MSA(1) | Stores | 2Q 2025 | 2Q 2024 | Change | 2Q 2025 | 2Q 2024 | Change | 2Q 2025 | 2Q 2024 | Change | 2Q 2025 | 2Q 2024 | Change | ||||||||||||||||||||||||||||||||||||||||||||||||||||||||||||||||
| Portland-Vancouver-Hillsboro, OR-WA | 54 | $ | 11,502 | $ | 11,322 | 1.6 | % | $ | 3,325 | $ | 3,019 | 10.1 | % | $ | 8,177 | $ | 8,303 | (1.5) | % | 71.1 | % | 73.3 | % | (2.2) | % | ||||||||||||||||||||||||||||||||||||||||||||||||||||
| Riverside-San Bernardino-Ontario, CA | 49 | 13,046 | 13,767 | (5.2) | % | 3,162 | 3,218 | (1.7) | % | 9,884 | 10,549 | (6.3) | % | 75.8 | % | 76.6 | % | (0.8) | % | ||||||||||||||||||||||||||||||||||||||||||||||||||||||||||
| Houston-Pasadena-The Woodlands, TX | 37 | 8,257 | 8,159 | 1.2 | % | 2,822 | 2,937 | (3.9) | % | 5,435 | 5,222 | 4.1 | % | 65.8 | % | 64.0 | % | 1.8 | % | ||||||||||||||||||||||||||||||||||||||||||||||||||||||||||
| Atlanta-Sandy Springs-Roswell, GA | 30 | 5,425 | 5,933 | (8.6) | % | 1,853 | 1,659 | 11.7 | % | 3,572 | 4,274 | (16.4) | % | 65.8 | % | 72.0 | % | (6.2) | % | ||||||||||||||||||||||||||||||||||||||||||||||||||||||||||
| Dallas-Fort Worth-Arlington, TX | 28 | 4,867 | 5,153 | (5.6) | % | 1,972 | 1,986 | (0.7) | % | 2,895 | 3,167 | (8.6) | % | 59.5 | % | 61.5 | % | (2.0) | % | ||||||||||||||||||||||||||||||||||||||||||||||||||||||||||
| Phoenix-Mesa-Chandler, AZ | 26 | 5,547 | 6,051 | (8.3) | % | 1,595 | 1,623 | (1.7) | % | 3,952 | 4,428 | (10.7) | % | 71.2 | % | 73.2 | % | (2.0) | % | ||||||||||||||||||||||||||||||||||||||||||||||||||||||||||
| McAllen-Edinburg-Mission, TX | 21 | 4,501 | 4,643 | (3.1) | % | 1,296 | 1,282 | 1.1 | % | 3,205 | 3,361 | (4.6) | % | 71.2 | % | 72.4 | % | (1.2) | % | ||||||||||||||||||||||||||||||||||||||||||||||||||||||||||
| Oklahoma City, OK | 20 | 3,258 | 3,301 | (1.3) | % | 1,055 | 958 | 10.1 | % | 2,203 | 2,343 | (6.0) | % | 67.6 | % | 71.0 | % | (3.4) | % | ||||||||||||||||||||||||||||||||||||||||||||||||||||||||||
| Brownsville-Harlingen, TX | 16 | 2,852 | 2,876 | (0.8) | % | 863 | 786 | 9.8 | % | 1,989 | 2,090 | (4.8) | % | 69.7 | % | 72.7 | % | (3.0) | % | ||||||||||||||||||||||||||||||||||||||||||||||||||||||||||
| San Antonio-New Braunfels, TX | 15 | 2,662 | 2,796 | (4.8) | % | 1,108 | 815 | 36.0 | % | 1,554 | 1,981 | (21.6) | % | 58.4 | % | 70.9 | % | (12.5) | % | ||||||||||||||||||||||||||||||||||||||||||||||||||||||||||
| North Port-Bradenton-Sarasota, FL | 15 | 4,180 | 4,433 | (5.7) | % | 1,364 | 1,451 | (6.0) | % | 2,816 | 2,982 | (5.6) | % | 67.4 | % | 67.3 | % | 0.1 | % | ||||||||||||||||||||||||||||||||||||||||||||||||||||||||||
| San Juan-Bayamón-Caguas, PR | 15 | 9,673 | 9,510 | 1.7 | % | 1,840 | 1,848 | (0.4) | % | 7,833 | 7,662 | 2.2 | % | 81.0 | % | 80.6 | % | 0.4 | % | ||||||||||||||||||||||||||||||||||||||||||||||||||||||||||
| Los Angeles-Long Beach-Anaheim, CA | 14 | 5,750 | 6,039 | (4.8) | % | 1,547 | 1,539 | 0.5 | % | 4,203 | 4,500 | (6.6) | % | 73.1 | % | 74.5 | % | (1.4) | % | ||||||||||||||||||||||||||||||||||||||||||||||||||||||||||
| Colorado Springs, CO | 14 | 2,095 | 2,160 | (3.0) | % | 769 | 657 | 17.0 | % | 1,326 | 1,503 | (11.8) | % | 63.3 | % | 69.6 | % | (6.3) | % | ||||||||||||||||||||||||||||||||||||||||||||||||||||||||||
| Orlando-Kissimmee-Sanford, FL | 14 | 3,145 | 3,456 | (9.0) | % | 1,024 | 1,105 | (7.3) | % | 2,121 | 2,351 | (9.8) | % | 67.4 | % | 68.0 | % | (0.6) | % | ||||||||||||||||||||||||||||||||||||||||||||||||||||||||||
| Tulsa, OK | 13 | 1,974 | 2,074 | (4.8) | % | 636 | 590 | 7.8 | % | 1,338 | 1,484 | (9.8) | % | 67.8 | % | 71.6 | % | (3.8) | % | ||||||||||||||||||||||||||||||||||||||||||||||||||||||||||
| Las Vegas-Henderson-North Las Vegas, NV | 13 | 2,875 | 2,958 | (2.8) | % | 761 | 765 | (0.5) | % | 2,114 | 2,193 | (3.6) | % | 73.5 | % | 74.1 | % | (0.6) | % | ||||||||||||||||||||||||||||||||||||||||||||||||||||||||||
| Shreveport-Bossier City, LA | 12 | 1,509 | 1,570 | (3.9) | % | 611 | 535 | 14.2 | % | 898 | 1,035 | (13.2) | % | 59.5 | % | 65.9 | % | (6.4) | % | ||||||||||||||||||||||||||||||||||||||||||||||||||||||||||
| Austin-Round Rock-San Marcos, TX | 12 | 3,213 | 3,348 | (4.0) | % | 1,051 | 1,108 | (5.1) | % | 2,162 | 2,240 | (3.5) | % | 67.3 | % | 66.9 | % | 0.4 | % | ||||||||||||||||||||||||||||||||||||||||||||||||||||||||||
| Wichita, KS | 12 | 1,793 | 1,757 | 2.0 | % | 760 | 598 | 27.1 | % | 1,033 | 1,159 | (10.9) | % | 57.6 | % | 66.0 | % | (8.4) | % | ||||||||||||||||||||||||||||||||||||||||||||||||||||||||||
| Bend, OR | 10 | 2,008 | 2,060 | (2.5) | % | 517 | 425 | 21.6 | % | 1,491 | 1,635 | (8.8) | % | 74.3 | % | 79.4 | % | (5.1) | % | ||||||||||||||||||||||||||||||||||||||||||||||||||||||||||
| Other MSAs | 331 | 68,843 | 70,818 | (2.8) | % | 22,789 | 21,503 | 6.0 | % | 46,054 | 49,315 | (6.6) | % | 66.9 | % | 69.6 | % | (2.7) | % | ||||||||||||||||||||||||||||||||||||||||||||||||||||||||||
| Total/Weighted Average | 771 | $ | 168,975 | $ | 174,184 | (3.0) | % | $ | 52,720 | $ | 50,407 | 4.6 | % | $ | 116,255 | $ | 123,777 | (6.1) | % | 68.8 | % | 71.1 | % | (2.3) | % | ||||||||||||||||||||||||||||||||||||||||||||||||||||
2024 Same Store Pool(2) | 744 | $ | 163,397 | $ | 168,528 | (3.0) | % | $ | 50,809 | $ | 48,436 | 4.9 | % | $ | 112,588 | $ | 120,092 | (6.2) | % | 68.9 | % | 71.3 | % | (2.4) | % | ||||||||||||||||||||||||||||||||||||||||||||||||||||
2023 Same Store Pool(3) | 695 | $ | 152,715 | $ | 157,595 | (3.1) | % | $ | 47,080 | $ | 44,919 | 4.8 | % | $ | 105,635 | $ | 112,676 | (6.2) | % | 69.2 | % | 71.5 | % | (2.3) | % | ||||||||||||||||||||||||||||||||||||||||||||||||||||
| (1) | MSA (Metropolitan Statistical Area) as defined by the United States Census Bureau. | |||||||||||||
| (2) | Represents the subset of properties included in the 2025 same store pool that were in NSA's same store pool reported in 2024. | |||||||||||||
| (3) | Represents the subset of properties included in the 2025 same store pool that were in NSA's same store pool reported in 2023. | |||||||||||||
| Supplemental Schedule 6 (continued) | ||||||||||||||||||||||||||||||||||||||||||||||||||||||||||||||
Same Store Performance Summary By MSA(1) | ||||||||||||||||||||||||||||||||||||||||||||||||||||||||||||||
| (dollars in thousands, except per square foot data) (unaudited) | ||||||||||||||||||||||||||||||||||||||||||||||||||||||||||||||
| Three Months Ended June 30, 2025 compared to Three Months Ended June 30, 2024 | ||||||||||||||||||||||||||||||||||||||||||||||||||||||||||||||
| Rentable Square Feet | Occupancy at Period End | Average Occupancy | Average Annualized Rental Revenue per Occupied Square Foot | |||||||||||||||||||||||||||||||||||||||||||||||||||||||||||
MSA(1) | Units | 2Q 2025 | 2Q 2024 | Change | 2Q 2025 | 2Q 2024 | Change | 2Q 2025 | 2Q 2024 | Change | ||||||||||||||||||||||||||||||||||||||||||||||||||||
| Portland-Vancouver-Hillsboro, OR-WA | 22,069 | 2,677,879 | 89.8 | % | 90.0 | % | (0.2) | % | 88.8 | % | 88.8 | % | — | % | $ | 18.74 | $ | 18.42 | 1.7 | % | ||||||||||||||||||||||||||||||||||||||||||
| Riverside-San Bernardino-Ontario, CA | 27,155 | 3,688,295 | 83.9 | % | 87.3 | % | (3.4) | % | 84.0 | % | 87.0 | % | (3.0) | % | 16.24 | 16.36 | (0.7) | % | ||||||||||||||||||||||||||||||||||||||||||||
| Houston-Pasadena-The Woodlands, TX | 18,419 | 2,762,856 | 86.5 | % | 90.5 | % | (4.0) | % | 85.5 | % | 89.5 | % | (4.0) | % | 13.37 | 12.61 | 6.0 | % | ||||||||||||||||||||||||||||||||||||||||||||
| Atlanta-Sandy Springs-Roswell, GA | 14,217 | 1,989,409 | 81.5 | % | 83.8 | % | (2.3) | % | 80.3 | % | 82.4 | % | (2.1) | % | 13.04 | 13.93 | (6.4) | % | ||||||||||||||||||||||||||||||||||||||||||||
| Dallas-Fort Worth-Arlington, TX | 12,845 | 1,672,350 | 81.0 | % | 84.6 | % | (3.6) | % | 80.1 | % | 84.4 | % | (4.3) | % | 13.97 | 14.13 | (1.1) | % | ||||||||||||||||||||||||||||||||||||||||||||
| Phoenix-Mesa-Chandler, AZ | 15,237 | 1,705,135 | 78.9 | % | 84.1 | % | (5.2) | % | 79.5 | % | 83.9 | % | (4.4) | % | 15.77 | 16.35 | (3.5) | % | ||||||||||||||||||||||||||||||||||||||||||||
| McAllen-Edinburg-Mission, TX | 9,845 | 1,462,368 | 88.8 | % | 90.8 | % | (2.0) | % | 88.3 | % | 90.4 | % | (2.1) | % | 13.34 | 13.49 | (1.1) | % | ||||||||||||||||||||||||||||||||||||||||||||
| Oklahoma City, OK | 9,181 | 1,327,627 | 81.9 | % | 88.0 | % | (6.1) | % | 81.6 | % | 87.6 | % | (6.0) | % | 11.53 | 10.89 | 5.9 | % | ||||||||||||||||||||||||||||||||||||||||||||
| Brownsville-Harlingen, TX | 6,536 | 940,371 | 89.5 | % | 88.9 | % | 0.6 | % | 88.3 | % | 89.2 | % | (0.9) | % | 13.09 | 13.20 | (0.8) | % | ||||||||||||||||||||||||||||||||||||||||||||
| San Antonio-New Braunfels, TX | 6,491 | 835,115 | 83.2 | % | 84.0 | % | (0.8) | % | 81.9 | % | 83.8 | % | (1.9) | % | 14.98 | 15.36 | (2.5) | % | ||||||||||||||||||||||||||||||||||||||||||||
| North Port-Bradenton-Sarasota, FL | 9,405 | 959,913 | 84.7 | % | 85.0 | % | (0.3) | % | 85.5 | % | 84.4 | % | 1.1 | % | 19.71 | 21.04 | (6.3) | % | ||||||||||||||||||||||||||||||||||||||||||||
| San Juan-Bayamón-Caguas, PR | 12,853 | 1,379,297 | 89.1 | % | 91.7 | % | (2.6) | % | 89.2 | % | 91.6 | % | (2.4) | % | 30.60 | 28.98 | 5.6 | % | ||||||||||||||||||||||||||||||||||||||||||||
| Los Angeles-Long Beach-Anaheim, CA | 9,761 | 1,063,844 | 83.6 | % | 88.0 | % | (4.4) | % | 83.1 | % | 87.1 | % | (4.0) | % | 25.30 | 24.67 | 2.6 | % | ||||||||||||||||||||||||||||||||||||||||||||
| Colorado Springs, CO | 5,640 | 707,834 | 87.1 | % | 90.1 | % | (3.0) | % | 84.5 | % | 87.3 | % | (2.8) | % | 13.40 | 13.45 | (0.4) | % | ||||||||||||||||||||||||||||||||||||||||||||
| Orlando-Kissimmee-Sanford, FL | 8,064 | 950,035 | 83.5 | % | 90.3 | % | (6.8) | % | 82.5 | % | 90.3 | % | (7.8) | % | 15.41 | 15.10 | 2.1 | % | ||||||||||||||||||||||||||||||||||||||||||||
| Tulsa, OK | 6,112 | 812,154 | 81.9 | % | 87.6 | % | (5.7) | % | 81.8 | % | 87.1 | % | (5.3) | % | 11.31 | 11.17 | 1.3 | % | ||||||||||||||||||||||||||||||||||||||||||||
| Las Vegas-Henderson-North Las Vegas, NV | 7,080 | 881,005 | 89.7 | % | 87.0 | % | 2.7 | % | 89.4 | % | 87.1 | % | 2.3 | % | 14.00 | 14.75 | (5.1) | % | ||||||||||||||||||||||||||||||||||||||||||||
| Shreveport-Bossier City, LA | 5,102 | 669,571 | 81.0 | % | 84.1 | % | (3.1) | % | 80.5 | % | 84.3 | % | (3.8) | % | 10.60 | 10.55 | 0.5 | % | ||||||||||||||||||||||||||||||||||||||||||||
| Austin-Round Rock-San Marcos, TX | 6,855 | 917,394 | 84.3 | % | 85.8 | % | (1.5) | % | 82.7 | % | 84.8 | % | (2.1) | % | 16.31 | 16.85 | (3.2) | % | ||||||||||||||||||||||||||||||||||||||||||||
| Wichita, KS | 4,198 | 586,926 | 90.8 | % | 88.3 | % | 2.5 | % | 87.8 | % | 87.5 | % | 0.3 | % | 12.93 | 12.82 | 0.9 | % | ||||||||||||||||||||||||||||||||||||||||||||
| Bend, OR | 3,937 | 570,674 | 91.5 | % | 90.6 | % | 0.9 | % | 89.3 | % | 89.2 | % | 0.1 | % | 15.23 | 15.66 | (2.7) | % | ||||||||||||||||||||||||||||||||||||||||||||
| Other MSAs | 165,042 | 20,717,179 | 84.9 | % | 86.3 | % | (1.4) | % | 83.9 | % | 85.8 | % | (1.9) | % | 15.25 | 15.40 | (1.0) | % | ||||||||||||||||||||||||||||||||||||||||||||
| Total/Weighted Average | 386,044 | 49,277,231 | 85.0 | % | 87.2 | % | (2.2) | % | 84.2 | % | 86.6 | % | (2.4) | % | $ | 15.68 | $ | 15.72 | (0.3) | % | ||||||||||||||||||||||||||||||||||||||||||
2024 Same Store Pool(2) | 371,609 | 47,561,327 | 85.1 | % | 87.2 | % | (2.1) | % | 84.2 | % | 86.6 | % | (2.4) | % | $ | 15.71 | $ | 15.76 | (0.3) | % | ||||||||||||||||||||||||||||||||||||||||||
2023 Same Store Pool(3) | 344,925 | 44,258,938 | 85.1 | % | 87.4 | % | (2.3) | % | 84.3 | % | 86.8 | % | (2.5) | % | $ | 15.77 | $ | 15.82 | (0.3) | % | ||||||||||||||||||||||||||||||||||||||||||
| (1) | MSA (Metropolitan Statistical Area) as defined by the United States Census Bureau. | |||||||||||||
| (2) | Represents the subset of properties included in the 2025 same store pool that were in NSA's same store pool reported in 2024. | |||||||||||||
| (3) | Represents the subset of properties included in the 2025 same store pool that were in NSA's same store pool reported in 2023. | |||||||||||||
| Supplemental Schedule 6 | |||||||||||||||||||||||||||||||||||||||||||||||||||||||||||||||||||||||||||||
Same Store Performance Summary By MSA(1) | |||||||||||||||||||||||||||||||||||||||||||||||||||||||||||||||||||||||||||||
| (dollars in thousands, except per square foot data) (unaudited) | |||||||||||||||||||||||||||||||||||||||||||||||||||||||||||||||||||||||||||||
| Six Months Ended June 30, 2025 compared to Six Months Ended June 30, 2024 | |||||||||||||||||||||||||||||||||||||||||||||||||||||||||||||||||||||||||||||
| Total Revenue | Property Operating Expenses | Net Operating Income | Net Operating Income Margin | ||||||||||||||||||||||||||||||||||||||||||||||||||||||||||||||||||||||||||
MSA(1) | Stores | YTD 2025 | YTD 2024 | Change | YTD 2025 | YTD 2024 | Change | YTD 2025 | YTD 2024 | Change | YTD 2025 | YTD 2024 | Change | ||||||||||||||||||||||||||||||||||||||||||||||||||||||||||||||||
| Portland-Vancouver-Hillsboro, OR-WA | 54 | $ | 22,774 | $ | 22,424 | 1.6 | % | $ | 6,567 | $ | 6,066 | 8.3 | % | $ | 16,207 | $ | 16,358 | (0.9) | % | 71.2 | % | 72.9 | % | (1.7) | % | ||||||||||||||||||||||||||||||||||||||||||||||||||||
| Riverside-San Bernardino-Ontario, CA | 49 | 26,088 | 27,499 | (5.1) | % | 6,247 | 6,432 | (2.9) | % | 19,841 | 21,067 | (5.8) | % | 76.1 | % | 76.6 | % | (0.5) | % | ||||||||||||||||||||||||||||||||||||||||||||||||||||||||||
| Houston-Pasadena-The Woodlands, TX | 37 | 16,568 | 16,295 | 1.7 | % | 5,909 | 5,755 | 2.7 | % | 10,659 | 10,540 | 1.1 | % | 64.3 | % | 64.7 | % | (0.4) | % | ||||||||||||||||||||||||||||||||||||||||||||||||||||||||||
| Atlanta-Sandy Springs-Roswell, GA | 30 | 10,864 | 12,031 | (9.7) | % | 3,672 | 3,312 | 10.9 | % | 7,192 | 8,719 | (17.5) | % | 66.2 | % | 72.5 | % | (6.3) | % | ||||||||||||||||||||||||||||||||||||||||||||||||||||||||||
| Dallas-Fort Worth-Arlington, TX | 28 | 9,773 | 10,307 | (5.2) | % | 3,896 | 3,950 | (1.4) | % | 5,877 | 6,357 | (7.6) | % | 60.1 | % | 61.7 | % | (1.6) | % | ||||||||||||||||||||||||||||||||||||||||||||||||||||||||||
| Phoenix-Mesa-Chandler, AZ | 26 | 11,242 | 12,061 | (6.8) | % | 3,043 | 3,231 | (5.8) | % | 8,199 | 8,830 | (7.1) | % | 72.9 | % | 73.2 | % | (0.3) | % | ||||||||||||||||||||||||||||||||||||||||||||||||||||||||||
| McAllen-Edinburg-Mission, TX | 21 | 9,013 | 9,335 | (3.4) | % | 2,437 | 2,499 | (2.5) | % | 6,576 | 6,836 | (3.8) | % | 73.0 | % | 73.2 | % | (0.2) | % | ||||||||||||||||||||||||||||||||||||||||||||||||||||||||||
| Oklahoma City, OK | 20 | 6,489 | 6,595 | (1.6) | % | 2,016 | 1,861 | 8.3 | % | 4,473 | 4,734 | (5.5) | % | 68.9 | % | 71.8 | % | (2.9) | % | ||||||||||||||||||||||||||||||||||||||||||||||||||||||||||
| Brownsville-Harlingen, TX | 16 | 5,689 | 5,766 | (1.3) | % | 1,648 | 1,527 | 7.9 | % | 4,041 | 4,239 | (4.7) | % | 71.0 | % | 73.5 | % | (2.5) | % | ||||||||||||||||||||||||||||||||||||||||||||||||||||||||||
| San Antonio-New Braunfels, TX | 15 | 5,382 | 5,590 | (3.7) | % | 2,203 | 1,946 | 13.2 | % | 3,179 | 3,644 | (12.8) | % | 59.1 | % | 65.2 | % | (6.1) | % | ||||||||||||||||||||||||||||||||||||||||||||||||||||||||||
| North Port-Bradenton-Sarasota, FL | 15 | 8,444 | 9,068 | (6.9) | % | 2,705 | 2,879 | (6.0) | % | 5,739 | 6,189 | (7.3) | % | 68.0 | % | 68.3 | % | (0.3) | % | ||||||||||||||||||||||||||||||||||||||||||||||||||||||||||
| San Juan-Bayamón-Caguas, PR | 15 | 19,289 | 19,056 | 1.2 | % | 3,755 | 3,662 | 2.5 | % | 15,534 | 15,394 | 0.9 | % | 80.5 | % | 80.8 | % | (0.3) | % | ||||||||||||||||||||||||||||||||||||||||||||||||||||||||||
| Los Angeles-Long Beach-Anaheim, CA | 14 | 11,435 | 12,041 | (5.0) | % | 2,998 | 2,937 | 2.1 | % | 8,437 | 9,104 | (7.3) | % | 73.8 | % | 75.6 | % | (1.8) | % | ||||||||||||||||||||||||||||||||||||||||||||||||||||||||||
| Colorado Springs, CO | 14 | 4,154 | 4,264 | (2.6) | % | 1,595 | 1,336 | 19.4 | % | 2,559 | 2,928 | (12.6) | % | 61.6 | % | 68.7 | % | (7.1) | % | ||||||||||||||||||||||||||||||||||||||||||||||||||||||||||
| Orlando-Kissimmee-Sanford, FL | 14 | 6,328 | 6,836 | (7.4) | % | 1,951 | 2,202 | (11.4) | % | 4,377 | 4,634 | (5.5) | % | 69.2 | % | 67.8 | % | 1.4 | % | ||||||||||||||||||||||||||||||||||||||||||||||||||||||||||
| Tulsa, OK | 13 | 3,967 | 4,153 | (4.5) | % | 1,238 | 1,217 | 1.7 | % | 2,729 | 2,936 | (7.1) | % | 68.8 | % | 70.7 | % | (1.9) | % | ||||||||||||||||||||||||||||||||||||||||||||||||||||||||||
| Las Vegas-Henderson-North Las Vegas, NV | 13 | 5,719 | 5,892 | (2.9) | % | 1,484 | 1,532 | (3.1) | % | 4,235 | 4,360 | (2.9) | % | 74.1 | % | 74.0 | % | 0.1 | % | ||||||||||||||||||||||||||||||||||||||||||||||||||||||||||
| Shreveport-Bossier City, LA | 12 | 3,011 | 3,153 | (4.5) | % | 1,170 | 1,049 | 11.5 | % | 1,841 | 2,104 | (12.5) | % | 61.1 | % | 66.7 | % | (5.6) | % | ||||||||||||||||||||||||||||||||||||||||||||||||||||||||||
| Austin-Round Rock-San Marcos, TX | 12 | 6,480 | 6,676 | (2.9) | % | 2,190 | 2,249 | (2.6) | % | 4,290 | 4,427 | (3.1) | % | 66.2 | % | 66.3 | % | (0.1) | % | ||||||||||||||||||||||||||||||||||||||||||||||||||||||||||
| Wichita, KS | 12 | 3,554 | 3,511 | 1.2 | % | 1,510 | 1,182 | 27.7 | % | 2,044 | 2,329 | (12.2) | % | 57.5 | % | 66.3 | % | (8.8) | % | ||||||||||||||||||||||||||||||||||||||||||||||||||||||||||
| Bend, OR | 10 | 3,980 | 4,062 | (2.0) | % | 1,044 | 942 | 10.8 | % | 2,936 | 3,120 | (5.9) | % | 73.8 | % | 76.8 | % | (3.0) | % | ||||||||||||||||||||||||||||||||||||||||||||||||||||||||||
| Other MSAs | 331 | 137,389 | 141,356 | (2.8) | % | 45,687 | 43,044 | 6.1 | % | 91,702 | 98,312 | (6.7) | % | 66.7 | % | 69.5 | % | (2.8) | % | ||||||||||||||||||||||||||||||||||||||||||||||||||||||||||
| Total/Weighted Average | 771 | $ | 337,632 | $ | 347,971 | (3.0) | % | $ | 104,965 | $ | 100,810 | 4.1 | % | $ | 232,667 | $ | 247,161 | (5.9) | % | 68.9 | % | 71.0 | % | (2.1) | % | ||||||||||||||||||||||||||||||||||||||||||||||||||||
2024 Same Store Pool(2) | 744 | $ | 326,568 | $ | 336,790 | (3.0) | % | $ | 101,168 | $ | 96,860 | 4.4 | % | $ | 225,400 | $ | 239,930 | (6.1) | % | 69.0 | % | 71.2 | % | (2.2) | % | ||||||||||||||||||||||||||||||||||||||||||||||||||||
2023 Same Store Pool(3) | 695 | $ | 305,251 | $ | 315,029 | (3.1) | % | $ | 93,632 | $ | 89,735 | 4.3 | % | $ | 211,619 | $ | 225,294 | (6.1) | % | 69.3 | % | 71.5 | % | (2.2) | % | ||||||||||||||||||||||||||||||||||||||||||||||||||||
| (1) | MSA (Metropolitan Statistical Area) as defined by the United States Census Bureau. | |||||||||||||
| (2) | Represents the subset of properties included in the 2025 same store pool that were in NSA's same store pool reported in 2024. | |||||||||||||
| (3) | Represents the subset of properties included in the 2025 same store pool that were in NSA's same store pool reported in 2023. | |||||||||||||
| Supplemental Schedule 6 (continued) | ||||||||||||||||||||||||||||||||||||||||||||||||||||||||||||||
Same Store Performance Summary By MSA(1) | ||||||||||||||||||||||||||||||||||||||||||||||||||||||||||||||
| (dollars in thousands, except per square foot data) (unaudited) | ||||||||||||||||||||||||||||||||||||||||||||||||||||||||||||||
| Six Months Ended June 30, 2025 compared to Six Months Ended June 30, 2024 | ||||||||||||||||||||||||||||||||||||||||||||||||||||||||||||||
| Rentable Square Feet | Occupancy at Period End | Average Occupancy | Average Annualized Rental Revenue per Occupied Square Foot | |||||||||||||||||||||||||||||||||||||||||||||||||||||||||||
MSA(1) | Units | YTD 2025 | YTD 2024 | Change | YTD 2025 | YTD 2024 | Change | YTD 2025 | YTD 2024 | Change | ||||||||||||||||||||||||||||||||||||||||||||||||||||
| Portland-Vancouver-Hillsboro, OR-WA | 22,069 | 2,677,879 | 89.8 | % | 90.0 | % | (0.2) | % | 88.1 | % | 86.9 | % | 1.2 | % | $ | 18.70 | $ | 18.67 | 0.2 | % | ||||||||||||||||||||||||||||||||||||||||||
| Riverside-San Bernardino-Ontario, CA | 27,155 | 3,688,295 | 83.9 | % | 87.3 | % | (3.4) | % | 84.5 | % | 86.6 | % | (2.1) | % | 16.13 | 16.40 | (1.6) | % | ||||||||||||||||||||||||||||||||||||||||||||
| Houston-Pasadena-The Woodlands, TX | 18,419 | 2,762,856 | 86.5 | % | 90.5 | % | (4.0) | % | 86.0 | % | 89.2 | % | (3.2) | % | 13.34 | 12.65 | 5.5 | % | ||||||||||||||||||||||||||||||||||||||||||||
| Atlanta-Sandy Springs-Roswell, GA | 14,217 | 1,989,409 | 81.5 | % | 83.8 | % | (2.3) | % | 79.9 | % | 81.9 | % | (2.0) | % | 13.12 | 14.24 | (7.9) | % | ||||||||||||||||||||||||||||||||||||||||||||
| Dallas-Fort Worth-Arlington, TX | 12,845 | 1,672,350 | 81.0 | % | 84.6 | % | (3.6) | % | 79.8 | % | 84.5 | % | (4.7) | % | 14.04 | 14.15 | (0.8) | % | ||||||||||||||||||||||||||||||||||||||||||||
| Phoenix-Mesa-Chandler, AZ | 15,237 | 1,705,135 | 78.9 | % | 84.1 | % | (5.2) | % | 80.4 | % | 83.9 | % | (3.5) | % | 15.79 | 16.30 | (3.1) | % | ||||||||||||||||||||||||||||||||||||||||||||
| McAllen-Edinburg-Mission, TX | 9,845 | 1,462,368 | 88.8 | % | 90.8 | % | (2.0) | % | 88.0 | % | 90.1 | % | (2.1) | % | 13.39 | 13.61 | (1.6) | % | ||||||||||||||||||||||||||||||||||||||||||||
| Oklahoma City, OK | 9,181 | 1,327,627 | 81.9 | % | 88.0 | % | (6.1) | % | 81.7 | % | 87.1 | % | (5.4) | % | 11.47 | 10.95 | 4.7 | % | ||||||||||||||||||||||||||||||||||||||||||||
| Brownsville-Harlingen, TX | 6,536 | 940,371 | 89.5 | % | 88.9 | % | 0.6 | % | 87.7 | % | 89.9 | % | (2.2) | % | 13.14 | 13.25 | (0.8) | % | ||||||||||||||||||||||||||||||||||||||||||||
| San Antonio-New Braunfels, TX | 6,491 | 835,115 | 83.2 | % | 84.0 | % | (0.8) | % | 81.7 | % | 83.1 | % | (1.4) | % | 15.17 | 15.50 | (2.1) | % | ||||||||||||||||||||||||||||||||||||||||||||
| North Port-Bradenton-Sarasota, FL | 9,405 | 959,913 | 84.7 | % | 85.0 | % | (0.3) | % | 87.0 | % | 84.4 | % | 2.6 | % | 19.56 | 21.54 | (9.2) | % | ||||||||||||||||||||||||||||||||||||||||||||
| San Juan-Bayamón-Caguas, PR | 12,853 | 1,379,297 | 89.1 | % | 91.7 | % | (2.6) | % | 89.6 | % | 92.0 | % | (2.4) | % | 30.35 | 28.93 | 4.9 | % | ||||||||||||||||||||||||||||||||||||||||||||
| Los Angeles-Long Beach-Anaheim, CA | 9,761 | 1,063,844 | 83.6 | % | 88.0 | % | (4.4) | % | 83.7 | % | 86.9 | % | (3.2) | % | 24.98 | 24.80 | 0.7 | % | ||||||||||||||||||||||||||||||||||||||||||||
| Colorado Springs, CO | 5,640 | 707,834 | 87.1 | % | 90.1 | % | (3.0) | % | 83.0 | % | 85.7 | % | (2.7) | % | 13.53 | 13.54 | (0.1) | % | ||||||||||||||||||||||||||||||||||||||||||||
| Orlando-Kissimmee-Sanford, FL | 8,064 | 950,035 | 83.5 | % | 90.3 | % | (6.8) | % | 83.2 | % | 90.5 | % | (7.3) | % | 15.32 | 14.91 | 2.7 | % | ||||||||||||||||||||||||||||||||||||||||||||
| Tulsa, OK | 6,112 | 812,154 | 81.9 | % | 87.6 | % | (5.7) | % | 82.1 | % | 86.3 | % | (4.2) | % | 11.32 | 11.29 | 0.3 | % | ||||||||||||||||||||||||||||||||||||||||||||
| Las Vegas-Henderson-North Las Vegas, NV | 7,080 | 881,005 | 89.7 | % | 87.0 | % | 2.7 | % | 88.6 | % | 87.0 | % | 1.6 | % | 14.08 | 14.73 | (4.4) | % | ||||||||||||||||||||||||||||||||||||||||||||
| Shreveport-Bossier City, LA | 5,102 | 669,571 | 81.0 | % | 84.1 | % | (3.1) | % | 80.0 | % | 84.8 | % | (4.8) | % | 10.64 | 10.53 | 1.0 | % | ||||||||||||||||||||||||||||||||||||||||||||
| Austin-Round Rock-San Marcos, TX | 6,855 | 917,394 | 84.3 | % | 85.8 | % | (1.5) | % | 82.3 | % | 84.9 | % | (2.6) | % | 16.53 | 16.85 | (1.9) | % | ||||||||||||||||||||||||||||||||||||||||||||
| Wichita, KS | 4,198 | 586,926 | 90.8 | % | 88.3 | % | 2.5 | % | 86.4 | % | 87.5 | % | (1.1) | % | 13.04 | 12.85 | 1.5 | % | ||||||||||||||||||||||||||||||||||||||||||||
| Bend, OR | 3,937 | 570,674 | 91.5 | % | 90.6 | % | 0.9 | % | 87.7 | % | 87.2 | % | 0.5 | % | 15.39 | 15.80 | (2.6) | % | ||||||||||||||||||||||||||||||||||||||||||||
| Other MSAs | 165,042 | 20,717,179 | 84.9 | % | 86.3 | % | (1.4) | % | 83.7 | % | 85.4 | % | (1.7) | % | 15.26 | 15.44 | (1.2) | % | ||||||||||||||||||||||||||||||||||||||||||||
| Total/Weighted Average | 386,044 | 49,277,231 | 85.0 | % | 87.2 | % | (2.2) | % | 84.1 | % | 86.2 | % | (2.1) | % | $ | 15.68 | $ | 15.79 | (0.7) | % | ||||||||||||||||||||||||||||||||||||||||||
2024 Same Store Pool(2) | 371,609 | 47,561,327 | 85.1 | % | 87.2 | % | (2.1) | % | 84.1 | % | 86.2 | % | (2.1) | % | $ | 15.71 | $ | 15.83 | (0.7) | % | ||||||||||||||||||||||||||||||||||||||||||
2023 Same Store Pool(3) | 344,925 | 44,258,938 | 85.1 | % | 87.4 | % | (2.3) | % | 84.2 | % | 86.4 | % | (2.2) | % | $ | 15.77 | $ | 15.89 | (0.7) | % | ||||||||||||||||||||||||||||||||||||||||||
| (1) | MSA (Metropolitan Statistical Area) as defined by the United States Census Bureau. | |||||||||||||
| (2) | Represents the subset of properties included in the 2025 same store pool that were in NSA's same store pool reported in 2024. | |||||||||||||
| (3) | Represents the subset of properties included in the 2025 same store pool that were in NSA's same store pool reported in 2023. | |||||||||||||
| Supplemental Schedule 7 | |||||||||||||||||||||||||||||||||||||||||
Same Store Operating Data (771 Stores) - Trailing Five Quarters | |||||||||||||||||||||||||||||||||||||||||
| (dollars in thousands, except per square foot data) (unaudited) | |||||||||||||||||||||||||||||||||||||||||
| 2Q 2025 | 1Q 2025 | 4Q 2024 | 3Q 2024 | 2Q 2024 | YTD 2025 | YTD 2024 | |||||||||||||||||||||||||||||||||||
| Revenue | |||||||||||||||||||||||||||||||||||||||||
| Rental revenue | $ | 162,570 | $ | 162,224 | $ | 164,207 | $ | 167,820 | $ | 167,825 | $ | 324,794 | $ | 335,445 | |||||||||||||||||||||||||||
| Other property-related revenue | 6,405 | 6,433 | 6,380 | 7,028 | 6,359 | 12,838 | 12,526 | ||||||||||||||||||||||||||||||||||
| Total revenue | 168,975 | 168,657 | 170,587 | 174,848 | 174,184 | 337,632 | 347,971 | ||||||||||||||||||||||||||||||||||
| Property operating expenses | |||||||||||||||||||||||||||||||||||||||||
| Store payroll and related costs | 12,429 | 12,182 | 12,076 | 12,103 | 12,834 | 24,611 | 25,792 | ||||||||||||||||||||||||||||||||||
| Property tax expense | 15,170 | 15,116 | 14,630 | 14,338 | 13,987 | 30,286 | 28,419 | ||||||||||||||||||||||||||||||||||
| Utilities expense | 4,935 | 5,470 | 4,844 | 5,699 | 4,558 | 10,405 | 9,453 | ||||||||||||||||||||||||||||||||||
| Repairs & maintenance expense | 4,487 | 4,771 | 3,557 | 3,674 | 4,049 | 9,258 | 8,037 | ||||||||||||||||||||||||||||||||||
| Marketing expense | 6,560 | 5,224 | 4,436 | 4,446 | 4,709 | 11,784 | 9,071 | ||||||||||||||||||||||||||||||||||
| Insurance expense | 2,323 | 2,489 | 2,645 | 2,557 | 2,659 | 4,812 | 5,142 | ||||||||||||||||||||||||||||||||||
| Other property operating expenses | 6,816 | 6,993 | 7,492 | 7,545 | 7,611 | 13,809 | 14,896 | ||||||||||||||||||||||||||||||||||
| Total property operating expenses | 52,720 | 52,245 | 49,680 | 50,362 | 50,407 | 104,965 | 100,810 | ||||||||||||||||||||||||||||||||||
| Net operating income | $ | 116,255 | $ | 116,412 | $ | 120,907 | $ | 124,486 | $ | 123,777 | $ | 232,667 | $ | 247,161 | |||||||||||||||||||||||||||
| Net operating income margin | 68.8 | % | 69.0 | % | 70.9 | % | 71.2 | % | 71.1 | % | 68.9 | % | 71.0 | % | |||||||||||||||||||||||||||
| Occupancy at period end | 85.0 | % | 83.6 | % | 84.7 | % | 85.9 | % | 87.2 | % | 85.0 | % | 87.2 | % | |||||||||||||||||||||||||||
| Average occupancy | 84.2 | % | 83.9 | % | 85.5 | % | 86.5 | % | 86.6 | % | 84.1 | % | 86.2 | % | |||||||||||||||||||||||||||
| Average annualized rental revenue (includes fees and net of any discounts and uncollectible customer amounts) per occupied square foot | $ | 15.68 | $ | 15.70 | $ | 15.60 | $ | 15.73 | $ | 15.72 | $ | 15.68 | $ | 15.79 | |||||||||||||||||||||||||||
| Average annual contract storage rent per square foot | |||||||||||||||||||||||||||||||||||||||||
| In-place customers | $ | 14.72 | $ | 14.64 | $ | 14.50 | $ | 14.68 | $ | 14.72 | $ | 14.68 | $ | 14.83 | |||||||||||||||||||||||||||
| Move-ins | $ | 10.30 | $ | 9.89 | $ | 9.08 | $ | 9.60 | $ | 10.17 | $ | 10.12 | $ | 10.23 | |||||||||||||||||||||||||||
| Move-outs | $ | 13.37 | $ | 13.22 | $ | 13.39 | $ | 13.65 | $ | 13.68 | $ | 13.30 | $ | 13.93 | |||||||||||||||||||||||||||
| Supplemental Schedule 8 | |||||||||||||||||||||||||||||||||||||||||
| Reconciliation of Same Store Data and Net Operating Income to Net Income | |||||||||||||||||||||||||||||||||||||||||
| (dollars in thousands) (unaudited) | |||||||||||||||||||||||||||||||||||||||||
| 2Q 2025 | 1Q 2025 | 4Q 2024 | 3Q 2024 | 2Q 2024 | YTD 2025 | YTD 2024 | |||||||||||||||||||||||||||||||||||
| Rental revenue | |||||||||||||||||||||||||||||||||||||||||
Same store portfolio | $ | 162,570 | $ | 162,224 | $ | 164,207 | $ | 167,820 | $ | 167,825 | $ | 324,794 | $ | 335,445 | |||||||||||||||||||||||||||
Non-same store portfolio | 7,268 | 7,251 | 6,822 | 6,647 | 6,544 | 14,519 | 19,306 | ||||||||||||||||||||||||||||||||||
Total rental revenue | 169,838 | 169,475 | 171,029 | 174,467 | 174,369 | 339,313 | 354,751 | ||||||||||||||||||||||||||||||||||
| Other property-related revenue | |||||||||||||||||||||||||||||||||||||||||
Same store portfolio | 6,405 | 6,433 | 6,380 | 7,028 | 6,359 | 12,838 | 12,526 | ||||||||||||||||||||||||||||||||||
Non-same store portfolio | 369 | 311 | 328 | 377 | 198 | 680 | 723 | ||||||||||||||||||||||||||||||||||
Total other property-related revenue | 6,774 | 6,744 | 6,708 | 7,405 | 6,557 | 13,518 | 13,249 | ||||||||||||||||||||||||||||||||||
| Property operating expenses | |||||||||||||||||||||||||||||||||||||||||
Same store portfolio | 52,720 | 52,245 | 49,680 | 50,362 | 50,407 | 104,965 | 100,810 | ||||||||||||||||||||||||||||||||||
Non-same store portfolio | 2,907 | 2,859 | 2,696 | 2,641 | 2,307 | 5,766 | 7,106 | ||||||||||||||||||||||||||||||||||
Prior period comparability adjustment(1) | — | — | (131) | (291) | (513) | — | (1,021) | ||||||||||||||||||||||||||||||||||
Total property operating expenses | 55,627 | 55,104 | 52,245 | 52,712 | 52,201 | 110,731 | 106,895 | ||||||||||||||||||||||||||||||||||
| Net operating income | 120,985 | 121,115 | 125,492 | 129,160 | 128,725 | 242,100 | 261,105 | ||||||||||||||||||||||||||||||||||
| Management fees and other revenue | 12,230 | 12,135 | 12,381 | 11,749 | 9,522 | 24,365 | 18,596 | ||||||||||||||||||||||||||||||||||
| General and administrative expenses | (12,804) | (13,145) | (12,629) | (13,114) | (16,189) | (25,949) | (31,863) | ||||||||||||||||||||||||||||||||||
| Depreciation and amortization | (47,612) | (48,116) | (48,153) | (47,661) | (46,710) | (95,728) | (94,041) | ||||||||||||||||||||||||||||||||||
| Other | (4,500) | (4,476) | (3,356) | (3,643) | (3,375) | (8,976) | (6,867) | ||||||||||||||||||||||||||||||||||
| Interest expense | (41,269) | (40,475) | (39,340) | (39,575) | (37,228) | (81,744) | (75,345) | ||||||||||||||||||||||||||||||||||
| Loss on early extinguishment of debt | — | — | — | (323) | — | — | — | ||||||||||||||||||||||||||||||||||
| Equity in (losses) of unconsolidated real estate ventures | (3,945) | (5,739) | (5,284) | (4,712) | (4,449) | (9,684) | (6,079) | ||||||||||||||||||||||||||||||||||
| Acquisition and integration costs | (2,040) | (2,445) | (1,465) | (1,164) | (480) | (4,485) | (987) | ||||||||||||||||||||||||||||||||||
| Non-operating income (expense) | 462 | 360 | (38) | (83) | 337 | 822 | 435 | ||||||||||||||||||||||||||||||||||
| Gain on sale of self storage properties | 9,571 | 1,425 | — | — | 2,668 | 10,996 | 63,841 | ||||||||||||||||||||||||||||||||||
| Income tax expense | (120) | (1,120) | (1,477) | (863) | (541) | (1,240) | (1,427) | ||||||||||||||||||||||||||||||||||
| Net Income | $ | 30,958 | $ | 19,519 | $ | 26,131 | $ | 29,771 | $ | 32,280 | $ | 50,477 | $ | 127,368 | |||||||||||||||||||||||||||
| (1) | Certain payroll and related costs associated with the former PRO portfolios were not reflected as property-level expenses in 2024 under the management of the former PROs. Such costs are reflected in property operating expenses in 2025 under our management. For purposes of comparable same store reporting, we have included the specific 2024 expense amounts for the same store portfolio in the relevant periods. This line item is presented in order to reconcile total property operating expenses to previously reported figures. | |||||||||||||
| Supplemental Schedule 9 | |||||||||||||||||||||||
| Selected Financial Information | |||||||||||||||||||||||
| (dollars in thousands, except per square foot data) (unaudited) | |||||||||||||||||||||||
| Three Months Ended June 30, | Six Months Ended June 30, | ||||||||||||||||||||||
| 2025 | 2024 | 2025 | 2024 | ||||||||||||||||||||
| Average Annualized Rental Revenue Per Occupied Square Foot | |||||||||||||||||||||||
Same store | $ | 15.68 | $ | 15.72 | $ | 15.68 | $ | 15.79 | |||||||||||||||
Total consolidated portfolio | 15.56 | 15.59 | 15.56 | 15.65 | |||||||||||||||||||
| Average Occupancy | |||||||||||||||||||||||
Same store | 84.2 | % | 86.6 | % | 84.1 | % | 86.2 | % | |||||||||||||||
Total consolidated portfolio | 83.6 | % | 86.1 | % | 83.6 | % | 85.8 | % | |||||||||||||||
| Total Consolidated Portfolio Capital Expenditures | |||||||||||||||||||||||
Recurring capital expenditures | $ | 3,429 | $ | 3,025 | $ | 8,701 | $ | 5,796 | |||||||||||||||
| Value enhancing capital expenditures | 1,927 | 346 | 1,927 | 2,172 | |||||||||||||||||||
Acquisitions capital expenditures | 843 | 645 | 1,042 | 1,549 | |||||||||||||||||||
| Total consolidated portfolio capital expenditures | $ | 6,199 | $ | 4,016 | $ | 11,670 | $ | 9,517 | |||||||||||||||
| Property Operating Expenses Detail | |||||||||||||||||||||||
| Store payroll and related costs | $ | 13,206 | $ | 12,965 | $ | 26,120 | $ | 26,487 | |||||||||||||||
| Property tax expense | 15,918 | 14,508 | 31,835 | 30,434 | |||||||||||||||||||
| Utilities expense | 5,243 | 4,808 | 10,968 | 10,230 | |||||||||||||||||||
| Repairs & maintenance expense | 4,707 | 4,227 | 9,711 | 8,524 | |||||||||||||||||||
| Marketing expense | 6,862 | 4,918 | 12,390 | 9,717 | |||||||||||||||||||
| Insurance expense | 2,505 | 2,828 | 5,194 | 5,579 | |||||||||||||||||||
| Other property operating expenses | 7,186 | 7,947 | 14,513 | 15,924 | |||||||||||||||||||
Property operating expenses on the Company's statements of operations | $ | 55,627 | $ | 52,201 | $ | 110,731 | $ | 106,895 | |||||||||||||||
| General and Administrative Expenses Detail | |||||||||||||||||||||||
| Supervisory and administrative expenses | $ | 1,388 | $ | 5,076 | $ | 2,829 | $ | 10,149 | |||||||||||||||
| Equity-based compensation expense | 2,013 | 2,331 | 3,980 | 4,186 | |||||||||||||||||||
| Other general and administrative expenses | 9,403 | 8,782 | 19,140 | 17,528 | |||||||||||||||||||
General and administrative expenses on the Company's statements of operations | $ | 12,804 | $ | 16,189 | $ | 25,949 | $ | 31,863 | |||||||||||||||
| Equity Research Coverage | ||||||||||||||
| Barclays | BMO Capital Markets | BNP Paribas Exane | ||||||||||||
| Brendan Lynch | Juan Sanabria | John Paul Flangos | ||||||||||||
| 212.526.9428 | 312.845.4074 | 646.342.5660 | ||||||||||||
| BofA Global Research | Citi Investment Research | Deutsche Bank | ||||||||||||
| Samir Khanal | Eric Wolfe | Omotayo Okusanya | ||||||||||||
| 646.855.1497 | 212.816.2640 | 212.250.9284 | ||||||||||||
| Evercore ISI | Green Street | Jefferies | ||||||||||||
| Steve Sakwa | Spenser Glimcher | Jonathan Petersen | ||||||||||||
| 212.446.9462 | 949.640.8780 | 212.284.1705 | ||||||||||||
| KeyBanc Capital Markets | Mizuho Securities | Morgan Stanley | ||||||||||||
| Todd Thomas | Ravi Vaidya | Ronald Kamdem | ||||||||||||
| 917.368.2286 | 212.282.4347 | 212.296.8319 | ||||||||||||
| RW Baird | Truist Securities | UBS | ||||||||||||
| Wes Golladay | Ki Bin Kim | Michael Goldsmith | ||||||||||||
| 216.737.7510 | 212.303.4124 | 212.713.2951 | ||||||||||||
| Wells Fargo | Wolfe Research | |||||||||||||
| Eric Luebchow | Andrew Rosivach | |||||||||||||
| 312.630.2386 | 646.582.9250 | |||||||||||||