Shareholder Report
May 31, 2025
USD ($)
Holding
columbiathreadneedleus.com/resources/literature
. You can also request more information by contacting us at 1-800-345-6611.
What were the Fund costs for the reporting period?
(Based on a hypothetical $10,000 investment)
| Class | Cost of a $10,000 investment | Cost paid as a percentage of a $10,000 investment |
| Class A | $ 83 | 0.82 % |
Management's Discussion of Fund Performance
The performance of Class A shares for the period presented is shown in the Average Annual Total Returns table.
Top Performance Contributors
Credit quality security selection
| Positive contribution to benchmark-relative performance was driven by security selection in nonrated bonds and bonds rated BBB.Sector security selection
| Strong sector security selection, particularly in utilities, special tax, tobacco and continuing care retirement communities (CCRC) bonds contributed to the Fund’s performance relative to its benchmark.Sector allocation
| An overweight to the CCRC sector and underweights to the state general obligation (GO) and industrial development revenue/pollution control revenue (IDR/PCR) sectors added to the Fund’s relative performance.Credit quality allocation
| An underweight to AA rated bonds added modestly to relative performance.Top Performance Detractors
Sector security selection
Yield curve positioning
| The Fund’s interest rate positioning detracted from performance. Specifically, the Fund’s overweight to longer maturity bonds (20 years and longer) detracted from performance relative to the benchmark, as municipal market interest rates rose in this portion of the curve.Sector allocation
| While sector allocation was broadly positive, an underweight to tobacco bonds was a modest detractor.Credit quality allocation
| An overweight to bonds rated BBB detracted from relative performance.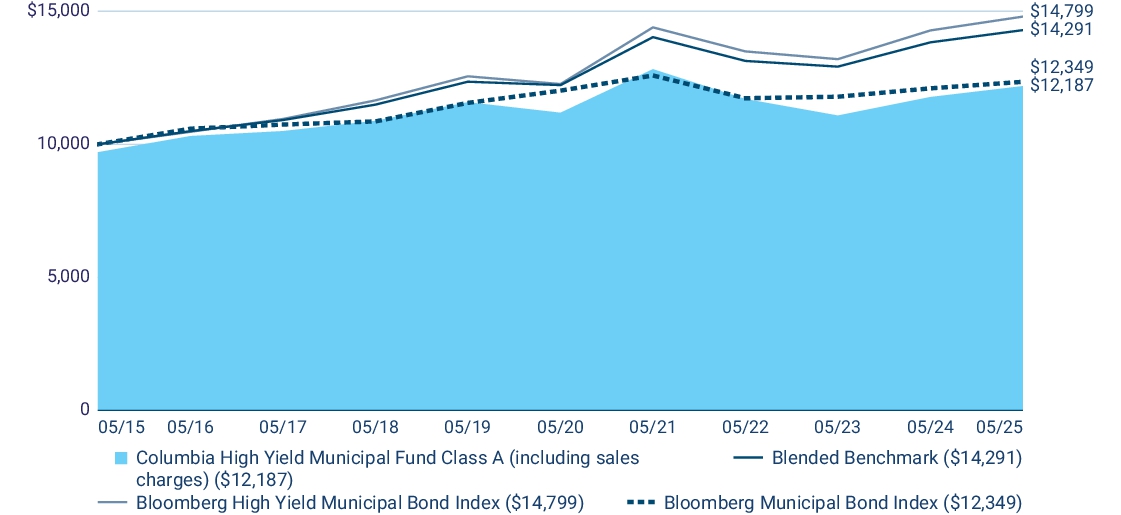
| Average Annual Total Returns (%) | 1 year | 5 years | 10 years |
| Class A (excluding sales charges) (a) | 3.49 | 1.73 | 2.31 |
| Class A (including sales charges) (a) | 0.34 | 1.11 | 2.00 |
| Blended Benchmark - 80% Bloomberg High Yield Municipal Bond Index, 20% Bloomberg Municipal Bond Index | 3.32 | 3.17 | 3.63 |
| Bloomberg High Yield Municipal Bond Index | 3.64 | 3.83 | 4.00 |
| Bloomberg Municipal Bond Index | 2.03 | 0.55 | 2.13 |
(a) | The Fund’s performance prior to November 2021 reflects returns achieved by the Investment Manager according to different principal investment strategies. If the Fund’s current management and strategies had been in place for the prior periods, results shown may have been different. |
November 2021
reflects returns achieved by the Investment Manager according to different principal investment strategies. If the Fund’s current management and strategies had been in place for the prior periods, results shown may have been different.
columbiathreadneedleus.com/investment-products/mutual-funds
for more recent performance information.
Key Fund Statistics
Fund net assets | $ 457,349,806 |
Total number of portfolio holdings | 276 |
Management services fees (represents 0.54% of Fund average net assets) | $ 2,671,658 |
Portfolio turnover for the reporting period | 32% |
Graphical Representation of Fund Holdings
The tables below show the investment makeup of the Fund represented as a percentage of Fund net assets. Derivatives are excluded from the tables unless otherwise noted. The Fund's portfolio composition is subject to change.
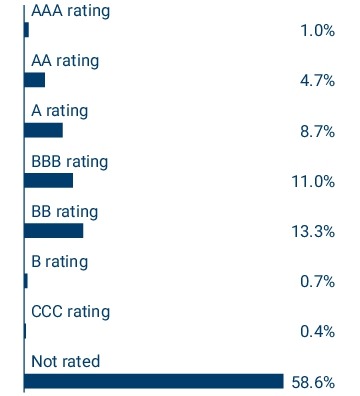
Bond ratings on Fund holdings are divided into categories ranging from highest to lowest credit quality, determined by using the middle rating of Moody’s Ratings, S&P and Fitch, after dropping the highest and lowest available ratings. When ratings are available from only two rating agencies, the lower rating is used. When a rating is available from only one rating agency, th
at ra
ting is used. If a security is not rated by Moody's Ratings, S&P or Fitch, but has a rating by Kroll and/or DBRS, the same methodology is applied to those bonds that would otherwise be not rated. When a bond is not rated by any rating agency, it is designated as “Not rated.” Credit quality ratings assigned by a rating agency are subjective opinions, not statements of fact, and are subject to change, including daily.Top States/Territories
| Wisconsin | 9.9 % |
| Colorado | 8.6 % |
| Florida | 7.8 % |
| Texas | 7.3 % |
| Illinois | 7.2 % |
| Puerto Rico | 6.6 % |
| California | 5.9 % |
| New York | 4.6 % |
| New Hampshire | 3.9 % |
| Ohio | 3.8 % |
Asset Categories

Credit Quality

at ra
ting is used. If a security is not rated by Moody's Ratings, S&P or Fitch, but has a rating by Kroll and/or DBRS, the same methodology is applied to those bonds that would otherwise be not rated. When a bond is not rated by any rating agency, it is designated as “Not rated.” Credit quality ratings assigned by a rating agency are subjective opinions, not statements of fact, and are subject to change, including daily.
Top States/Territories
| Wisconsin | 9.9 % |
| Colorado | 8.6 % |
| Florida | 7.8 % |
| Texas | 7.3 % |
| Illinois | 7.2 % |
| Puerto Rico | 6.6 % |
| California | 5.9 % |
| New York | 4.6 % |
| New Hampshire | 3.9 % |
| Ohio | 3.8 % |
columbiathreadneedleus.com/resources/literature
. You can also request more information by contacting us at 1-800-345-6611.
What were the Fund costs for the reporting period?
(Based on a hypothetical $10,000 investment)
| Class | Cost of a $10,000 investment | Cost paid as a percentage of a $10,000 investment |
| Class C | $ 143 | 1.41 % |
Management's Discussion of Fund Performance
The performance of Class C shares for the period presented is shown in the Average Annual Total Returns table.
Top Performance Contributors
Credit quality security selection
| Positive contribution to benchmark-relative performance was driven by security selection in nonrated bonds and bonds rated BBB.Sector security selection
| Strong sector security selection, particularly in utilities, special tax, tobacco and continuing care retirement communities (CCRC) bonds contributed to the Fund’s performance relative to its benchmark.Sector allocation
| An overweight to the CCRC sector and underweights to the state general obligation (GO) and industrial development revenue/pollution control revenue (IDR/PCR) sectors added to the Fund’s relative performance.Credit quality allocation
| An underweight to AA rated bonds added modestly to relative performance.Top Performance Detractors
Sector security selection
Yield curve positioning
| The Fund’s interest rate positioning detracted from performance. Specifically, the Fund’s overweight to longer maturity bonds (20 years and longer) detracted from performance relative to the benchmark, as municipal market interest rates rose in this portion of the curve.Sector allocation
| While sector allocation was broadly positive, an underweight to tobacco bonds was a modest detractor.Credit quality allocation
| An overweight to bonds rated BBB detracted from relative performance.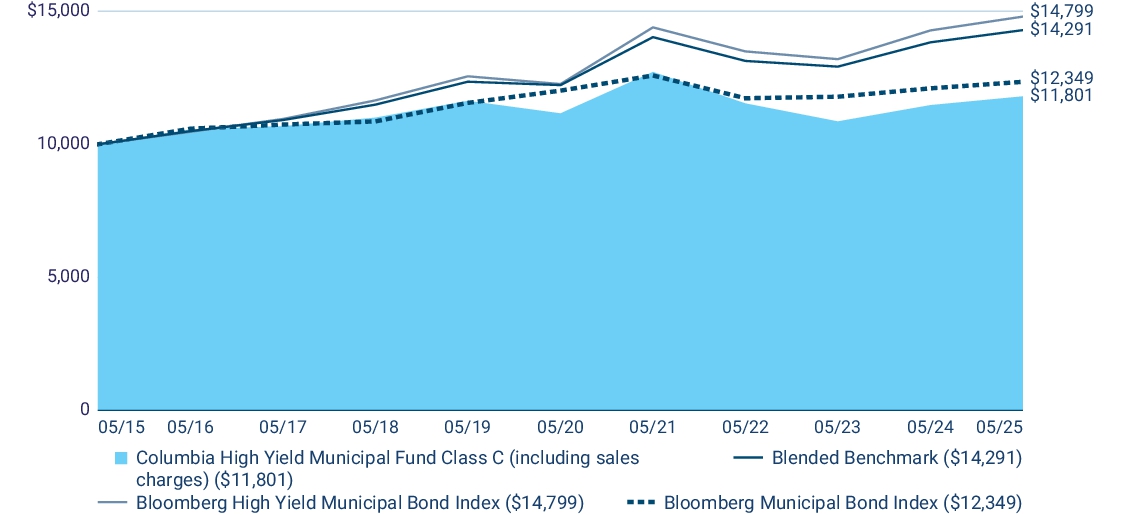
| Average Annual Total Returns (%) | 1 year | 5 years | 10 years |
| Class C (excluding sales charges) (a) | 2.87 | 1.12 | 1.67 |
| Class C (including sales charges) (a) | 1.88 | 1.12 | 1.67 |
| Blended Benchmark - 80% Bloomberg High Yield Municipal Bond Index, 20% Bloomberg Municipal Bond Index | 3.32 | 3.17 | 3.63 |
| Bloomberg High Yield Municipal Bond Index | 3.64 | 3.83 | 4.00 |
| Bloomberg Municipal Bond Index | 2.03 | 0.55 | 2.13 |
(a) | The Fund’s performance prior to November 2021 reflects returns achieved by the Investment Manager according to different principal investment strategies. If the Fund’s current management and strategies had been in place for the prior periods, results shown may have been different. |
columbiathreadneedleus.com/investment-products/mutual-funds
for more recent performance information.
Key Fund Statistics
Fund net assets | $ 457,349,806 |
Total number of portfolio holdings | 276 |
Management services fees (represents 0.54% of Fund average net assets) | $ 2,671,658 |
Portfolio turnover for the reporting period | 32% |
Graphical Representation of Fund Holdings
The tables below show the investment makeup of the Fund represented as a percentage of Fund net assets. Derivatives are excluded from the tables unless otherwise noted. The Fund's portfolio composition is subject to change.
Bond ratings on Fund holdings are divided into categories ranging from highest to lowest credit quality, determined by using the middle rating of Moody’s Ratings, S&P and Fitch, after dropping the highest and lowest available ratings. When ratings are available from only two rating agencies, the lower rating is used. When a rating is available from only one rating agency, that rating is used. If a security is not rated by Moody's Ratings, S&P or Fitch, but has a rating by Kroll and/or DBRS, the same methodology is applied to those bonds that would otherwise be not rated. When a bond is not rated by any rating agency, it is designated as “Not rated.” Credit quality ratings assigned by a rating agency are subjective opinions, not statements of fact, and are subject to change, including daily.
Top States/Territories
| Wisconsin | 9.9 % |
| Colorado | 8.6 % |
| Florida | 7.8 % |
| Texas | 7.3 % |
| Illinois | 7.2 % |
| Puerto Rico | 6.6 % |
| California | 5.9 % |
| New York | 4.6 % |
| New Hampshire | 3.9 % |
| Ohio | 3.8 % |
Asset Categories

Credit Quality
Top States/Territories
| Wisconsin | 9.9 % |
| Colorado | 8.6 % |
| Florida | 7.8 % |
| Texas | 7.3 % |
| Illinois | 7.2 % |
| Puerto Rico | 6.6 % |
| California | 5.9 % |
| New York | 4.6 % |
| New Hampshire | 3.9 % |
| Ohio | 3.8 % |
columbiathreadneedleus.com/resources/literature
. You can also request more information by contacting us at 1-800-345-6611.
What were the Fund costs for the reporting period?
(Based on a hypothetical $10,000 investment)
| Class | Cost of a $10,000 investment | Cost paid as a percentage of a $10,000 investment |
| Institutional Class | $ 63 | 0.62 % |
Management's Discussion of Fund Performance
The performance of Institutional Class shares for the period presented is shown in the Average Annual Total Returns table.
Top Performance Contributors
Credit quality security selection
| Positive contribution to benchmark-relative performance was driven by security selection in nonrated bonds and bonds rated BBB.Sector security selection
| Strong sector security selection, particularly in utilities, special tax, tobacco and continuing care retirement communities (CCRC) bonds contributed to the Fund’s performance relative to its benchmark.Sector allocation
| An overweight to the CCRC sector and underweights to the state general obligation (GO) and industrial development revenue/pollution control revenue (IDR/PCR) sectors added to the Fund’s relative performance.Credit quality allocation
| An underweight to AA rated bonds added modestly to relative performance.Top Performance Detractors
Sector security selection
elec
tion was positive overall. However, selection in nursing home/assisted living, housing and hospital sectors detracted from relative performance.Yield curve positioning
| The Fund’s interest rate positioning detracted from performance. Specifically, the Fund’s overweight to longer maturity bonds (20 years and longer) detracted from performance relative to the benchmark, as municipal market interest rates rose in this portion of the curve.Sector allocation
| While sector allocation was broadly positive, an underweight to tobacco bonds was a modest detractor.Credit quality allocation
| An overweight to bonds rated BBB detracted from relative performance.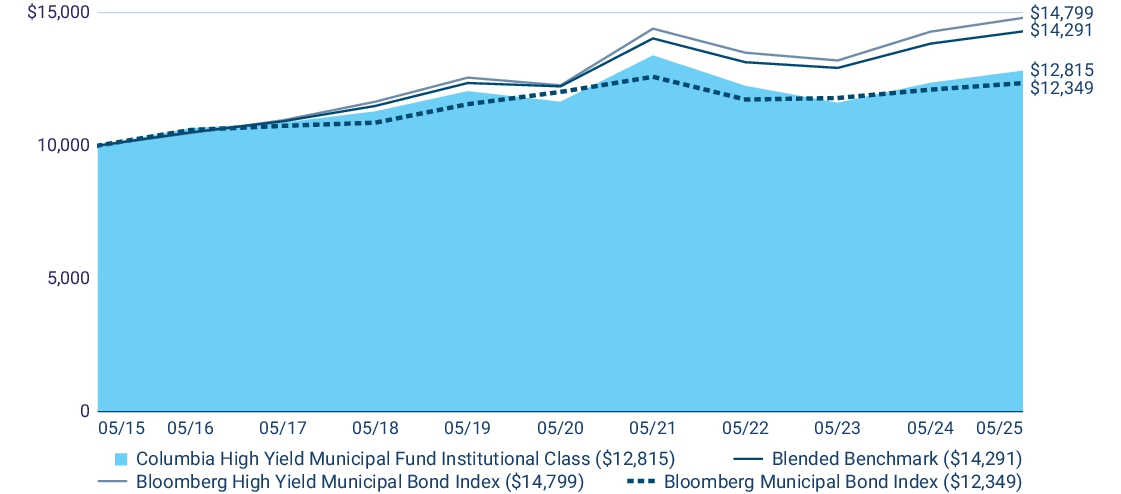
| Average Annual Total Returns (%) | 1 year | 5 years | 10 years |
| Institutional Class (a) | 3.69 | 1.93 | 2.51 |
| Blended Benchmark - 80% Bloomberg High Yield Municipal Bond Index, 20% Bloomberg Municipal Bond Index | 3.32 | 3.17 | 3.63 |
| Bloomberg High Yield Municipal Bond Index | 3.64 | 3.83 | 4.00 |
| Bloomberg Municipal Bond Index | 2.03 | 0.55 | 2.13 |
(a) | The Fund’s performance prior to November 2021 reflects returns achieved by the Investment Manager according to different principal investment strategies. If the Fund’s current management and strategies had been in place for the prior periods, results shown may have been different. |
columbiathreadneedleus.com/investment-products/mutual-funds
for more recent performance information.
Key Fund Statistics
Fund net assets | $ 457,349,806 |
Total number of portfolio holdings | 276 |
Management services fees (represents 0.54% of Fund average net assets) | $ 2,671,658 |
Portfolio turnover for the reporting period | 32% |
Graphical Representation of Fund Holdings
The tables below show the investment makeup of the Fund represented as a percentage of Fund net assets. Derivatives are excluded from the tables unless otherwise noted. The Fund's portfolio composition is subject to change.
Bond ratings on Fund holdings are divided into categories ranging from highest to lowest credit quality, determined by using the middle rating of Moody’s Ratings, S&P and Fitch, after dropping the highest and lowest available ratings. When ratings are available from only two rating agencies, the lower rating is used. When a rating is available from only one rating agency, that rating is used. If a security is not rated by Moody's Ratings, S&P or Fitch, but has a rating by Kroll and/or DBRS, the same methodology is applied to those bonds that would otherwise be not rated. When a bond is not rated by any rating agency, it is designated as “Not rated.” Credit quality ratings assigned by a rating agency are subjective opinions, not statements of fact, and are subject to change, including daily.
Top States/Territories
| Wisconsin | 9.9 % |
| Colorado | 8.6 % |
| Florida | 7.8 % |
| Texas | 7.3 % |
| Illinois | 7.2 % |
| Puerto Rico | 6.6 % |
| California | 5.9 % |
| New York | 4.6 % |
| New Hampshire | 3.9 % |
| Ohio | 3.8 % |
Asset Categories
Credit Quality

Top States/Territories
| Wisconsin | 9.9 % |
| Colorado | 8.6 % |
| Florida | 7.8 % |
| Texas | 7.3 % |
| Illinois | 7.2 % |
| Puerto Rico | 6.6 % |
| California | 5.9 % |
| New York | 4.6 % |
| New Hampshire | 3.9 % |
| Ohio | 3.8 % |
columbiathreadneedleus.com/resources/literature
. You can also request more information by contacting us at 1-800-345-6611.
What were the Fund costs for the reporting period?
(Based on a hypothetical $10,000 investment)
| Class | Cost of a $10,000 investment | Cost paid as a percentage of a $10,000 investment |
| Institutional 2 Class | $ 60 | 0.59 % |
Management's Discussion of Fund Performance
The performance of Institutional 2 Class shares for the period presented is shown in the Average Annual Total Returns table.
Top Performance Contributors
Credit quality security selection
| Positive contribution to benchmark-relative performance was driven by security selection in nonrated bonds and bonds rated BBB.Sector security selection
| Strong sector security selection, particularly in utilities, special tax, tobacco and continuing care retirement communities (CCRC) bonds contributed to the Fund’s performance relative to its benchmark.Sector allocation
| An overweight to the CCRC sector and underweights to the state general obligation (GO) and industrial development revenue/pollution control revenue (IDR/PCR) sectors added to the Fund’s relative performance.Credit quality allocation
| An underweight to AA rated bonds added modestly to relative performance.Top Performance Detractors
Sector security selection
Yield curve positioning
| The Fund’s interest rate positioning detracted from performance. Specifically, the Fund’s overweight to longer maturity bonds (20 years and longer) detracted from performance relative to the benchmark, as municipal market interest rates rose in this portion of the curve.Sector allocation
| While sector allocation was broadly positive, an underweight to tobacco bonds was a modest detractor.Credit quality allocation
| An overweight to bonds rated BBB detracted from relative performance.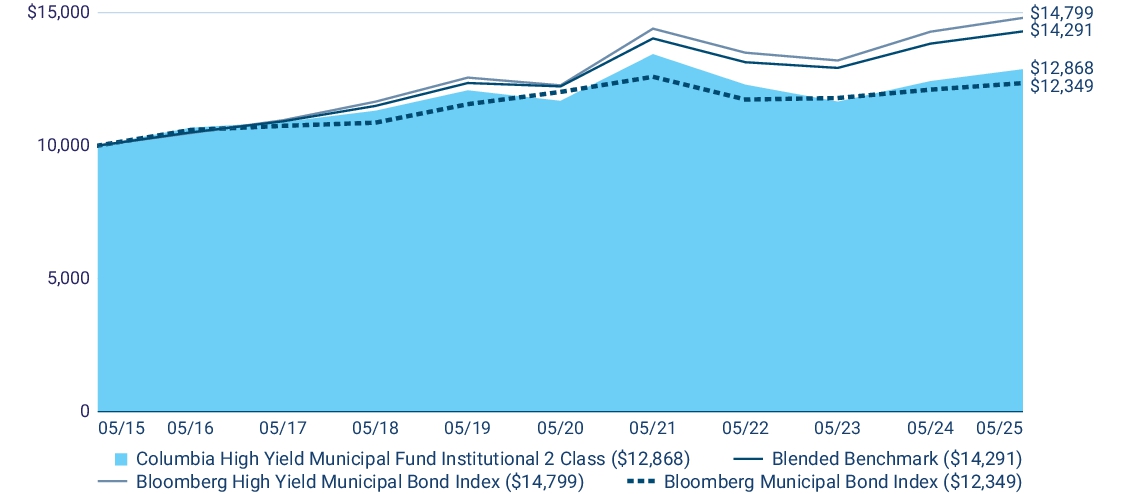
| Average Annual Total Returns (%) | 1 year | 5 years | 10 years |
| Institutional 2 Class (a) | 3.60 | 1.96 | 2.55 |
| Blended Benchmark - 80% Bloomberg High Yield Municipal Bond Index, 20% Bloomberg Municipal Bond Index | 3.32 | 3.17 | 3.63 |
| Bloomberg High Yield Municipal Bond Index | 3.64 | 3.83 | 4.00 |
| Bloomberg Municipal Bond Index | 2.03 | 0.55 | 2.13 |
(a) | The Fund’s performance prior to November 2021 reflects returns achieved by the Investment Manager according to different principal investment strategies. If the Fund’s current management and strategies had been in place for the prior periods, results shown may have been different. |
columbiathreadneedleus.com/investment-products/mutual-funds
for more recent performance information.
Key Fund Statistics
Fund net assets | $ 457,349,806 |
Total number of portfolio holdings | 276 |
Management services fees (represents 0.54% of Fund average net assets) | $ 2,671,658 |
Portfolio turnover for the reporting period | 32% |
Graphical Representation of Fund Holdings
The tables below show the investment makeup of the Fund represented as a percentage of Fund net assets. Derivatives are excluded from the tables unless otherwise noted. The Fund's portfolio composition is subject to change.
Bond ratings on Fund holdings are divided into categories ranging from highest to lowest credit quality, determined by using the middle rating of Moody’s Ratings, S&P and Fitch, after dropping the highest and lowest available ratings. When ratings are available from only two rating agencies, the lower rating is used. When a rating is available from only one rating agency, that rating is used. If a security is not rated by Moody's Ratings, S&P or Fitch, but has a rating by Kroll and/or DBRS, the same methodology is applied to those bonds that would otherwise be not rated. When a bond is not rated by any rating agency, it is designated as “Not rated.” Credit quality ratings assigned by a rating agency are subjective opinions, not statements of fact, and are subject to change, including daily.
Top States/Territories
| Wisconsin | 9.9 % |
| Colorado | 8.6 % |
| Florida | 7.8 % |
| Texas | 7.3 % |
| Illinois | 7.2 % |
| Puerto Rico | 6.6 % |
| California | 5.9 % |
| New York | 4.6 % |
| New Hampshire | 3.9 % |
| Ohio | 3.8 % |
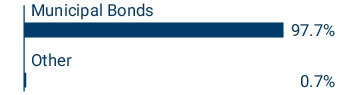
Asset Categories

Credit Quality

Top States/Territories
| Wisconsin | 9.9 % |
| Colorado | 8.6 % |
| Florida | 7.8 % |
| Texas | 7.3 % |
| Illinois | 7.2 % |
| Puerto Rico | 6.6 % |
| California | 5.9 % |
| New York | 4.6 % |
| New Hampshire | 3.9 % |
| Ohio | 3.8 % |
columbiathreadneedleus.com/resources/literature
. You can also request more information by contacting us at 1-800-345-6611.
What were the Fund costs for the reporting period?
(Based on a hypothetical $10,000 investment)
| Class | Cost of a $10,000 investment | Cost paid as a percentage of a $10,000 investment |
| Institutional 3 Class | $ 56 | 0.55 % |
Management's Discussion of Fund Performance
The performance of Institutional 3 Class shares for the period presented is shown in the Average Annual Total Returns table.
Top Performance Contributors
Credit quality security selection
| Positive contribution to benchmark-relative performance was driven by security selection in nonrated bonds and bonds rated BBB.Sector security selection
| Strong sector security selection, particularly in utilities, special tax, tobacco and continuing care retirement communities (CCRC) bonds contributed to the Fund’s performance relative to its benchmark.Sector allocation
| An overweight to the CCRC sector and underweights to the state general obligation (GO) and industrial development revenue/pollution control revenue (IDR/PCR) sectors added to the Fund’s relative performance.Credit quality allocation
| An underweight to AA rated bonds added modestly to relative performance.Top Performance Detractors
Sector security selection
Yield curve positioning
| The Fund’s interest rate positioning detracted from performance. Specifically, the Fund’s overweight to longer maturity bonds (20 years and longer) detracted from performance relative to the benchmark, as municipal market interest rates rose in this portion of the curve.Sector allocation
| While sector allocation was broadly positive, an underweight to tobacco bonds was a modest detractor.Credit quality allocation
| An overweight to bonds rated BBB detracted from relative performance.
| Average Annual Total Returns (%) | 1 year | 5 years | 10 years |
| Institutional 3 Class (a),(b) | 3.65 | 2.02 | 2.58 |
| Blended Benchmark - 80% Bloomberg High Yield Municipal Bond Index, 20% Bloomberg Municipal Bond Index | 3.32 | 3.17 | 3.63 |
| Bloomberg High Yield Municipal Bond Index | 3.64 | 3.83 | 4.00 |
| Bloomberg Municipal Bond Index | 2.03 | 0.55 | 2.13 |
(a) | The returns shown for periods prior to March 1, 2017 (including Since Fund Inception returns, if shown) include the re tu rns of Institutional Class. These returns are adjusted to reflect any higher class-related operating expenses of the newer share classes, as applicable. Please visit columbiathreadneedleus.com/investment-products/mutual-funds/appended-performance for more information. |
(b) | The Fund’s performance prior to November 2021 reflects returns achieved by the Investment Manager according to different principal investment strategies. If the Fund’s current management and strategies had been in place for the prior periods, results shown may have been different. |
columbiathreadneedleus.com/investment-products/mutual-funds
for more recent performance information.
Key Fund Statistics
Fund net assets | $ 457,349,806 |
Total number of portfolio holdings | 276 |
Management services fees (represents 0.54% of Fund average net assets) | $ 2,671,658 |
Portfolio turnover for the reporting period | 32% |
Graphical Representation of Fund Holdings
The tables below show the investment makeup of the Fund represented as a percentage of Fund net assets. Derivatives are excluded from the tables unless otherwise noted. The Fund's portfolio composition is subject to change.
Bond ratings on Fund holdings are divided into categories ranging from highest to lowest credit quality, determined by using the middle rating of Moody’s Ratings, S&P and Fitch, after dropping the highest and lowest available ratings. When ratings are available from only two rating agencies, the lower rating is used. When a rating is available from only one rating agency, that rating is used. If a security is not rated by Moody's Ratings, S&P or Fitch, but has a rating by Kroll and/or DBRS, the same methodology is applied to those bonds that would otherwise be not rated. When a bond is not rated by any rating agency, it is designated as “Not rated.” Credit quality ratings assigned by a rating agency are subjective opinions, not statements of fact, and are subject to change, including daily.
Top States/Territories
| Wisconsin | 9.9 % |
| Colorado | 8.6 % |
| Florida | 7.8 % |
| Texas | 7.3 % |
| Illinois | 7.2 % |
| Puerto Rico | 6.6 % |
| California | 5.9 % |
| New York | 4.6 % |
| New Hampshire | 3.9 % |
| Ohio | 3.8 % |
Asset Categories

Credit Quality

Top States/Territories
| Wisconsin | 9.9 % |
| Colorado | 8.6 % |
| Florida | 7.8 % |
| Texas | 7.3 % |
| Illinois | 7.2 % |
| Puerto Rico | 6.6 % |
| California | 5.9 % |
| New York | 4.6 % |
| New Hampshire | 3.9 % |
| Ohio | 3.8 % |
columbiathreadneedleus.com/resources/literature
. You can also request more information by contacting us at 1-800-345-6611.
What were the Fund costs for the reporting period?
(Based on a hypothetical $10,000 investment)
| Class | Cost of a $10,000 investment | Cost paid as a percentage of a $10,000 investment |
| Class S | $ 40(a) | 0.62 % (b) |
| (a) | Based on operations from October 2, 2024 (commencement of operations) through the stated period end. Had the class been open for the entire reporting period, expenses shown in the table above would have been higher. |
| (b) | Annualized. |
Management's Discussion of Fund Performance
The performance of Class S shares for the period presented is shown in the Average Annual Total Returns table.
Top Performance Contributors
Credit quality security selection
| Positive contribution to benchmark-relative performance was driven by security selection in nonrated bonds and bonds rated BBB.Sector security selection
| Strong sector security selection, particularly in utilities, special tax, tobacco and continuing care retirement communities (CCRC) bonds contributed to the Fund’s performance relative to its benchmark.Sector allocation
| An overweight to the CCRC sector and underweights to the state general obligation (GO) and industrial development revenue/pollution control revenue (IDR/PCR) sectors added to the Fund’s relative performance.Credit quality allocation
| An underweight to AA rated bonds added modestly to relative performance.Top Performance Detractors
Sector security selection
Yield curve positioning
| The Fund’s interest rate positioning detracted from performance. Specifically, the Fund’s overweight to longer maturity bonds (20 years and longer) detracted from performance relative to the benchmark, as municipal market interest rates rose in this portion of the curve.Sector allocation
| While sector allocation was broadly positive, an underweight to tobacco bonds was a modest detractor.Credit quality allocation
| An overweight to bonds rated BBB detracted from relative performance.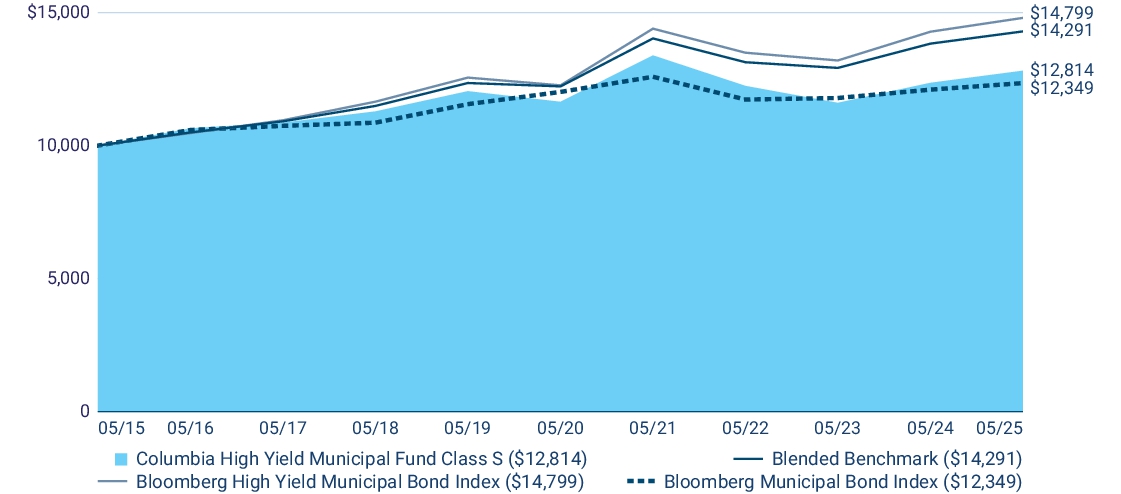
| Average Annual Total Returns (%) | 1 year | 5 years | 10 years |
| Class S (a),(b) | 3.68 | 1.93 | 2.51 |
| Blended Benchmark - 80% Bloomberg High Yield Municipal Bond Index, 20% Bloomberg Municipal Bond Index | 3.32 | 3.17 | 3.63 |
| Bloomberg High Yield Municipal Bond Index | 3.64 | 3.83 | 4.00 |
| Bloomberg Municipal Bond Index | 2.03 | 0.55 | 2.13 |
(a) | The returns shown for periods prior to October 2, 2024 (including Since Fund Inception returns, if shown) include the returns of Institutional Class. These returns are adjusted to reflect any higher class-related operating expenses of the newer share classes, as applicable. Please visit columbiathreadneedleus.com/investment-products/mutual-funds/appended-performance for more information. |
(b) | The Fund’s performance prior to November 2021 reflects returns achieved by the Investment Manager according to different principal investment strategies. If the Fund’s current management and strategies had been in place for the prior periods, results shown may have been different. |
columbiathreadneedleus.com/investment-products/mutual-funds
for more recent performance information.
Key Fund Statistics
Fund net assets | $ 457,349,806 |
Total number of portfolio holdings | 276 |
Management services fees (represents 0.54% of Fund average net assets) | $ 2,671,658 |
Portfolio turnover for the reporting period | 32% |
Graphical Representation of Fund Holdings
The tables below show the investment makeup of the Fund represented as a percentage of Fund net assets. Derivatives are excluded from the tables unless otherwise noted. The Fund's portfolio composition is subject to change.
Bond ratings on Fund holdings are divided into categories ranging from highest to lowest credit quality, determined by using the middle rating of Moody’s Ratings, S&P and Fitch, after dropping the highest and lowest available ratings. When ratings are available from only two rating agencies, the lower rating is used. When a rating is available from only one rating agency, that rating is used. If a security is not rated by Moody's Ratings, S&P or Fitch, but has a rating by Kroll and/or DBRS, the same methodology is applied to those bonds that would otherwise be not rated. When a bond is not rated by any rating agency, it is designated as “Not rated.” Credit quality ratings assigned by a rating agency are subjective opinions, not statements of fact, and are subject to change, including daily.
Top States/Territories
| Wisconsin | 9.9 % |
| Colorado | 8.6 % |
| Florida | 7.8 % |
| Texas | 7.3 % |
| Illinois | 7.2 % |
| Puerto Rico | 6.6 % |
| California | 5.9 % |
| New York | 4.6 % |
| New Hampshire | 3.9 % |
| Ohio | 3.8 % |
Asset Categories

Credit Quality

Top States/Territories
| Wisconsin | 9.9 % |
| Colorado | 8.6 % |
| Florida | 7.8 % |
| Texas | 7.3 % |
| Illinois | 7.2 % |
| Puerto Rico | 6.6 % |
| California | 5.9 % |
| New York | 4.6 % |
| New Hampshire | 3.9 % |
| Ohio | 3.8 % |
| [1] | Based on operations from October 2, 2024 (commencement of operations) through the stated period end. Had the class been open for the entire reporting period, expenses shown in the table above would have been higher. |
| [2] | Annualized. |