Shareholder Report
May 31, 2025
USD ($)
HOLDING
columbiathreadneedleus.com/resources/literature
. You can also request more information by contacting us at 1-800-345-6611.
What were the Fund costs for the reporting period?
(Based on a hypothetical $10,000 investment)
| Class | Cost of a $10,000 investment | Cost paid as a percentage of a $10,000 investment |
| Class A | $ 95 | 0.90 % |
Management's Discussion of Fund Performance
The performance of Class A shares for the period presented is shown in the Average Annual Total Returns table.
Top Performance Contributors
Stock selection
| Selections in the utilities and information technology sectors boosted the Fund’s relative results most during the annual period.Allocation
| Overweight positions in the financials sector buoyed relative Fund results during the annual period.Individual holdings
| Positions in Walmart, Inc., a retail and wholesale business company, JPMorgan Chase & Co., a financial services and investment banking company, and AT&T, Inc., a telecommunications and technology services company, were among the top contributors to Fund relative performance.Top Performance Detractors
Stock selection
Allocation
| Overweight positions in the energy sector detracted from relative performance.Individual holdings
| Positions in UnitedHealth Group, Inc., a health care coverage company, Merck & Co., Inc., a health care company, and Elevance Health, Inc., a health care company, were among the top detractors to relative performance during the period.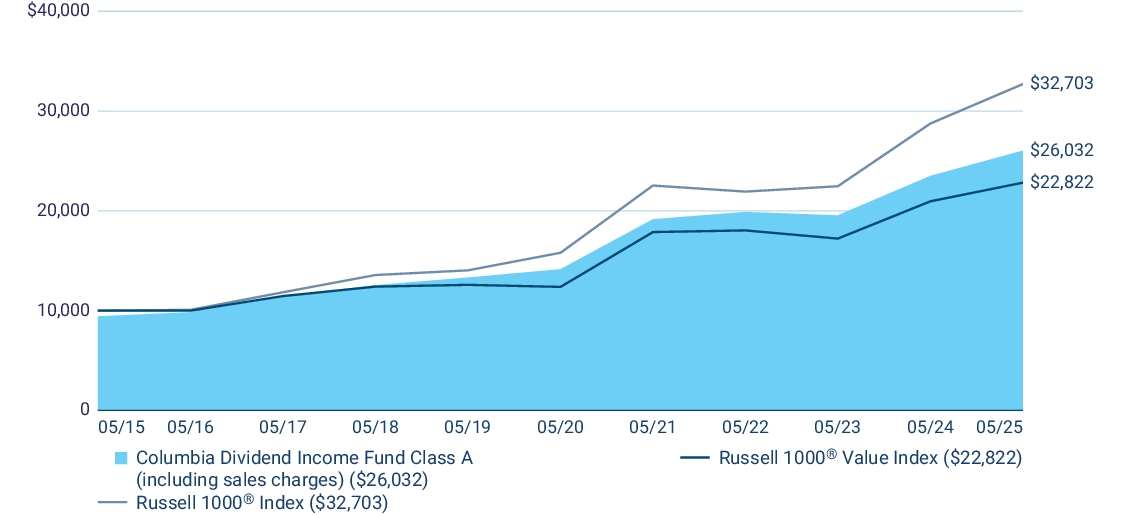
| Average Annual Total Returns (%) | 1 year | 5 years | 10 years |
| Class A (excluding sales charges) | 10.77 | 12.97 | 10.69 |
| Class A (including sales charges) | 4.41 | 11.64 | 10.04 |
| Russell 1000 ® Value Index | 8.91 | 13.02 | 8.60 |
| Russell 1000 ® Index | 13.73 | 15.66 | 12.58 |
columbiathreadneedleus.com/investment-products/mutual-funds
for more recent performance information.
Key Fund Statistics
Fund net assets | $ 42,030,993,236 |
Total number of portfolio holdings | 80 |
Management services fees (represents 0.53% of Fund average net assets) | $ 218,407,193 |
Portfolio turnover for the reporting period | 16% |
Graphical Representation of Fund Holdings
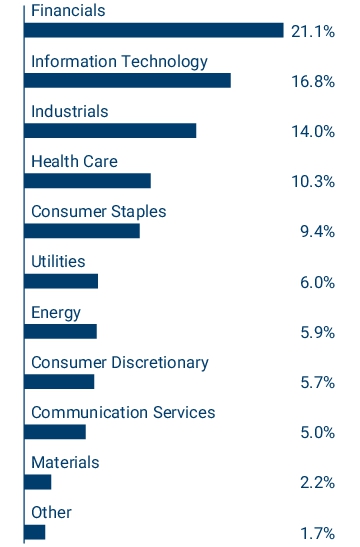
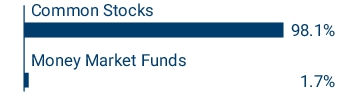
The tables below show the investment makeup of the Fund represented as a percentage of Fund net assets. Derivatives are excluded from the tables unless otherwise noted. The Fund's portfolio composition is subject to change.
Top Holdings
| JPMorgan Chase & Co. | 4.4 % |
| Microsoft Corp. | 3.3 % |
| Walmart, Inc. | 2.9 % |
| Johnson & Johnson | 2.5 % |
| Exxon Mobil Corp. | 2.5 % |
| Procter & Gamble Co. (The) | 2.4 % |
| Broadcom, Inc. | 2.4 % |
| Home Depot, Inc. (The) | 2.2 % |
| Cisco Systems, Inc. | 2.2 % |
| Chubb Ltd. | 2.0 % |
Asset Categories

Equity Sector Allocation

Top Holdings
| JPMorgan Chase & Co. | 4.4 % |
| Microsoft Corp. | 3.3 % |
| Walmart, Inc. | 2.9 % |
| Johnson & Johnson | 2.5 % |
| Exxon Mobil Corp. | 2.5 % |
| Procter & Gamble Co. (The) | 2.4 % |
| Broadcom, Inc. | 2.4 % |
| Home Depot, Inc. (The) | 2.2 % |
| Cisco Systems, Inc. | 2.2 % |
| Chubb Ltd. | 2.0 % |
columbiathreadneedleus.com/resources/literature
. You can also request more information by contacting us at 1-800-345-6611.
What were the Fund costs for the reporting period?
(Based on a hypothetical $10,000 investment)
| Class | Cost of a $10,000 investment | Cost paid as a percentage of a $10,000 investment |
| Class C | $ 173 | 1.65 % |
Management's Discussion of Fund Performance
The performance of Class C shares for the period presented is shown in the Average Annual Total Returns table.
Top Performance Contributors
Stock selection
| Selections in the utilities and information technology sectors boosted the Fund’s relative results most during the annual period.Allocation
| Overweight positions in the financials sector buoyed relative Fund results during the annual period.Individual holdings
| Positions in Walmart, Inc., a retail and wholesale business company, JPMorgan Chase & Co., a financial services and investment banking company, and AT&T, Inc., a telecommunications and technology services company, were among the top contributors to Fund relative performance.Top Performance Detractors
Stock selection
Allocation
| Overweight positions in the energy sector detracted from relative performance.Individual holdings
| Positions in UnitedHealth Group, Inc., a health care coverage company, Merck & Co., Inc., a health care company, and Elevance Health, Inc., a health care company, were among the top detractors to relative performance during the period.
| Average Annual Total Returns (%) | 1 year | 5 years | 10 years |
| Class C (excluding sales charges) | 9.93 | 12.13 | 9.86 |
| Class C (including sales charges) | 8.93 | 12.13 | 9.86 |
| Russell 1000 ® Value Index | 8.91 | 13.02 | 8.60 |
| Russell 1000 ® Index | 13.73 | 15.66 | 12.58 |
columbiathreadneedleus.com/investment-products/mutual-funds
for more recent performance information.
Key Fund Statistics
Fund net assets | $ 42,030,993,236 |
Total number of portfolio holdings | 80 |
Management services fees (represents 0.53% of Fund average net assets) | $ 218,407,193 |
Portfolio turnover for the reporting period | 16% |
Graphical Representation of Fund Holdings
The tables below show the investment makeup of the Fund repres
e
nted as a percentage of Fund net assets. Derivatives are excluded from the tables unless otherwise noted. The Fund's portfolio composition is subject to change.Top Holdings
| JPMorgan Chase & Co. | 4.4 % |
| Microsoft Corp. | 3.3 % |
| Walmart, Inc. | 2.9 % |
| Johnson & Johnson | 2.5 % |
| Exxon Mobil Corp. | 2.5 % |
| Procter & Gamble Co. (The) | 2.4 % |
| Broadcom, Inc. | 2.4 % |
| Home D ep ot, Inc. (The) | 2.2 % |
| Cisco Systems, Inc. | 2.2 % |
| Chubb Ltd. | 2.0 % |
Asset Categories

Equity Sector Allocation

Top Holdings
| JPMorgan Chase & Co. | 4.4 % |
| Microsoft Corp. | 3.3 % |
| Walmart, Inc. | 2.9 % |
| Johnson & Johnson | 2.5 % |
| Exxon Mobil Corp. | 2.5 % |
| Procter & Gamble Co. (The) | 2.4 % |
| Broadcom, Inc. | 2.4 % |
| Home D ep ot, Inc. (The) | 2.2 % |
| Cisco Systems, Inc. | 2.2 % |
| Chubb Ltd. | 2.0 % |
columbiathreadneedleus.com/resources/literature
. You can also request more information by contacting us at 1-800-345-6611.
What were the Fund costs for the reporting period?
(Based on a hypothetical $10,000 investment)
| Class | Cost of a $10,000 investment | Cost paid as a percentage of a $10,000 investment |
| Institutional Class | $ 68 | 0.65 % |
Management's Discussion of Fund Performance
The performance of Institutional Class shares for the period presented is shown in the Average Annual Total Returns table.
Top Performance Contributors
Stock selection
| Selections in the utilities and information technology sectors boosted the Fund’s relative results most during the annual period.Allocation
| Overweight positions in the financials sector buoyed relative Fund results during the annual period.Individual holdings
| Positions in Walmart, Inc., a retail and wholesale business company, JPMorgan Chase & Co., a financial services and investment banking company, and AT&T, Inc., a telecommunications and technology services company, were among the top contributors to Fund relative performance.Top Performance Detractors
Stock selection
Allocation
| Overweight positions in the energy sector detracted from relative performance.Individual holdings
| Positions in UnitedHealth Group, Inc., a health care coverage company, Merck & Co., Inc., a health care company, and Elevance Health, Inc., a health care company, were among the top detractors to relative performance during the period.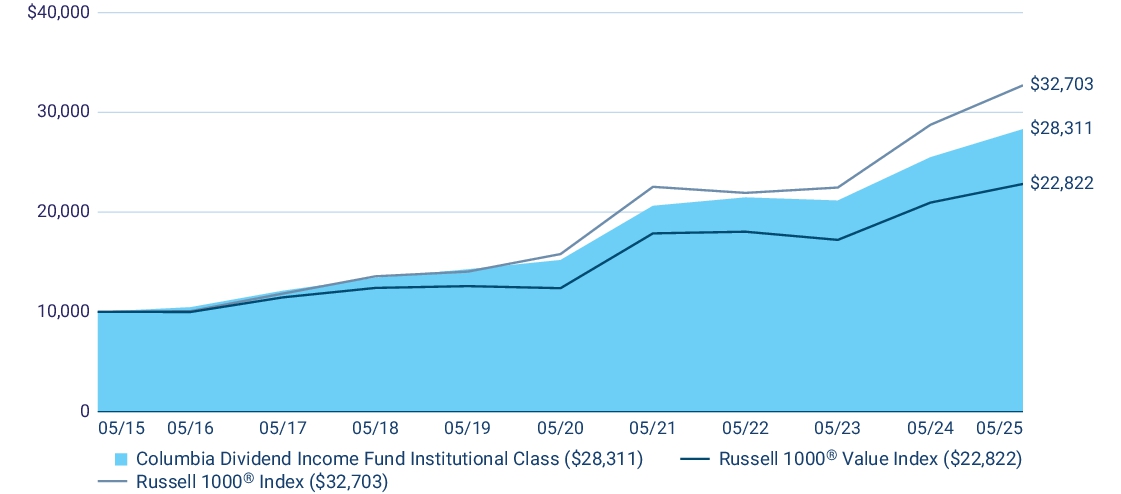
| Average Annual Total Returns (%) | 1 year | 5 years | 10 years |
| Institutional Class | 11.03 | 13.25 | 10.97 |
| Russell 1000 ® Value Index | 8.91 | 13.02 | 8.60 |
| Russell 1000 ® Index | 13.73 | 15.66 | 12.58 |
columbiathreadneedleus.com/investment-products/mutual-funds
for more recent performance information.
Key Fund Statistics
Fund net assets | $ 42,030,993,236 |
Total number of portfolio holdings | 80 |
Management services fees (represents 0.53% of Fund average net assets) | $ 218,407,193 |
Portfolio turnover for the reporting period | 16% |
Graphical Representation of Fund Holdings
The tables below show the investment makeup of the Fund represented as a percentage of Fund net assets. Derivatives are excluded from the tables unless otherwise noted. The Fund's portfolio composition is subject to change.
Top Holdings
| JPMorgan Chase & Co. | 4.4 % |
| Microsoft Corp. | 3.3 % |
| Walmart, Inc. | 2.9 % |
| Johnson & Johnson | 2.5 % |
| Exxon Mobil Corp. | 2.5 % |
| Procter & Gamble Co. (The) | 2.4 % |
| Broadcom, Inc. | 2.4 % |
| Home Depot, Inc. (The) | 2.2 % |
| Cisco Systems, Inc. | 2.2 % |
| Chubb Ltd. | 2.0 % |
Asset Categories

Equity Sector Allocation
Top Holdings
| JPMorgan Chase & Co. | 4.4 % |
| Microsoft Corp. | 3.3 % |
| Walmart, Inc. | 2.9 % |
| Johnson & Johnson | 2.5 % |
| Exxon Mobil Corp. | 2.5 % |
| Procter & Gamble Co. (The) | 2.4 % |
| Broadcom, Inc. | 2.4 % |
| Home Depot, Inc. (The) | 2.2 % |
| Cisco Systems, Inc. | 2.2 % |
| Chubb Ltd. | 2.0 % |
columbiathreadneedleus.com/resources/literature
. You can also request more information by contacting us at 1-800-345-6611.
What were the Fund costs for the reporting period?
(Based on a hypothetical $10,000 investment)
| Class | Cost of a $10,000 investment | Cost paid as a percentage of a $10,000 investment |
| Institutional 2 Class | $ 62 | 0.59 % |
Management's Discussion of Fund Performance
The performance of Institutional 2 Class shares for the period presented is shown in the Average Annual Total Returns table.
Top Performance Contributors
Stock selection
| Selections in the utilities and information technology sectors boosted the Fund’s relative results most during the annual period.Allocation
| Overweight positions in the financials sector buoyed relative Fund results during the annual period.Individual holdings
| Positions in Walmart, Inc., a retail and wholesale business company, JPMorgan Chase & Co., a financial services and investment banking company, and AT&T, Inc., a telecommunications and technology services company, were among the top contributors to Fund relative performance.Top Performance Detractors
Stock selection
Allocation
| Overweight positions in the energy sector detracted from relative performance.Individual holdings
| Positions in UnitedHealth Group, Inc., a health care coverage company, Merck & Co., Inc., a health care company, and Elevance Health, Inc., a health care company, were among the top detractors to relative performance during the period.
| Average Annual Total Returns (%) | 1 year | 5 years | 10 years |
| Institutional 2 Class | 11.10 | 13.32 | 11.06 |
| Russell 1000 ® Value Index | 8.91 | 13.02 | 8.60 |
| Russell 1000 ® Index | 13.73 | 15.66 | 12.58 |
columbiathreadneedleus.com/investment-products/mutual-funds
for more recent performance information.
Key Fund Statistics
Fund net assets | $ 42,030,993,236 |
Total number of portfolio holdings | 80 |
Management services fees (represents 0.53% of Fund average net assets) | $ 218,407,193 |
Portfolio turnover for the reporting period | 16% |
Graphical Representation of Fund Holdings
The tables below show the investment makeup of the Fund represented as a percentage of Fund net assets. Derivatives are excluded from the tables unless otherwise noted. The Fund's portfolio composition is subject to change.
Top Holdings
| JPMorgan Chase & Co. | 4.4 % |
| Microsoft Corp. | 3.3 % |
| Walmart, Inc. | 2.9 % |
| Johnson & Johnson | 2.5 % |
| Exxon Mobil Corp. | 2.5 % |
| Procter & Gamble Co. (The) | 2.4 % |
| Broadcom, Inc. | 2.4 % |
| Home Depot, Inc. (The) | 2.2 % |
| Cisco Systems, Inc. | 2.2 % |
| Chubb Ltd. | 2.0 % |
Asset Categories
Equity Sector Allocation

Top Holdings
| JPMorgan Chase & Co. | 4.4 % |
| Microsoft Corp. | 3.3 % |
| Walmart, Inc. | 2.9 % |
| Johnson & Johnson | 2.5 % |
| Exxon Mobil Corp. | 2.5 % |
| Procter & Gamble Co. (The) | 2.4 % |
| Broadcom, Inc. | 2.4 % |
| Home Depot, Inc. (The) | 2.2 % |
| Cisco Systems, Inc. | 2.2 % |
| Chubb Ltd. | 2.0 % |
columbiathreadneedleus.com/resources/literature
. You can also request more information by contacting us at 1-800-345-6611.
What were the Fund costs for the reporting period?
(Based on a hypothetical $10,000 investment)
| Class | Cost of a $10,000 investment | Cost paid as a percentage of a $10,000 investment |
| Institutional 3 Class | $ 57 | 0.54 % |
Management's Discussion of Fund Performance
The performance of Institutional 3 Class shares for the period presented is shown in the Average Annual Total Returns table.
Top Performance Contributors
Stock selection
| Selections in the utilities and information technology sectors boosted the Fund’s relative results most during the annual period.Allocation
| Overweight positions in the financials sector buoyed relative Fund results during the annual period.Individual holdings
| Positions in Walmart, Inc., a retail and wholesale business company, JPMorgan Chase & Co., a financial services and investment banking company, and AT&T, Inc., a telecommunications and technology services company, were among the top contributors to Fund relative performance.Top Performance Detractors
Stock selection
Allocation
| Overweight positions in the energy sector detracted from relative performance.Individual holdings
| Positions in UnitedHealth Group, Inc., a health care coverage company, Merck & Co., Inc., a health care company, and Elevance Health, Inc., a health care company, were among the top detractors to relative performance during the period.
| Average Annual Total Returns (%) | 1 year | 5 years | 10 years |
| Institutional 3 Class | 11.16 | 13.38 | 11.12 |
| Russell 1000 ® Value Index | 8.91 | 13.02 | 8.60 |
| Russell 1000 ® Index | 13.73 | 15.66 | 12.58 |
columbiathreadneedleus.com/investment-products/mutual-funds
for more recent performance information.
Key Fund Statistics
Fund net assets | $ 42,030,993,236 |
Total number of portfolio holdings | 80 |
Management services fees (represents 0.53% of Fund average net assets) | $ 218,407,193 |
Portfolio turnover for the reporting period | 16% |
Graphical Representation of Fund Holdings
The tables below show the investment makeup of the Fund represented as a percentage of Fund net assets. Derivatives are excluded from the tables unless otherwise noted. The Fund's portfolio composition is subject to change.
Top Holdings
| JPMorgan Chase & Co. | 4.4 % |
| Microsoft Corp. | 3.3 % |
| Walmart, Inc. | 2.9 % |
| Johnson & Johnson | 2.5 % |
| Exxon Mobil Corp. | 2.5 % |
| Procter & Gamble Co. (The) | 2.4 % |
| Broadcom, Inc. | 2.4 % |
| Home Depot, Inc. (The) | 2.2 % |
| Cisco Systems, Inc. | 2.2 % |
| Chubb Ltd. | 2.0 % |
Asset Categories

Equity Sector Allocation

Top Holdings
| JPMorgan Chase & Co. | 4.4 % |
| Microsoft Corp. | 3.3 % |
| Walmart, Inc. | 2.9 % |
| Johnson & Johnson | 2.5 % |
| Exxon Mobil Corp. | 2.5 % |
| Procter & Gamble Co. (The) | 2.4 % |
| Broadcom, Inc. | 2.4 % |
| Home Depot, Inc. (The) | 2.2 % |
| Cisco Systems, Inc. | 2.2 % |
| Chubb Ltd. | 2.0 % |
columbiathreadneedleus.com/resources/literature
. You can also request more information by contacting us at 1-800-345-6611.
What were the Fund costs for the reporting period?
(Based on a hypothetical $10,000 investment)
| Class | Cost of a $10,000 investment | Cost paid as a percentage of a $10,000 investment |
| Class R | $ 121 | 1.15 % |
Management's Discussion of Fund Performance
The performance of Class R shares for the period presented is shown in the Average Annual Total Returns table.
Top Performance Contributors
Stock selection
| Selections in the utilities and information technology sectors boosted the Fund’s relative results most during the annual period.Allocation
| Overweight positions in the financials sector buoyed relative Fund results during the annual period.Individual holdings
| Positions in Walmart, Inc., a retail and wholesale business company, JPMorgan Chase & Co., a financial services and investment banking company, and AT&T, Inc., a telecommunications and technology services company, were among the top contributors to Fund relative performance.Top Performance Detractors
Stock selection
Allocation
| Overweight positions in the energy sector detracted from relative performance.Individual holdings
| Positions in UnitedHealth Group, Inc., a health care coverage company, Merck & Co., Inc., a health care company, and Elevance Health, Inc., a health care company, were among the top detractors to relative performance during the period.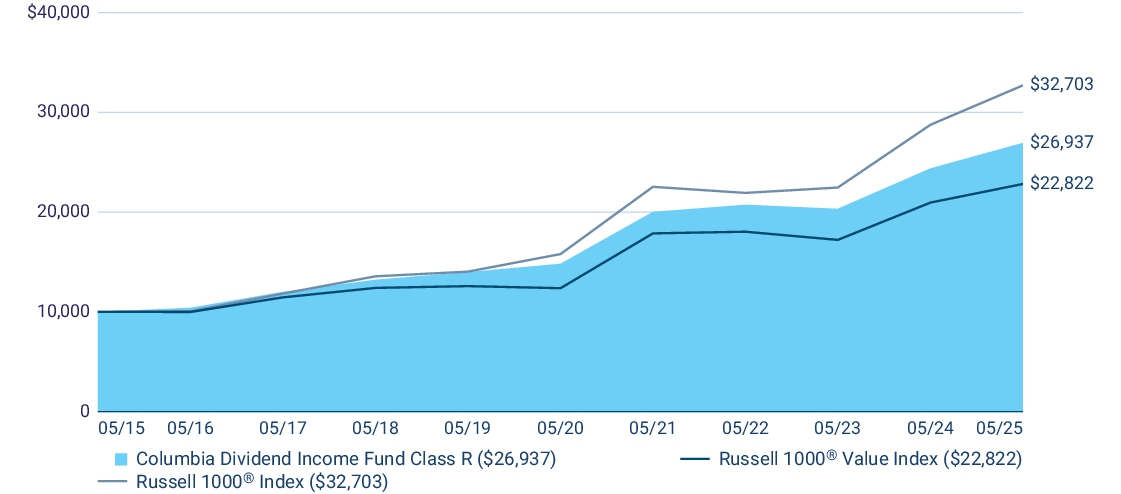
| Average Annual Total Returns (%) | 1 year | 5 years | 10 years |
| Class R | 10.48 | 12.69 | 10.42 |
| Russell 1000 ® Value Index | 8.91 | 13.02 | 8.60 |
| Russell 1000 ® Index | 13.73 | 15.66 | 12.58 |
columbiathreadneedleus.com/investment-products/mutual-funds
for more recent performance information.
Key Fund Statistics
Fund net assets | $ 42,030,993,236 |
Total number of portfolio holdings | 80 |
Management services fees (represents 0.53% of Fund average net assets) | $ 218,407,193 |
Portfolio turnover for the reporting period | 16% |
Graphical Representation of Fund Holdings
The tables below show the investment makeup of the Fund represented as a percentage of Fund net assets. Derivatives are excluded from the tables unless otherwise noted. The Fund's portfolio composition is subject to change.
Top Holdings
| JPMorgan Chase & Co. | 4.4 % |
| Microsoft Corp. | 3.3 % |
| Walmart, Inc. | 2.9 % |
| Johnson & Johnson | 2.5 % |
| Exxon Mobil Corp. | 2.5 % |
| Procter & Gamble Co. (The) | 2.4 % |
| Broadcom, Inc. | 2.4 % |
| Home Depot, Inc. (The) | 2.2 % |
| Cisco Systems, Inc. | 2.2 % |
| Chubb Ltd. | 2.0 % |
Asset Categories

Equity Sector Allocation

Top Holdings
| JPMorgan Chase & Co. | 4.4 % |
| Microsoft Corp. | 3.3 % |
| Walmart, Inc. | 2.9 % |
| Johnson & Johnson | 2.5 % |
| Exxon Mobil Corp. | 2.5 % |
| Procter & Gamble Co. (The) | 2.4 % |
| Broadcom, Inc. | 2.4 % |
| Home Depot, Inc. (The) | 2.2 % |
| Cisco Systems, Inc. | 2.2 % |
| Chubb Ltd. | 2.0 % |
columbiathreadneedleus.com/resources/literature
. You can also request more informa
tion by contacting us at 1-800-345-6611.
What were the Fund costs for the reporting period?
(Based on a hypothetical $10,000 investment)
| Class | Cost of a $10,000 investment | Cost paid as a percentage of a $10,000 investment |
| Class S | $ 44(a) | 0.66 % (b) |
| (a) | Based on operations from October 2, 2024 (commencement of operations) through the stated period end. Had the class been open for the entire reporting period, expenses shown in the table above would have been higher. |
| (b) | Annualized. |
Management's Discussion of Fund Performance
The performance of Class S shares for the period presented is shown in the Average Annual Total Returns table.
Top Performance Contributors
Stock selection
| Selections in the utilities and information technology sectors boosted the Fund’s relative results most during the annual period.Allocation
| Overweight positions in the financials sector buoyed relative Fund results during the annual period.Individual holdings
| Positions in Walmart, Inc., a retail and wholesale business company, JPMorgan Chase & Co., a financial services and investment banking company, and AT&T, Inc., a telecommunications and technology services company, were among the top contributors to Fund relative performance.Top Performance Detractors
Stock selection
Allocation
| Overweight positions in the energy sector detracted from relative performance.Individual holdings
| Positions in UnitedHealth Group, Inc., a health care coverage company, Merck & Co., Inc., a health care company, and Elevance Health, Inc., a health care company, were among the top detractors to relative performance during the period.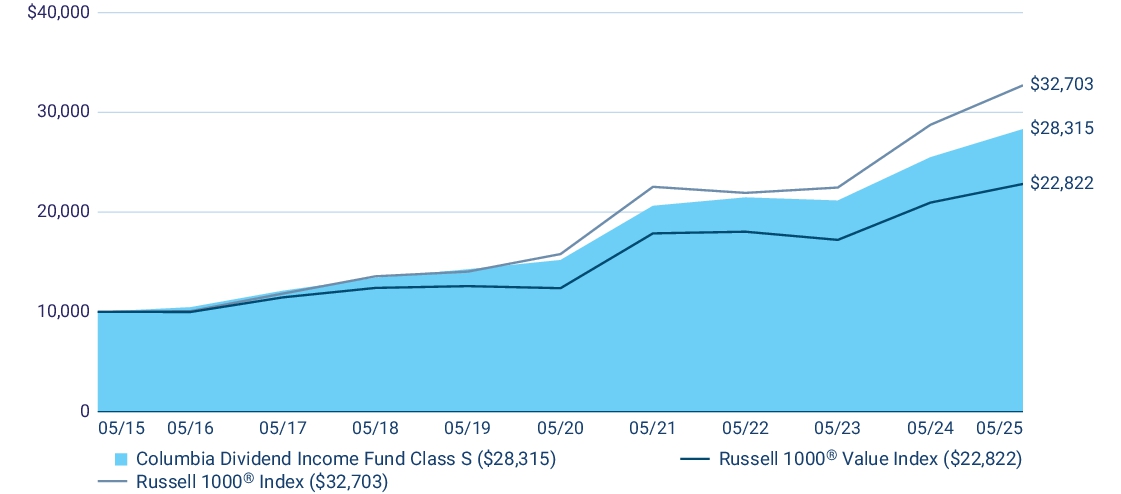
| Average Annual Total Returns (%) | 1 year | 5 years | 10 years |
| Class S (a) | 11.05 | 13.26 | 10.97 |
| Russell 1000 ® Value Index | 8.91 | 13.02 | 8.60 |
| Russell 1000 ® Index | 13.73 | 15.66 | 12.58 |
(a) | The returns shown for periods prior to October 2, 2024 (including Since Fund Inception returns, if shown) include the returns of Institutional Class. These returns are adjusted to reflect any higher class-related operating expenses of the newer share classes, as applicable. Please visit columbiathreadneedleus.com/investment-products/mutual-funds/appended-performance for more information. |
columbiathreadneedleus.com/investment-products/mutual-funds/appended-performance
for more information.
columbiathreadneedleus.com/investment-products/mutual-funds
for more recent performance information.
Key Fund Statistics
Fund net assets | $ 42,030,993,236 |
Total number of portfolio holdings | 80 |
Management services fees (represents 0.53% of Fund average net assets) | $ 218,407,193 |
Portfolio turnover for the reporting period | 16% |
Graphical Representation of Fund Holdings
The tables below show the investment makeup of the Fund represented as a percentage of Fund net assets. Derivatives are excluded from the tables unless otherwise noted. The Fund's portfolio composition is subject to change.
Top Holdings
| JPMorgan Chase & Co. | 4.4 % |
| Microsoft Corp. | 3.3 % |
| Walmart, Inc. | 2.9 % |
| Johnson & Johnson | 2.5 % |
| Exxon Mobil Corp. | 2.5 % |
| Procter & Gamble Co. (The) | 2.4 % |
| Broadcom, Inc. | 2.4 % |
| Home Depot, Inc. (The) | 2.2 % |
| Cisco Systems, Inc. | 2.2 % |
| Chubb Ltd. | 2.0 % |
Asset Categories

Equity Sector Allocation

Top Holdings
| JPMorgan Chase & Co. | 4.4 % |
| Microsoft Corp. | 3.3 % |
| Walmart, Inc. | 2.9 % |
| Johnson & Johnson | 2.5 % |
| Exxon Mobil Corp. | 2.5 % |
| Procter & Gamble Co. (The) | 2.4 % |
| Broadcom, Inc. | 2.4 % |
| Home Depot, Inc. (The) | 2.2 % |
| Cisco Systems, Inc. | 2.2 % |
| Chubb Ltd. | 2.0 % |
| [1] | Based on operations from October 2, 2024 (commencement of operations) through the stated period end. Had the class been open for the entire reporting period, expenses shown in the table above would have been higher. |
| [2] | Annualized. |