Pay vs Performance Disclosure - USD ($)
Apr. 30, 2025
Apr. 30, 2024
Apr. 30, 2023
Apr. 30, 2022
PAY VERSUS PEFORMANCE
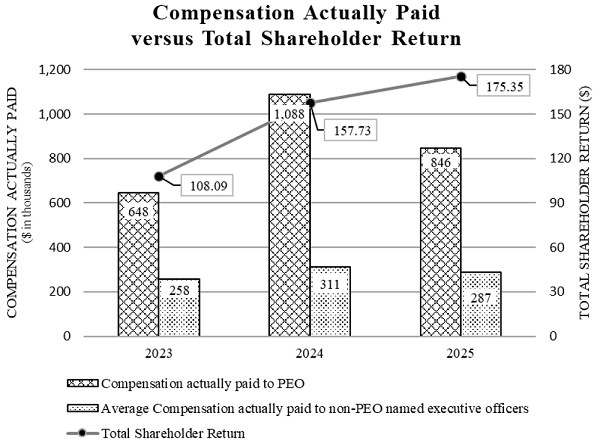
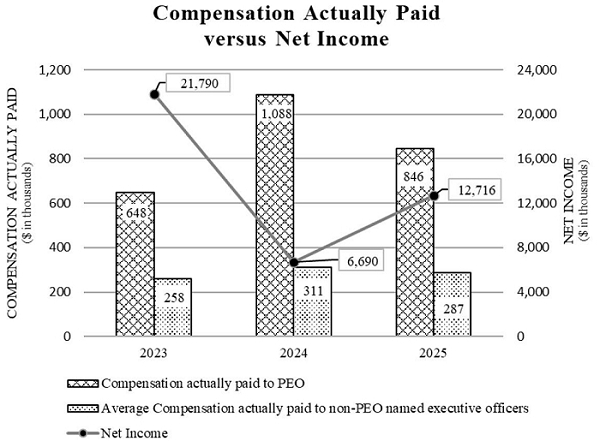
The following table sets forth information regarding the Company’s performance and the “compensation actually paid” to the Company’s named executive officers, as calculated in accordance with Item 402(v) of Regulation S-K.
| Pay Versus Performance | ||||||||||||||||||||||||
| Summary Compensation Table total for PEO(1) | Compensation actually paid to PEO | Average summary compensation table total for non-PEO named executive officers(2) | Average compensation actually paid to non-PEO named executive officers | Value of initial fixed $100 investment based on total shareholder return(3) | Net Income | |||||||||||||||||||
| Year | ($) | ($) | ($) | ($) | ($) | ($) | ||||||||||||||||||
| 2025 | 688,800 | 845,600 | (4) | 281,600 | 286,800 | (5) | 175.35 | 12,716,000 | ||||||||||||||||
| 2024 | 692,700 | 1,087,600 | (6) | 283,300 | 311,000 | (7) | 157.73 | 6,690,000 | ||||||||||||||||
| 2023 | 600,300 | 647,600 | (8) | 252,700 | 258,300 | (9) | 108.09 | 21,790,000 | ||||||||||||||||
| (1) | Christopher V. Vitale served as principal executive officer (“PEO”) of the Company for 2025, 2024 and 2023. |
| (2) | Adrienne M. Uleau, Chief Financial Officer and Vice President of the Company, served as the only non-PEO named executive officer of the Company for 2025, 2024 and 2023. |
| (3) | For purposes of calculating total shareholder return, the measurement period is the market close on the last trading day in 2022, through and including the end of the fiscal year for which total shareholder return is being calculated. The closing price per share of the Company’s common stock on the last trading day in in 2022 was $12.86, in 2023 was $13.90, in 2024 was $20.28 and in 2025 was $22.55. |
| (4) | For compensation actually paid to PEO in 2025 (rounded to nearest hundred), the Summary Compensation Table total for the PEO is adjusted to reflect the following changes: |
| ● | $156,900 was deducted representing the amount reported in the Stock Awards and Option Awards columns of the Summary Compensation Table in 2025; |
| ● | $162,360 was added representing the fair value as of the end of 2025 of all stock or option awards granted during 2025 that are outstanding and unvested as of the end of 2025; |
| ● | $153,087 was added representing the change as of the end of 2025 (from the end of 2024) in fair value of any stock or option awards granted prior to 2025 that are outstanding and unvested as of the end of 2025; and |
| ● | $1,776 was deducted representing the change as of the vesting date (from the end of 2024) in fair value of any stock or option awards granted prior to 2025 for which all applicable vesting conditions were satisfied at the end of or during 2025. |
| (5) | For compensation actually paid to non-PEO named executive officers in 2025 (rounded to nearest hundred), the Summary Compensation Table total for the non-PEO named executive officers is adjusted to reflect the following changes: |
| ● | $41,200 was deducted representing the amount reported in the Stock Awards and Option Awards columns of the Summary Compensation Table in 2025; |
| ● | $42,620 was added representing the fair value as of the end of 2025 of all stock or option awards granted during 2025 that are outstanding and unvested as of the end of 2025; |
| ● | $4,759 was added representing the change as of the end of 2025 (from the end of 2024) in fair value of any stock or option awards granted prior to 2025 that are outstanding and unvested as of the end of 2025; and |
| ● | $943 was deducted representing the change as of the vesting date (from the end of 2024) in fair value of any stock or option awards granted prior to 2025 for which all applicable vesting conditions were satisfied at the end of or during 2025. |
| (6) | For compensation actually paid to PEO in 2024 (rounded to nearest hundred), the Summary Compensation Table total for the PEO is adjusted to reflect the following changes: |
| ● | $153,900 was deducted representing the amount reported in the Stock Awards and Option Awards columns of the Summary Compensation Table in 2024; |
| ● | $162,272 was added representing the fair value as of the end of 2024 of all stock or option awards granted during 2024 that are outstanding and unvested as of the end of 2024; |
| ● | $356,316 was added representing the change as of the end of 2024 (from the end of 2023) in fair value of any stock or option awards granted prior to 2024 that are outstanding and unvested as of the end of 2024; and |
| ● | $30,197 was added representing the change as of the vesting date (from the end of 2023) in fair value of any stock or option awards granted prior to 2024 for which all applicable vesting conditions were satisfied at the end of or during 2024. |
| (7) | For compensation actually paid to non-PEO named executive officers in 2024 (rounded to nearest hundred), the Summary Compensation Table total for the non-PEO named executive officers is adjusted to reflect the following changes: |
| ● | $40,400 was deducted representing the amount reported in the Stock Awards and Option Awards columns of the Summary Compensation Table in 2024; |
| ● | $42,596 was added representing the fair value as of the end of 2024 of all stock or option awards granted during 2024 that are outstanding and unvested as of the end of 2024; |
| ● | $14,262 was added representing the change as of the end of 2024 (from the end of 2023) in fair value of any stock or option awards granted prior to 2024 that are outstanding and unvested as of the end of 2024; and |
| ● | $11,241 was added representing the change as of the vesting date (from the end of 2023) in fair value of any stock or option awards granted prior to 2024 for which all applicable vesting conditions were satisfied at the end of or during 2024. |
| (8) | For compensation actually paid to PEO in 2023 (rounded to nearest hundred), the Summary Compensation Table total for the PEO is adjusted to reflect the following changes: |
| ● | $89,300 was deducted representing the amount reported in the Stock Awards and Option Awards columns of the Summary Compensation Table in 2023; |
| ● | $111,200 was added representing the fair value as of the end of 2023 of all stock or option awards granted during 2023 that are outstanding and unvested as of the end of 2023; |
| ● | $36,086 was added representing the change as of the end of 2023 (from the end of 2022) in fair value of any stock or option awards granted prior to 2023 that are outstanding and unvested as of the end of 2023; and |
| ● | $10,695 was deducted representing the change as of the vesting date (from the end of 2022) in fair value of any stock or option awards granted prior to 2023 for which all applicable vesting conditions were satisfied at the end of or during 2023. |
| (9) | For compensation actually paid to non-PEO named executive officers in 2023 (rounded to nearest hundred), the Summary Compensation Table total for the non-PEO named executive officers is adjusted to reflect the following changes: |
| ● | $23,500 was deducted representing the amount reported in the Stock Awards and Option Awards columns of the Summary Compensation Table in 2023; |
| ● | $29,190 was added representing the fair value as of the end of 2023 of all stock or option awards granted during 2023 that are outstanding and unvested as of the end of 2023; |
| ● | $2,774 was added representing the change as of the end of 2023 (from the end of 2022) in fair value of any stock or option awards granted prior to 2023 that are outstanding and unvested as of the end of 2023; and |
| ● | $2,831 was deducted representing the change as of the vesting date (from the end of 2022) in fair value of any stock or option awards granted prior to 2023 for which all applicable vesting conditions were satisfied at the end of or during 2023. |
| (1) | Christopher V. Vitale served as principal executive officer (“PEO”) of the Company for 2025, 2024 and 2023. |
| (2) | Adrienne M. Uleau, Chief Financial Officer and Vice President of the Company, served as the only non-PEO named executive officer of the Company for 2025, 2024 and 2023. |
| (4) | For compensation actually paid to PEO in 2025 (rounded to nearest hundred), the Summary Compensation Table total for the PEO is adjusted to reflect the following changes: |
| ● | $156,900 was deducted representing the amount reported in the Stock Awards and Option Awards columns of the Summary Compensation Table in 2025; |
| ● | $162,360 was added representing the fair value as of the end of 2025 of all stock or option awards granted during 2025 that are outstanding and unvested as of the end of 2025; |
| ● | $153,087 was added representing the change as of the end of 2025 (from the end of 2024) in fair value of any stock or option awards granted prior to 2025 that are outstanding and unvested as of the end of 2025; and |
| ● | $1,776 was deducted representing the change as of the vesting date (from the end of 2024) in fair value of any stock or option awards granted prior to 2025 for which all applicable vesting conditions were satisfied at the end of or during 2025. |
| (6) | For compensation actually paid to PEO in 2024 (rounded to nearest hundred), the Summary Compensation Table total for the PEO is adjusted to reflect the following changes: |
| ● | $153,900 was deducted representing the amount reported in the Stock Awards and Option Awards columns of the Summary Compensation Table in 2024; |
| ● | $162,272 was added representing the fair value as of the end of 2024 of all stock or option awards granted during 2024 that are outstanding and unvested as of the end of 2024; |
| ● | $356,316 was added representing the change as of the end of 2024 (from the end of 2023) in fair value of any stock or option awards granted prior to 2024 that are outstanding and unvested as of the end of 2024; and |
| ● | $30,197 was added representing the change as of the vesting date (from the end of 2023) in fair value of any stock or option awards granted prior to 2024 for which all applicable vesting conditions were satisfied at the end of or during 2024. |
| (8) | For compensation actually paid to PEO in 2023 (rounded to nearest hundred), the Summary Compensation Table total for the PEO is adjusted to reflect the following changes: |
| ● | $89,300 was deducted representing the amount reported in the Stock Awards and Option Awards columns of the Summary Compensation Table in 2023; |
| ● | $111,200 was added representing the fair value as of the end of 2023 of all stock or option awards granted during 2023 that are outstanding and unvested as of the end of 2023; |
| ● | $36,086 was added representing the change as of the end of 2023 (from the end of 2022) in fair value of any stock or option awards granted prior to 2023 that are outstanding and unvested as of the end of 2023; and |
| ● | $10,695 was deducted representing the change as of the vesting date (from the end of 2022) in fair value of any stock or option awards granted prior to 2023 for which all applicable vesting conditions were satisfied at the end of or during 2023. |
| (5) | For compensation actually paid to non-PEO named executive officers in 2025 (rounded to nearest hundred), the Summary Compensation Table total for the non-PEO named executive officers is adjusted to reflect the following changes: |
| ● | $41,200 was deducted representing the amount reported in the Stock Awards and Option Awards columns of the Summary Compensation Table in 2025; |
| ● | $42,620 was added representing the fair value as of the end of 2025 of all stock or option awards granted during 2025 that are outstanding and unvested as of the end of 2025; |
| ● | $4,759 was added representing the change as of the end of 2025 (from the end of 2024) in fair value of any stock or option awards granted prior to 2025 that are outstanding and unvested as of the end of 2025; and |
| ● | $943 was deducted representing the change as of the vesting date (from the end of 2024) in fair value of any stock or option awards granted prior to 2025 for which all applicable vesting conditions were satisfied at the end of or during 2025. |
| (7) | For compensation actually paid to non-PEO named executive officers in 2024 (rounded to nearest hundred), the Summary Compensation Table total for the non-PEO named executive officers is adjusted to reflect the following changes: |
| ● | $40,400 was deducted representing the amount reported in the Stock Awards and Option Awards columns of the Summary Compensation Table in 2024; |
| ● | $42,596 was added representing the fair value as of the end of 2024 of all stock or option awards granted during 2024 that are outstanding and unvested as of the end of 2024; |
| ● | $14,262 was added representing the change as of the end of 2024 (from the end of 2023) in fair value of any stock or option awards granted prior to 2024 that are outstanding and unvested as of the end of 2024; and |
| ● | $11,241 was added representing the change as of the vesting date (from the end of 2023) in fair value of any stock or option awards granted prior to 2024 for which all applicable vesting conditions were satisfied at the end of or during 2024. |
| (9) | For compensation actually paid to non-PEO named executive officers in 2023 (rounded to nearest hundred), the Summary Compensation Table total for the non-PEO named executive officers is adjusted to reflect the following changes: |
| ● | $23,500 was deducted representing the amount reported in the Stock Awards and Option Awards columns of the Summary Compensation Table in 2023; |
| ● | $29,190 was added representing the fair value as of the end of 2023 of all stock or option awards granted during 2023 that are outstanding and unvested as of the end of 2023; |
| ● | $2,774 was added representing the change as of the end of 2023 (from the end of 2022) in fair value of any stock or option awards granted prior to 2023 that are outstanding and unvested as of the end of 2023; and |
| ● | $2,831 was deducted representing the change as of the vesting date (from the end of 2022) in fair value of any stock or option awards granted prior to 2023 for which all applicable vesting conditions were satisfied at the end of or during 2023. |