Shareholder Report
May 31, 2025
USD ($)
Holding
What were the Fund costs for the last six months?
(Based on a hypothetical $10,000 investment)
| Share Class Name | Costs of a $10,000 investment | Costs paid as a percentage of a $10,000 investment1 |
| Class A | $71 | 1.47% |
| 1. | Annualized. |
Fund Performance
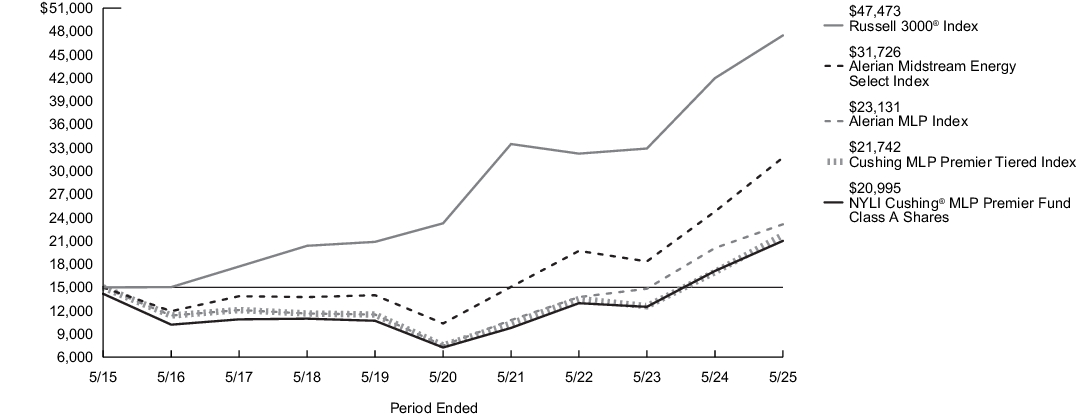
The following graph compares the initial and subsequent account values at the end of each of the most recently completed 10 semiannual reporting periods of the Fund (or for the life of the Fund, if shorter). It assumes a $15,000 initial investment at the beginning of the first fiscal period in an appropriate, broad-based securities market index and other additional indexes, if applicable, for the same period and reflects the deduction of all sales charges, where applicable.
| Average Annual Total Returns for the Period Ended May 31, 2025 | Inception Date |
Six Months1 |
One Year |
Five Years |
Ten Years |
| Class A Shares - Including sales charges | 10/20/2010 | (11.57)% | 15.90% | 22.29% | 3.42% |
| Class A Shares - Excluding sales charges | (6.42)% | 22.65% | 23.69% | 4.01% | |
| Russell 3000®Index2 | (2.44)% | 13.12% | 15.34% | 12.21% | |
| Alerian Midstream Energy Select Index3 | (2.80)% | 28.06% | 25.12% | 7.78% | |
| Cushing MLP Premier Tiered Index4 | (2.80)% | 28.06% | 23.70% | 3.78% | |
| Alerian MLP Index5 | (3.12)% | 15.24% | 25.25% | 4.43% | |
| Morningstar Energy Limited Partnership Category Average6 | 26.17% | 20.54% | 23.38% | 3.72% |
| 1. |
Not annualized. |
| 2. |
The Fund has selected the Russell 3000® Index to represent a broad measure of market performance. The Russell 3000® Index measures the performance of the largest 3,000 U.S. companies representing approximately 98% of the investable U.S. equity market. |
| 3. |
The Alerian Midstream Energy Select Index, which is generally representative of the market sectors or types of investments in which the Fund invests, is a broad-based composite of North American energy infrastructure companies. The Alerian Midstream Energy Select Index is a capped, float-adjusted, capitalization weighted index, whose constituents earn the majority of their cash flow from midstream activities involving energy commodities. |
| 4. |
The returns for the tiered benchmark represent the returns of the Alerian MLP Index prior to December 1, 2020 and the returns of the Alerian Midstream Energy Select Index thereafter. |
| 5. |
The Alerian MLP Index, which is generally representative of the market sectors or types of investments in which the Fund invests, is an unmanaged, capped, float-adjusted, capitalization-weighted index and a leading gauge of energy MLPs. |
| 6. |
The Morningstar Energy Limited Partnership Category Average is representative of funds that invest primarily a significant amount of their fund in energy master limited partnerships. These include but are not limited to limited partnerships specializing in midstream operations in the energy industry. Results are based on average total returns of similar funds with all dividends and capital gain distributions reinvested. |
Key Fund Statistics
| Fund's net assets | $1,068,495,532 |
| Total number of portfolio holdings | 29 |
| Portfolio turnover rate | 12% |
Graphical Representation of Holdings
The tables below show the investment makeup of the Fund; percentages indicated are based on the Fund's net assets.
Top Ten Holdings and/or Issuers*
| Energy Transfer LP | 9.1% |
| Cheniere Energy, Inc. | 7.8% |
| ONEOK, Inc. | 7.7% |
| Targa Resources Corp. | 7.4% |
| MPLX LP | 5.7% |
| Hess Midstream LP, Class A | 5.5% |
| DT Midstream, Inc. | 5.4% |
| Williams Cos., Inc. (The) | 4.9% |
| Kinder Morgan, Inc. | 4.9% |
| TC Energy Corp. | 4.7% |
| * Excluding short-term investments |
Top Industries
| Large Cap Diversified C Corps | 40.6% |
| Large Cap MLP | 19.5% |
| Natural Gas Gatherers & Processors | 18.2% |
| Natural Gas Transportation & Storage | 5.4% |
| Crude Oil & Refined Products | 3.6% |
| Other Corp | 3.5% |
| Utility | 3.1% |
| Refiners | 2.9% |
| Canadian Midstream | 1.7% |
| YieldCo | 1.2% |
Top Ten Holdings and/or Issuers*
| Energy Transfer LP | 9.1% |
| Cheniere Energy, Inc. | 7.8% |
| ONEOK, Inc. | 7.7% |
| Targa Resources Corp. | 7.4% |
| MPLX LP | 5.7% |
| Hess Midstream LP, Class A | 5.5% |
| DT Midstream, Inc. | 5.4% |
| Williams Cos., Inc. (The) | 4.9% |
| Kinder Morgan, Inc. | 4.9% |
| TC Energy Corp. | 4.7% |
| * Excluding short-term investments |
What were the Fund costs for the last six months?
(Based on a hypothetical $10,000 investment)
| Share Class Name | Costs of a $10,000 investment | Costs paid as a percentage of a $10,000 investment1 |
| Class C | $106 | 2.21% |
| 1. | Annualized. |
Fund Performance
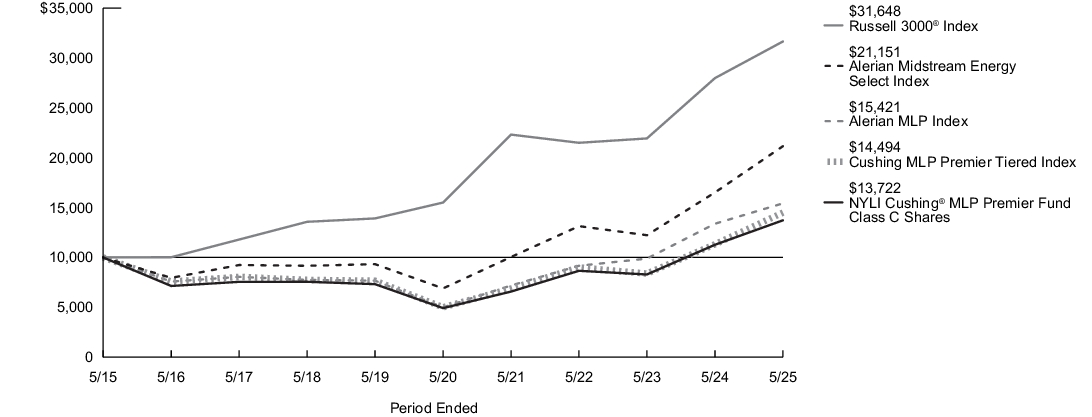
The following graph compares the initial and subsequent account values at the end of each of the most recently completed 10 semiannual reporting periods of the Fund (or for the life of the Fund, if shorter). It assumes a $10,000 initial investment at the beginning of the first fiscal period in an appropriate, broad-based securities market index and other additional indexes, if applicable, for the same period and reflects the deduction of all sales charges, where applicable.
| Average Annual Total Returns for the Period Ended May 31, 2025 | Inception Date |
Six Months1 |
One Year |
Five Years |
Ten Years |
| Class C Shares - Including sales charges | 10/20/2010 | (7.77)% | 20.72% | 22.77% | 3.21% |
| Class C Shares - Excluding sales charges | (6.88)% | 21.72% | 22.77% | 3.21% | |
| Russell 3000®Index2 | (2.44)% | 13.12% | 15.34% | 12.21% | |
| Alerian Midstream Energy Select Index3 | (2.80)% | 28.06% | 25.12% | 7.78% | |
| Cushing MLP Premier Tiered Index4 | (2.80)% | 28.06% | 23.70% | 3.78% | |
| Alerian MLP Index5 | (3.12)% | 15.24% | 25.25% | 4.43% | |
| Morningstar Energy Limited Partnership Category Average6 | 26.17% | 20.54% | 23.38% | 3.72% |
| 1. |
Not annualized. |
| 2. |
The Fund has selected the Russell 3000® Index to represent a broad measure of market performance. The Russell 3000® Index measures the performance of the largest 3,000 U.S. companies representing approximately 98% of the investable U.S. equity market. |
| 3. |
The Alerian Midstream Energy Select Index, which is generally representative of the market sectors or types of investments in which the Fund invests, is a broad-based composite of North American energy infrastructure companies. The Alerian Midstream Energy Select Index is a capped, float-adjusted, capitalization weighted index, whose constituents earn the majority of their cash flow from midstream activities involving energy commodities. |
| 4. |
The returns for the tiered benchmark represent the returns of the Alerian MLP Index prior to December 1, 2020 and the returns of the Alerian Midstream Energy Select Index thereafter. |
| 5. |
The Alerian MLP Index, which is generally representative of the market sectors or types of investments in which the Fund invests, is an unmanaged, capped, float-adjusted, capitalization-weighted index and a leading gauge of energy MLPs. |
| 6. |
The Morningstar Energy Limited Partnership Category Average is representative of funds that invest primarily a significant amount of their fund in energy master limited partnerships. These include but are not limited to limited partnerships specializing in midstream operations in the energy industry. Results are based on average total returns of similar funds with all dividends and capital gain distributions reinvested. |
Key Fund Statistics
| Fund's net assets | $1,068,495,532 |
| Total number of portfolio holdings | 29 |
| Portfolio turnover rate | 12% |
Graphical Representation of Holdings
The tables below show the investment makeup of the Fund; percentages indicated are based on the Fund's net assets.
Top Ten Holdings and/or Issuers*
| Energy Transfer LP | 9.1% |
| Cheniere Energy, Inc. | 7.8% |
| ONEOK, Inc. | 7.7% |
| Targa Resources Corp. | 7.4% |
| MPLX LP | 5.7% |
| Hess Midstream LP, Class A | 5.5% |
| DT Midstream, Inc. | 5.4% |
| Williams Cos., Inc. (The) | 4.9% |
| Kinder Morgan, Inc. | 4.9% |
| TC Energy Corp. | 4.7% |
| * Excluding short-term investments |
Top Industries
| Large Cap Diversified C Corps | 40.6% |
| Large Cap MLP | 19.5% |
| Natural Gas Gatherers & Processors | 18.2% |
| Natural Gas Transportation & Storage | 5.4% |
| Crude Oil & Refined Products | 3.6% |
| Other Corp | 3.5% |
| Utility | 3.1% |
| Refiners | 2.9% |
| Canadian Midstream | 1.7% |
| YieldCo | 1.2% |
Top Ten Holdings and/or Issuers*
| Energy Transfer LP | 9.1% |
| Cheniere Energy, Inc. | 7.8% |
| ONEOK, Inc. | 7.7% |
| Targa Resources Corp. | 7.4% |
| MPLX LP | 5.7% |
| Hess Midstream LP, Class A | 5.5% |
| DT Midstream, Inc. | 5.4% |
| Williams Cos., Inc. (The) | 4.9% |
| Kinder Morgan, Inc. | 4.9% |
| TC Energy Corp. | 4.7% |
| * Excluding short-term investments |
What were the Fund costs for the last six months?
(Based on a hypothetical $10,000 investment)
| Share Class Name | Costs of a $10,000 investment | Costs paid as a percentage of a $10,000 investment1 |
| Class I | $59 | 1.22% |
| 1. | Annualized. |
Fund Performance
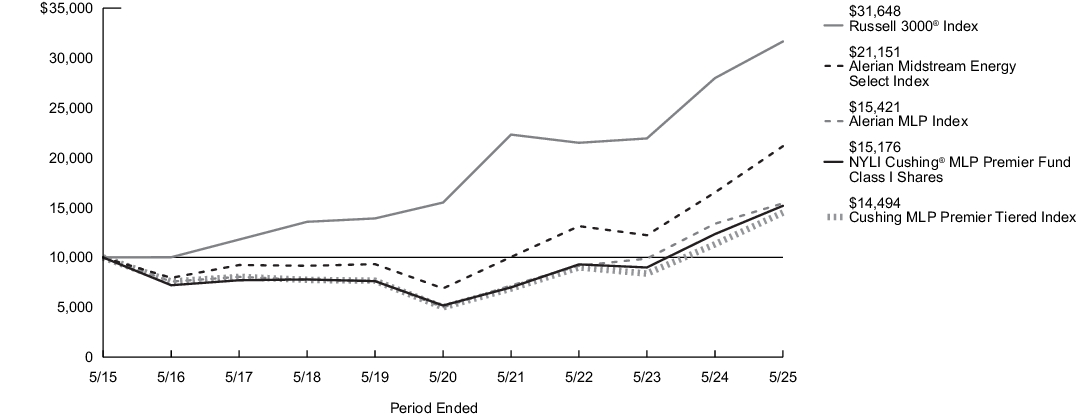
The following graph compares the initial and subsequent account values at the end of each of the most recently completed 10 semiannual reporting periods of the Fund (or for the life of the Fund, if shorter). It assumes a $10,000 initial investment at the beginning of the first fiscal period in an appropriate, broad-based securities market index and other additional indexes, if applicable, for the same period and reflects the deduction of all sales charges, where applicable.
| Average Annual Total Returns for the Period Ended May 31, 2025 | Inception Date |
Six Months1 |
One Year |
Five Years |
Ten Years |
| Class I Shares | 10/20/2010 | (6.34)% | 22.96% | 23.97% | 4.26% |
| Russell 3000®Index2 | (2.44)% | 13.12% | 15.34% | 12.21% | |
| Alerian Midstream Energy Select Index3 | (2.80)% | 28.06% | 25.12% | 7.78% | |
| Cushing MLP Premier Tiered Index4 | (2.80)% | 28.06% | 23.70% | 3.78% | |
| Alerian MLP Index5 | (3.12)% | 15.24% | 25.25% | 4.43% | |
| Morningstar Energy Limited Partnership Category Average6 | 26.17% | 20.54% | 23.38% | 3.72% |
| 1. |
Not annualized. |
| 2. |
The Fund has selected the Russell 3000® Index to represent a broad measure of market performance. The Russell 3000® Index measures the performance of the largest 3,000 U.S. companies representing approximately 98% of the investable U.S. equity market. |
| 3. |
The Alerian Midstream Energy Select Index, which is generally representative of the market sectors or types of investments in which the Fund invests, is a broad-based composite of North American energy infrastructure companies. The Alerian Midstream Energy Select Index is a capped, float-adjusted, capitalization weighted index, whose constituents earn the majority of their cash flow from midstream activities involving energy commodities. |
| 4. |
The returns for the tiered benchmark represent the returns of the Alerian MLP Index prior to December 1, 2020 and the returns of the Alerian Midstream Energy Select Index thereafter. |
| 5. |
The Alerian MLP Index, which is generally representative of the market sectors or types of investments in which the Fund invests, is an unmanaged, capped, float-adjusted, capitalization-weighted index and a leading gauge of energy MLPs. |
| 6. |
The Morningstar Energy Limited Partnership Category Average is representative of funds that invest primarily a significant amount of their fund in energy master limited partnerships. These include but are not limited to limited partnerships specializing in midstream operations in the energy industry. Results are based on average total returns of similar funds with all dividends and capital gain distributions reinvested. |
Key Fund Statistics
| Fund's net assets | $1,068,495,532 |
| Total number of portfolio holdings | 29 |
| Portfolio turnover rate | 12% |
Graphical Representation of Holdings
The tables below show the investment makeup of the Fund; percentages indicated are based on the Fund's net assets.
Top Ten Holdings and/or Issuers*
| Energy Transfer LP | 9.1% |
| Cheniere Energy, Inc. | 7.8% |
| ONEOK, Inc. | 7.7% |
| Targa Resources Corp. | 7.4% |
| MPLX LP | 5.7% |
| Hess Midstream LP, Class A | 5.5% |
| DT Midstream, Inc. | 5.4% |
| Williams Cos., Inc. (The) | 4.9% |
| Kinder Morgan, Inc. | 4.9% |
| TC Energy Corp. | 4.7% |
| * Excluding short-term investments |
Top Industries
| Large Cap Diversified C Corps | 40.6% |
| Large Cap MLP | 19.5% |
| Natural Gas Gatherers & Processors | 18.2% |
| Natural Gas Transportation & Storage | 5.4% |
| Crude Oil & Refined Products | 3.6% |
| Other Corp | 3.5% |
| Utility | 3.1% |
| Refiners | 2.9% |
| Canadian Midstream | 1.7% |
| YieldCo | 1.2% |
Top Ten Holdings and/or Issuers*
| Energy Transfer LP | 9.1% |
| Cheniere Energy, Inc. | 7.8% |
| ONEOK, Inc. | 7.7% |
| Targa Resources Corp. | 7.4% |
| MPLX LP | 5.7% |
| Hess Midstream LP, Class A | 5.5% |
| DT Midstream, Inc. | 5.4% |
| Williams Cos., Inc. (The) | 4.9% |
| Kinder Morgan, Inc. | 4.9% |
| TC Energy Corp. | 4.7% |
| * Excluding short-term investments |
What were the Fund costs for the last six months?
(Based on a hypothetical $10,000 investment)
| Share Class Name | Costs of a $10,000 investment | Costs paid as a percentage of a $10,000 investment1 |
| Investor Class | $70 | 1.46% |
| 1. | Annualized. |
Fund Performance
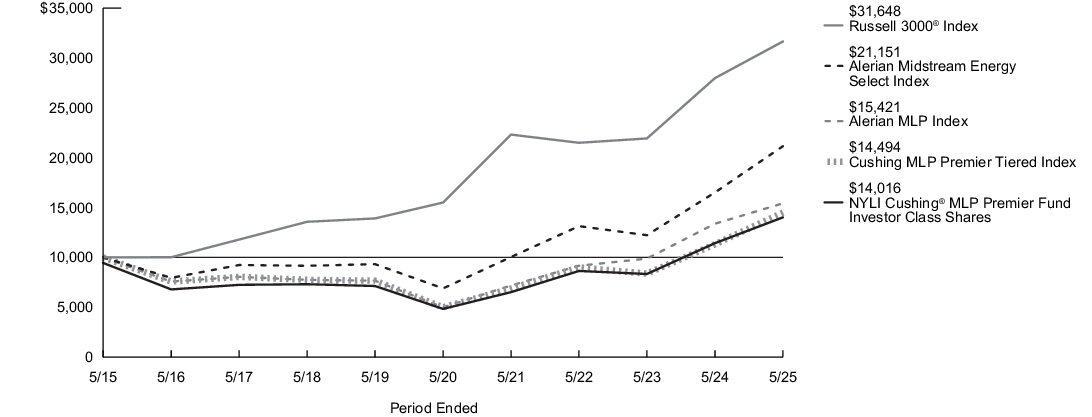
The following graph compares the initial and subsequent account values at the end of each of the most recently completed 10 semiannual reporting periods of the Fund (or for the life of the Fund, if shorter). It assumes a $10,000 initial investment at the beginning of the first fiscal period in an appropriate, broad-based securities market index and other additional indexes, if applicable, for the same period and reflects the deduction of all sales charges, where applicable.
| Average Annual Total Returns for the Period Ended May 31, 2025 | Inception Date |
Six Months1 |
One Year |
Five Years |
Ten Years |
| Investor Class Shares - Including sales charges | 7/11/2014 | (11.16)% | 16.45% | 22.30% | 3.43% |
| Investor Class Shares - Excluding sales charges | (6.48)% | 22.58% | 23.69% | 4.02% | |
| Russell 3000®Index2 | (2.44)% | 13.12% | 15.34% | 12.21% | |
| Alerian Midstream Energy Select Index3 | (2.80)% | 28.06% | 25.12% | 7.78% | |
| Cushing MLP Premier Tiered Index4 | (2.80)% | 28.06% | 23.70% | 3.78% | |
| Alerian MLP Index5 | (3.12)% | 15.24% | 25.25% | 4.43% | |
| Morningstar Energy Limited Partnership Category Average6 | 26.17% | 20.54% | 23.38% | 3.72% |
| 1. |
Not annualized. |
| 2. |
The Fund has selected the Russell 3000® Index to represent a broad measure of market performance. The Russell 3000® Index measures the performance of the largest 3,000 U.S. companies representing approximately 98% of the investable U.S. equity market. |
| 3. |
The Alerian Midstream Energy Select Index, which is generally representative of the market sectors or types of investments in which the Fund invests, is a broad-based composite of North American energy infrastructure companies. The Alerian Midstream Energy Select Index is a capped, float-adjusted, capitalization weighted index, whose constituents earn the majority of their cash flow from midstream activities involving energy commodities. |
| 4. |
The returns for the tiered benchmark represent the returns of the Alerian MLP Index prior to December 1, 2020 and the returns of the Alerian Midstream Energy Select Index thereafter. |
| 5. |
The Alerian MLP Index, which is generally representative of the market sectors or types of investments in which the Fund invests, is an unmanaged, capped, float-adjusted, capitalization-weighted index and a leading gauge of energy MLPs. |
| 6. |
The Morningstar Energy Limited Partnership Category Average is representative of funds that invest primarily a significant amount of their fund in energy master limited partnerships. These include but are not limited to limited partnerships specializing in midstream operations in the energy industry. Results are based on average total returns of similar funds with all dividends and capital gain distributions reinvested. |
Key Fund Statistics
| Fund's net assets | $1,068,495,532 |
| Total number of portfolio holdings | 29 |
| Portfolio turnover rate | 12% |
Graphical Representation of Holdings
The tables below show the investment makeup of the Fund; percentages indicated are based on the Fund's net assets.
Top Ten Holdings and/or Issuers*
| Energy Transfer LP | 9.1% |
| Cheniere Energy, Inc. | 7.8% |
| ONEOK, Inc. | 7.7% |
| Targa Resources Corp. | 7.4% |
| MPLX LP | 5.7% |
| Hess Midstream LP, Class A | 5.5% |
| DT Midstream, Inc. | 5.4% |
| Williams Cos., Inc. (The) | 4.9% |
| Kinder Morgan, Inc. | 4.9% |
| TC Energy Corp. | 4.7% |
| * Excluding short-term investments |
Top Industries
| Large Cap Diversified C Corps | 40.6% |
| Large Cap MLP | 19.5% |
| Natural Gas Gatherers & Processors | 18.2% |
| Natural Gas Transportation & Storage | 5.4% |
| Crude Oil & Refined Products | 3.6% |
| Other Corp | 3.5% |
| Utility | 3.1% |
| Refiners | 2.9% |
| Canadian Midstream | 1.7% |
| YieldCo | 1.2% |
Top Ten Holdings and/or Issuers*
| Energy Transfer LP | 9.1% |
| Cheniere Energy, Inc. | 7.8% |
| ONEOK, Inc. | 7.7% |
| Targa Resources Corp. | 7.4% |
| MPLX LP | 5.7% |
| Hess Midstream LP, Class A | 5.5% |
| DT Midstream, Inc. | 5.4% |
| Williams Cos., Inc. (The) | 4.9% |
| Kinder Morgan, Inc. | 4.9% |
| TC Energy Corp. | 4.7% |
| * Excluding short-term investments |
| [1] | Annualized. |
| [2] | Annualized. |
| [3] | Annualized. |
| [4] | Annualized. |