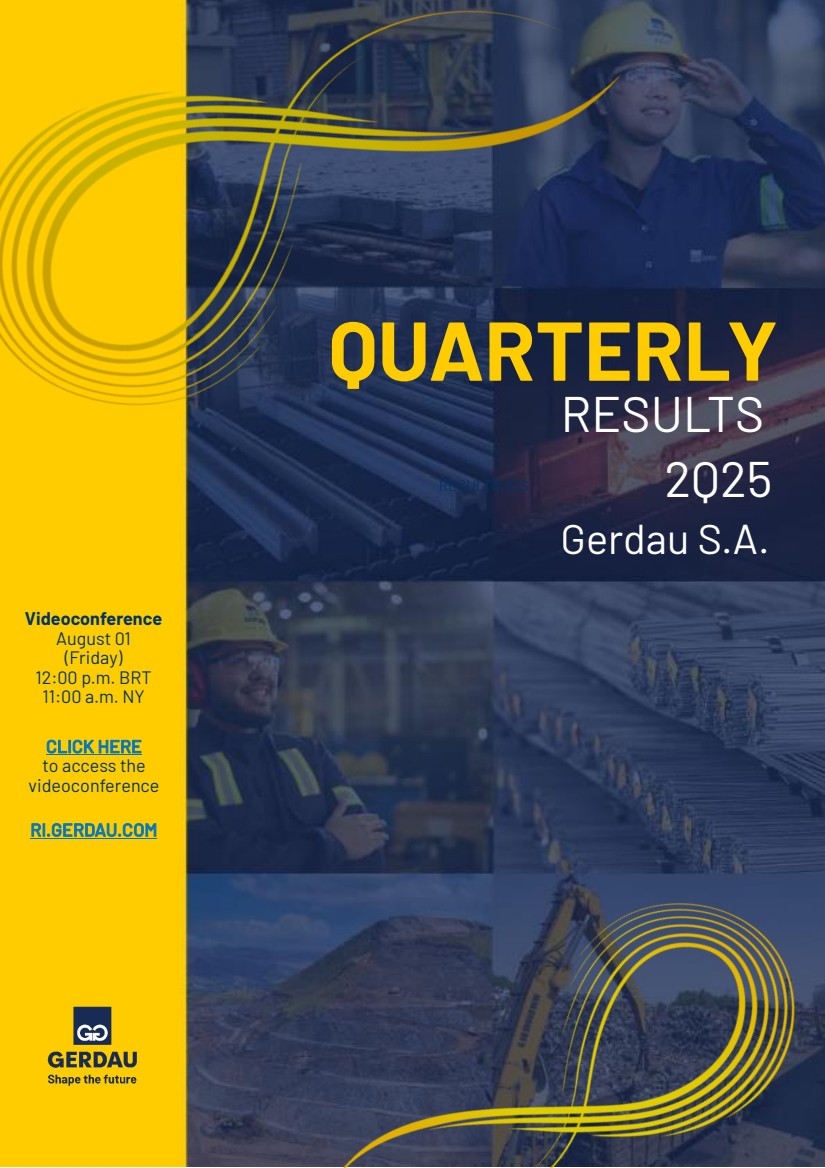
| QUARTERLY TRIMESTRAIS TRIMESTRAIS TRIMESTRAIS RESULTADOS RESULTADOS RESULTADOS RESULTS 2Q25 4T24 4T24 4T24 Videoconference August 01 (Friday) 12:00 p.m. BRT 11:00 a.m. NY CLICK HERE to access the videoconference RI.GERDAU.COM RI.GERDAU.COM RI.GERDAU.COM RI.GERDAU.COM Gerdau S.A. |
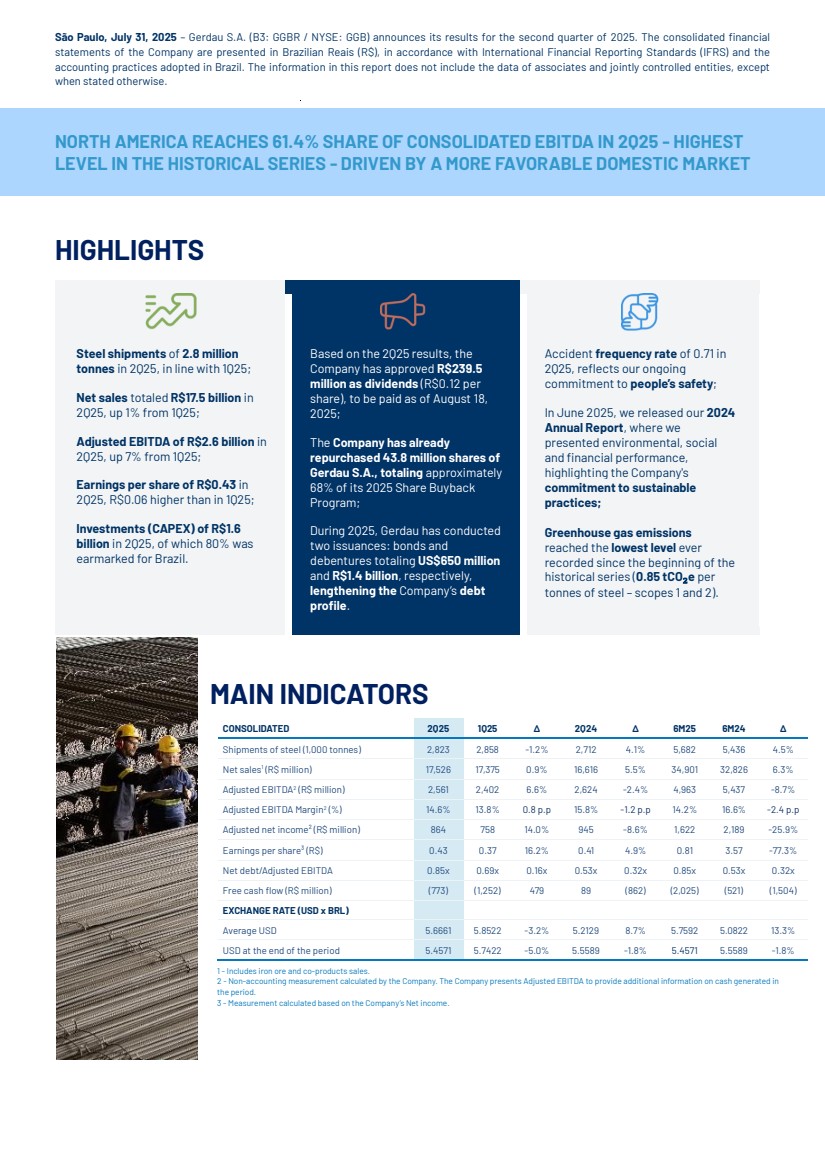
| São Paulo, July 31, 2025 – Gerdau S.A. (B3: GGBR / NYSE: GGB) announces its results for the second quarter of 2025. The consolidated financial statements of the Company are presented in Brazilian Reais (R$), in accordance with International Financial Reporting Standards (IFRS) and the accounting practices adopted in Brazil. The information in this report does not include the data of associates and jointly controlled entities, except when stated otherwise. NORTH AMERICA REACHES 61.4% SHARE OF CONSOLIDATED EBITDA IN 2Q25 - HIGHEST LEVEL IN THE HISTORICAL SERIES - DRIVEN BY A MORE FAVORABLE DOMESTIC MARKET HIGHLIGHTS MAIN INDICATORS 1 - Includes iron ore and co-products sales. 2 - Non-accounting measurement calculated by the Company. The Company presents Adjusted EBITDA to provide additional information on cash generated in the period. 3 - Measurement calculated based on the Company’s Net income. Steel shipments of 2.8 million tonnes in 2Q25, in line with 1Q25; Net sales totaled R$17.5 billion in 2Q25, up 1% from 1Q25; Adjusted EBITDA of R$2.6 billion in 2Q25, up 7% from 1Q25; Earnings per share of R$0.43 in 2Q25, R$0.06 higher than in 1Q25; Investments (CAPEX) of R$1.6 billion in 2Q25, of which 80% was earmarked for Brazil. Based on the 2Q25 results, the Company has approved R$239.5 million as dividends (R$0.12 per share), to be paid as of August 18, 2025; The Company has already repurchased 43.8 million shares of Gerdau S.A., totaling approximately 68% of its 2025 Share Buyback Program; During 2Q25, Gerdau has conducted two issuances: bonds and debentures totaling US$650 million and R$1.4 billion, respectively, lengthening the Company’s debt profile. Accident frequency rate of 0.71 in 2Q25, reflects our ongoing commitment to people’s safety; In June 2025, we released our 2024 Annual Report, where we presented environmental, social and financial performance, highlighting the Company's commitment to sustainable practices; Greenhouse gas emissions reached the lowest level ever recorded since the beginning of the historical series (0.85 tCO₂e per tonnes of steel – scopes 1 and 2). CONSOLIDATED 2Q25 1Q25 ∆ 2Q24 ∆ 6M25 6M24 ∆ Shipments of steel (1,000 tonnes) 2,823 2,858 -1.2% 2,712 4.1% 5,682 5,436 4.5% Net sales1 (R$ million) 17,526 17,375 0.9% 16,616 5.5% 34,901 32,826 6.3% Adjusted EBITDA2 (R$ million) 2,561 2,402 6.6% 2,624 -2.4% 4,963 5,437 -8.7% Adjusted EBITDA Margin2 (%) 14.6% 13.8% 0.8 p.p 15.8% -1.2 p.p 14.2% 16.6% -2.4 p.p Adjusted net income² (R$ million) 864 758 14.0% 945 -8.6% 1,622 2,189 -25.9% Earnings per share³ (R$) 0.43 0.37 16.2% 0.41 4.9% 0.81 3.57 -77.3% Net debt/Adjusted EBITDA 0.85x 0.69x 0.16x 0.53x 0.32x 0.85x 0.53x 0.32x Free cash flow (R$ million) (773) (1,252) 479 89 (862) (2,025) (521) (1,504) EXCHANGE RATE (USD x BRL) Average USD 5.6661 5.8522 -3.2% 5.2129 8.7% 5.7592 5.0822 13.3% USD at the end of the period 5.4571 5.7422 -5.0% 5.5589 -1.8% 5.4571 5.5589 -1.8% |
| Quarterly Results 2Q25 | Gerdau S.A. 3 MESSAGE FROM MANAGEMENT In 2Q25, we achieved another milestone in our safety results. This performance highlights our culture of caring for people and, as we always emphasize, this commitment is a priority guiding all our decisions. Despite a quarter marked by an even more challenging business environment in Brazil, mainly due to high levels of steel imports and intensified market competition – the geographic diversification of our operations has once again proven to be one of Gerdau’s key strategic advantages. We ended 2Q25 with Adjusted EBITDA of R$2.6 billion, 6.6% higher than 1Q25. Our North American operations evidenced notable performance, contributing with 61% of the quarter's consolidated EBITDA and offsetting the lower results in Brazil and South America. In North America, we achieved a shipment volume in the quarter that was 2.2% higher than in 1Q25, driven by a decline in imports levels due to the reinforcement of Section 232 tariffs and the resulting supply rebalancing. With the market prioritizing domestic steel over imports, the order backlog remained high throughout the quarter, averaging 75 days. Furthermore, the recovery in domestic demand has led to steel price increases across most products, which contributed to the growth of our operating results. In Brazil, we ended the quarter with a shipment volume 5.2% lower than in 1Q25, impacted by a decline in exports, partially offset by a recovery in domestic market volumes. In 2Q25, excessive steel imports under unfair competitive conditions persisted: the import penetration rate reached 26.0%, 3.9 p.p. higher than 2Q24. Flat steel imports surged to 29.5% –highest level since the beginning of Brazil Steel Institute (IABR, in Portuguese) historical series. Despite the renewal of the quota tariff system for another 12 months, the high level of imports remains a critical issue for the Brazilian steel industry competitiveness, reinforcing the urgency of improving trade defense mechanisms against imported steel. We remain focused on enhancing the competitiveness of our operations by adjusting market positioning to meet current needs of our customers, ensuring the long-term sustainability of our business. In South America, shipment volume in 2Q25 was 21.8% higher than in 1Q25, boosted mainly by increased export volumes in Argentina. However, overall steel demand in the region remains weak, in a market further pressured by rising steel imports and continued pricing reductions, which negatively impacted results. We invested R$1.6 billion in CAPEX during the quarter, with roughly 80% allocated to Brazil. We highlight the significant physical progress of Itabiritos Project, that reached 72% of physical progress in 2Q25. In addition, the gradual ramp-up of hot-rolled coil production at Ouro Branco (MG) is underway and will add 250,000 tonnes of capacity to serve domestic market, while also improving our operational efficiency. Based on 2Q25 results, the Company approved the distribution of dividends in the amount of R$0.12 per share, totaling R$239.5 million. In addition, we are consistently executing our share buyback program, approved on January 20, 2025, in which we have already repurchased 43.8 million shares (GGBR3, GGBR4 and/or GGB), approximately 68% of the total program and 2.2% of the Company's outstanding shares. While we remain firmly committed to executing our sustainable growth strategy, we have maintained our financial strength and continued to pursue greater efficiency and competitiveness in the face of industry and market challenges. Once again, we would like to thank our employees, customers, suppliers, partners, shareholders and other stakeholders for their trust and supportin building our history and continuously creating value. THE MANAGEMENT “Gerdau remains well-prepared to act in light of uncertain macroeconomic scenarios, such as those we have been facing in the global market. However, I would like to emphasize the importance of having fair competitive conditions in the Brazilian market to ensure the long-term sustainability of our business”. Gustavo Werneck, Gerdau’s CEO |
| Quarterly Results 2Q25 | Gerdau S.A. 4 PERFORMANCE BY BUSINESS SEGMENT BRAZIL – includes the long, flat, and special steel operations and the iron ore operation located in Brazil, as well as jointly-controlled and associated companies located in Brazil; NORTH AMERICA – includes the long and special steel operations in Canada and United States, as well as jointly controlled company in Canada and Mexico; SOUTH AMERICA – includes the operations in Argentina, Peru, and Uruguay. Valuation Guide ADJUSTED EBITDA3F0F 1 (R$ MILLION) AND ADJUSTED EBITDA MARGIN (%) BRAZIL NORTH AMERICA SOUTH AMERICA 1 Non-accounting measurement calculated by the Company. The Company states Adjusted EBITDA to provide additional information on cash generation in the period. The percentage of Adjusted EBITDA from business segments is calculated considering the total Adjusted EBITDA of the three business segments. Annual Report |
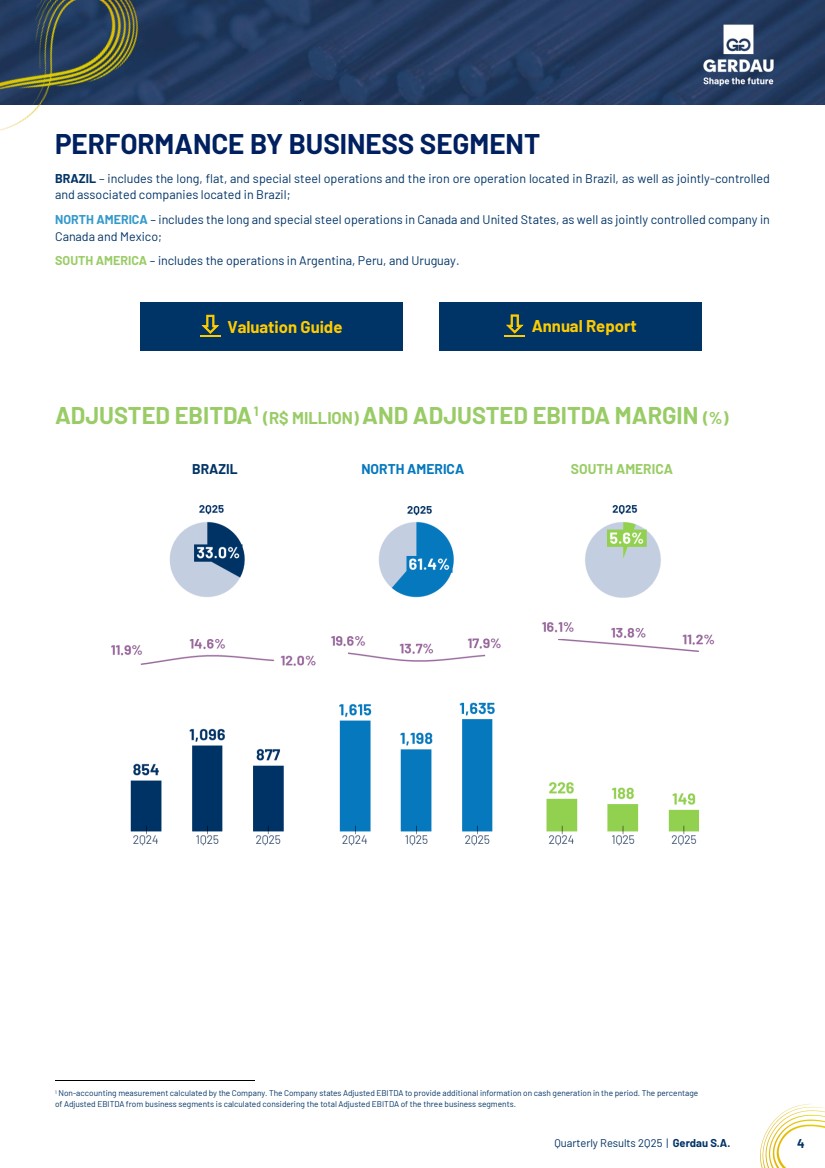
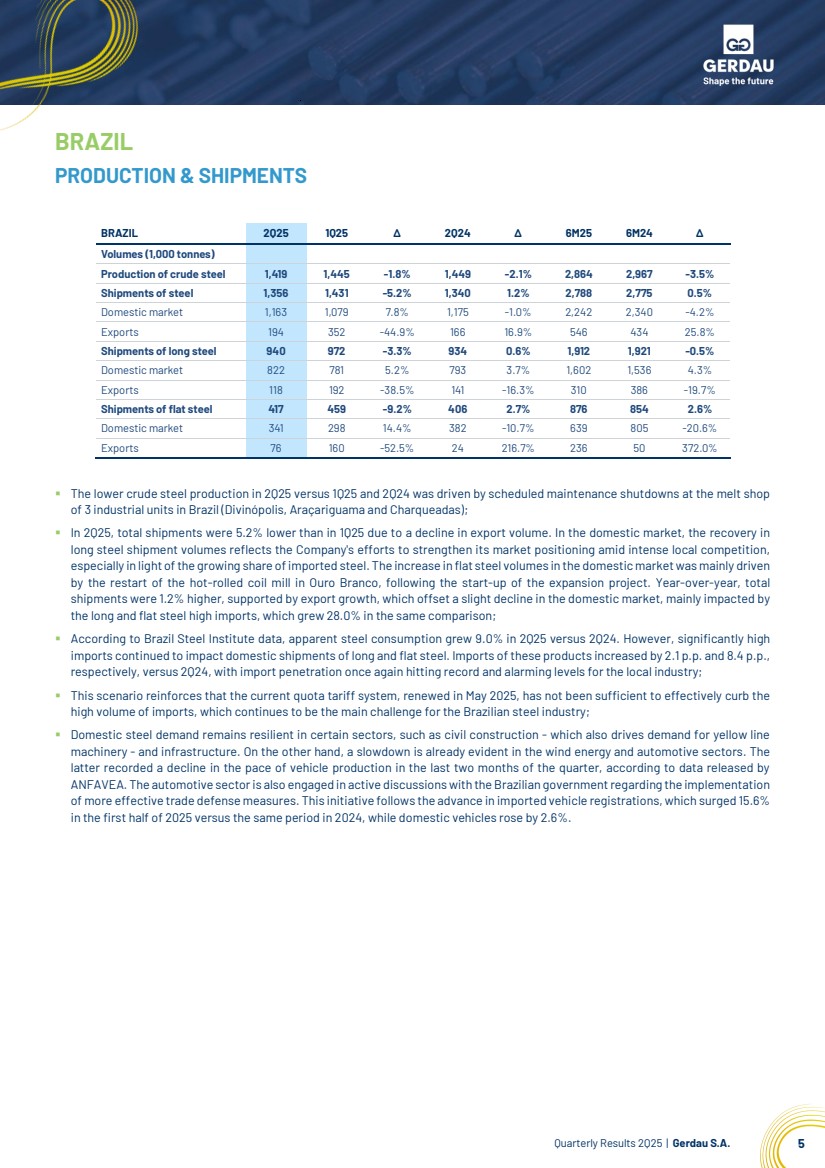
| Quarterly Results 2Q25 | Gerdau S.A. 5 BRAZIL PRODUCTION & SHIPMENTS ▪ The lower crude steel production in 2Q25 versus 1Q25 and 2Q24 was driven by scheduled maintenance shutdowns at the melt shop of 3 industrial units in Brazil (Divinópolis, Araçariguama and Charqueadas); ▪ In 2Q25, total shipments were 5.2% lower than in 1Q25 due to a decline in export volume. In the domestic market, the recovery in long steel shipment volumes reflects the Company's efforts to strengthen its market positioning amid intense local competition, especially in light of the growing share of imported steel. The increase in flat steel volumes in the domestic market was mainly driven by the restart of the hot-rolled coil mill in Ouro Branco, following the start-up of the expansion project. Year-over-year, total shipments were 1.2% higher, supported by export growth, which offset a slight decline in the domestic market, mainly impacted by the long and flat steel high imports, which grew 28.0% in the same comparison; ▪ According to Brazil Steel Institute data, apparent steel consumption grew 9.0% in 2Q25 versus 2Q24. However, significantly high imports continued to impact domestic shipments of long and flat steel. Imports of these products increased by 2.1 p.p. and 8.4 p.p., respectively, versus 2Q24, with import penetration once again hitting record and alarming levels for the local industry; ▪ This scenario reinforces that the current quota tariff system, renewed in May 2025, has not been sufficient to effectively curb the high volume of imports, which continues to be the main challenge for the Brazilian steel industry; ▪ Domestic steel demand remains resilient in certain sectors, such as civil construction - which also drives demand for yellow line machinery - and infrastructure. On the other hand, a slowdown is already evident in the wind energy and automotive sectors. The latter recorded a decline in the pace of vehicle production in the last two months of the quarter, according to data released by ANFAVEA. The automotive sector is also engaged in active discussions with the Brazilian government regarding the implementation of more effective trade defense measures. This initiative follows the advance in imported vehicle registrations, which surged 15.6% in the first half of 2025 versus the same period in 2024, while domestic vehicles rose by 2.6%. BRAZIL 2Q25 1Q25 ∆ 2Q24 ∆ 6M25 6M24 ∆ Volumes (1,000 tonnes) Production of crude steel 1,419 1,445 -1.8% 1,449 -2.1% 2,864 2,967 -3.5% Shipments of steel 1,356 1,431 -5.2% 1,340 1.2% 2,788 2,775 0.5% Domestic market 1,163 1,079 7.8% 1,175 -1.0% 2,242 2,340 -4.2% Exports 194 352 -44.9% 166 16.9% 546 434 25.8% Shipments of long steel 940 972 -3.3% 934 0.6% 1,912 1,921 -0.5% Domestic market 822 781 5.2% 793 3.7% 1,602 1,536 4.3% Exports 118 192 -38.5% 141 -16.3% 310 386 -19.7% Shipments of flat steel 417 459 -9.2% 406 2.7% 876 854 2.6% Domestic market 341 298 14.4% 382 -10.7% 639 805 -20.6% Exports 76 160 -52.5% 24 216.7% 236 50 372.0% |
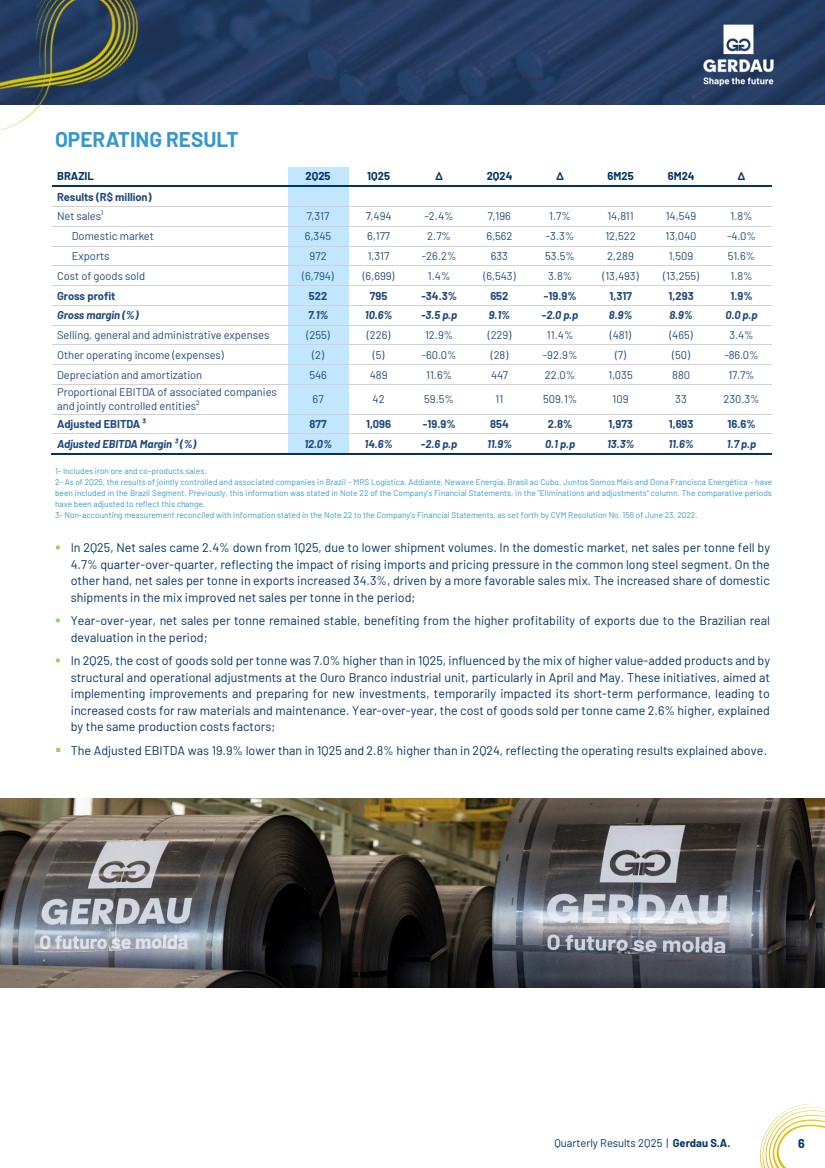
| Quarterly Results 2Q25 | Gerdau S.A. 6 OPERATING RESULT 1- Includes iron ore and co-products sales. 2- As of 2Q25, the results of jointly controlled and associated companies in Brazil - MRS Logística, Addiante, Newave Energia, Brasil ao Cubo, Juntos Somos Mais and Dona Francisca Energética - have been included in the Brazil Segment. Previously, this information was stated in Note 22 of the Company's Financial Statements, in the "Eliminations and adjustments" column. The comparative periods have been adjusted to reflect this change. 3- Non-accounting measurement reconciled with information stated in the Note 22 to the Company’s Financial Statements, as set forth by CVM Resolution No. 156 of June 23, 2022. ▪ In 2Q25, Net sales came 2.4% down from 1Q25, due to lower shipment volumes. In the domestic market, net sales per tonne fell by 4.7% quarter-over-quarter, reflecting the impact of rising imports and pricing pressure in the common long steel segment. On the other hand, net sales per tonne in exports increased 34.3%, driven by a more favorable sales mix. The increased share of domestic shipments in the mix improved net sales per tonne in the period; ▪ Year-over-year, net sales per tonne remained stable, benefiting from the higher profitability of exports due to the Brazilian real devaluation in the period; ▪ In 2Q25, the cost of goods sold per tonne was 7.0% higher than in 1Q25, influenced by the mix of higher value-added products and by structural and operational adjustments at the Ouro Branco industrial unit, particularly in April and May. These initiatives, aimed at implementing improvements and preparing for new investments, temporarily impacted its short-term performance, leading to increased costs for raw materials and maintenance. Year-over-year, the cost of goods sold per tonne came 2.6% higher, explained by the same production costs factors; ▪ The Adjusted EBITDA was 19.9% lower than in 1Q25 and 2.8% higher than in 2Q24, reflecting the operating results explained above. BRAZIL 2Q25 1Q25 ∆ 2Q24 ∆ 6M25 6M24 ∆ Results (R$ million) Net sales¹ 7,317 7,494 -2.4% 7,196 1.7% 14,811 14,549 1.8% Domestic market 6,345 6,177 2.7% 6,562 -3.3% 12,522 13,040 -4.0% Exports 972 1,317 -26.2% 633 53.5% 2,289 1,509 51.6% Cost of goods sold (6,794) (6,699) 1.4% (6,543) 3.8% (13,493) (13,255) 1.8% Gross profit 522 795 -34.3% 652 -19.9% 1,317 1,293 1.9% Gross margin (%) 7.1% 10.6% -3.5 p.p 9.1% -2.0 p.p 8.9% 8.9% 0.0 p.p Selling, general and administrative expenses (255) (226) 12.9% (229) 11.4% (481) (465) 3.4% Other operating income (expenses) (2) (5) -60.0% (28) -92.9% (7) (50) -86.0% Depreciation and amortization 546 489 11.6% 447 22.0% 1,035 880 17.7% Proportional EBITDA of associated companies and jointly controlled entities² 67 42 59.5% 11 509.1% 109 33 230.3% Adjusted EBITDA ³ 877 1,096 -19.9% 854 2.8% 1,973 1,693 16.6% Adjusted EBITDA Margin ³ (%) 12.0% 14.6% -2.6 p.p 11.9% 0.1 p.p 13.3% 11.6% 1.7 p.p |
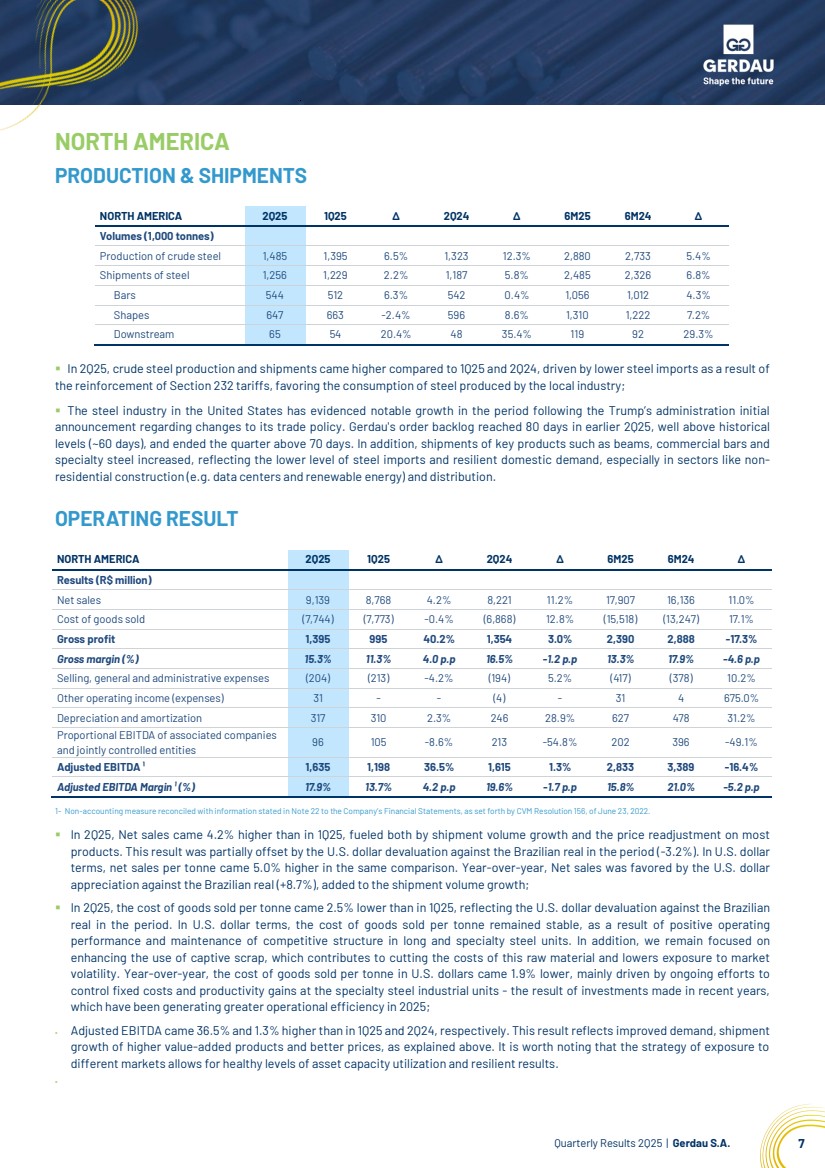
| Quarterly Results 2Q25 | Gerdau S.A. 7 NORTH AMERICA PRODUCTION & SHIPMENTS ▪ In 2Q25, crude steel production and shipments came higher compared to 1Q25 and 2Q24, driven by lower steel imports as a result of the reinforcement of Section 232 tariffs, favoring the consumption of steel produced by the local industry; ▪ The steel industry in the United States has evidenced notable growth in the period following the Trump’s administration initial announcement regarding changes to its trade policy. Gerdau's order backlog reached 80 days in earlier 2Q25, well above historical levels (~60 days), and ended the quarter above 70 days. In addition, shipments of key products such as beams, commercial bars and specialty steel increased, reflecting the lower level of steel imports and resilient domestic demand, especially in sectors like non-residential construction (e.g. data centers and renewable energy) and distribution. OPERATING RESULT 1- Non-accounting measure reconciled with information stated in Note 22 to the Company’s Financial Statements, as setforth by CVM Resolution 156, of June 23, 2022. ▪ In 2Q25, Net sales came 4.2% higher than in 1Q25, fueled both by shipment volume growth and the price readjustment on most products. This result was partially offset by the U.S. dollar devaluation against the Brazilian real in the period (-3.2%). In U.S. dollar terms, net sales per tonne came 5.0% higher in the same comparison. Year-over-year, Net sales was favored by the U.S. dollar appreciation against the Brazilian real (+8.7%), added to the shipment volume growth; ▪ In 2Q25, the cost of goods sold per tonne came 2.5% lower than in 1Q25, reflecting the U.S. dollar devaluation against the Brazilian real in the period. In U.S. dollar terms, the cost of goods sold per tonne remained stable, as a result of positive operating performance and maintenance of competitive structure in long and specialty steel units. In addition, we remain focused on enhancing the use of captive scrap, which contributes to cutting the costs of this raw material and lowers exposure to market volatility. Year-over-year, the cost of goods sold per tonne in U.S. dollars came 1.9% lower, mainly driven by ongoing efforts to control fixed costs and productivity gains at the specialty steel industrial units - the result of investments made in recent years, which have been generating greater operational efficiency in 2025; ▪ Adjusted EBITDA came 36.5% and 1.3% higher than in 1Q25 and 2Q24, respectively. This result reflects improved demand, shipment growth of higher value-added products and better prices, as explained above. It is worth noting that the strategy of exposure to different markets allows for healthy levels of asset capacity utilization and resilient results. ▪ NORTH AMERICA 2Q25 1Q25 ∆ 2Q24 ∆ 6M25 6M24 ∆ Volumes (1,000 tonnes) Production of crude steel 1,485 1,395 6.5% 1,323 12.3% 2,880 2,733 5.4% Shipments of steel 1,256 1,229 2.2% 1,187 5.8% 2,485 2,326 6.8% Bars 544 512 6.3% 542 0.4% 1,056 1,012 4.3% Shapes 647 663 -2.4% 596 8.6% 1,310 1,222 7.2% Downstream 65 54 20.4% 48 35.4% 119 92 29.3% NORTH AMERICA 2Q25 1Q25 ∆ 2Q24 ∆ 6M25 6M24 ∆ Results (R$ million) Net sales 9,139 8,768 4.2% 8,221 11.2% 17,907 16,136 11.0% Cost of goods sold (7,744) (7,773) -0.4% (6,868) 12.8% (15,518) (13,247) 17.1% Gross profit 1,395 995 40.2% 1,354 3.0% 2,390 2,888 -17.3% Gross margin (%) 15.3% 11.3% 4.0 p.p 16.5% -1.2 p.p 13.3% 17.9% -4.6 p.p Selling, general and administrative expenses (204) (213) -4.2% (194) 5.2% (417) (378) 10.2% Other operating income (expenses) 31 - - (4) - 31 4 675.0% Depreciation and amortization 317 310 2.3% 246 28.9% 627 478 31.2% Proportional EBITDA of associated companies and jointly controlled entities 96 105 -8.6% 213 -54.8% 202 396 -49.1% Adjusted EBITDA ¹ 1,635 1,198 36.5% 1,615 1.3% 2,833 3,389 -16.4% Adjusted EBITDA Margin ¹ (%) 17.9% 13.7% 4.2 p.p 19.6% -1.7 p.p 15.8% 21.0% -5.2 p.p |
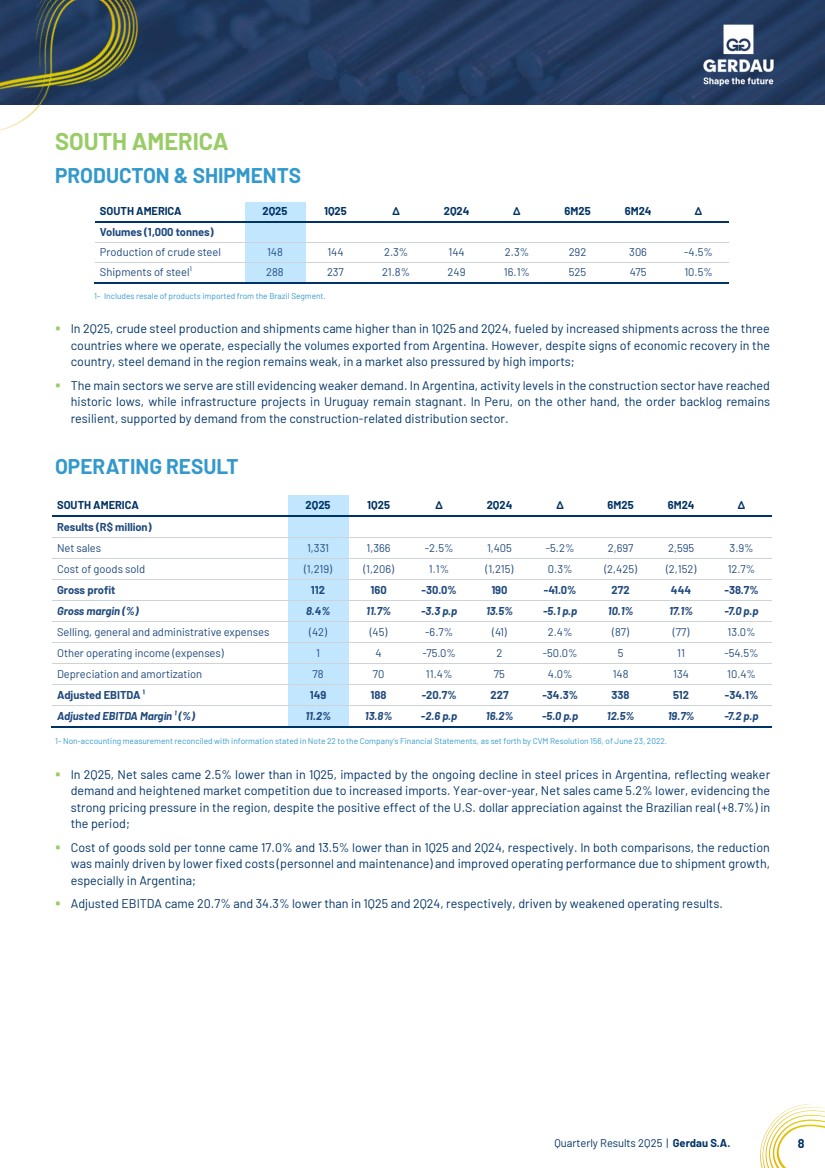
| Quarterly Results 2Q25 | Gerdau S.A. 8 SOUTH AMERICA PRODUCTON & SHIPMENTS 1- Includes resale of products imported from the Brazil Segment. ▪ In 2Q25, crude steel production and shipments came higher than in 1Q25 and 2Q24, fueled by increased shipments across the three countries where we operate, especially the volumes exported from Argentina. However, despite signs of economic recovery in the country, steel demand in the region remains weak, in a market also pressured by high imports; ▪ The main sectors we serve are still evidencing weaker demand. In Argentina, activity levels in the construction sector have reached historic lows, while infrastructure projects in Uruguay remain stagnant. In Peru, on the other hand, the order backlog remains resilient, supported by demand from the construction-related distribution sector. OPERATING RESULT 1- Non-accounting measurementreconciled with information stated inNote 22 to the Company’s Financial Statements, as setforth by CVM Resolution 156, of June 23, 2022. ▪ In 2Q25, Net sales came 2.5% lower than in 1Q25, impacted by the ongoing decline in steel prices in Argentina, reflecting weaker demand and heightened market competition due to increased imports. Year-over-year, Net sales came 5.2% lower, evidencing the strong pricing pressure in the region, despite the positive effect of the U.S. dollar appreciation against the Brazilian real (+8.7%) in the period; ▪ Cost of goods sold per tonne came 17.0% and 13.5% lower than in 1Q25 and 2Q24, respectively. In both comparisons, the reduction was mainly driven by lower fixed costs (personnel and maintenance) and improved operating performance due to shipment growth, especially in Argentina; ▪ Adjusted EBITDA came 20.7% and 34.3% lower than in 1Q25 and 2Q24, respectively, driven by weakened operating results. SOUTH AMERICA 2Q25 1Q25 ∆ 2Q24 ∆ 6M25 6M24 ∆ Volumes (1,000 tonnes) Production of crude steel 148 144 2.3% 144 2.3% 292 306 -4.5% Shipments of steel¹ 288 237 21.8% 249 16.1% 525 475 10.5% SOUTH AMERICA 2Q25 1Q25 ∆ 2Q24 ∆ 6M25 6M24 ∆ Results (R$ million) Net sales 1,331 1,366 -2.5% 1,405 -5.2% 2,697 2,595 3.9% Cost of goods sold (1,219) (1,206) 1.1% (1,215) 0.3% (2,425) (2,152) 12.7% Gross profit 112 160 -30.0% 190 -41.0% 272 444 -38.7% Gross margin (%) 8.4% 11.7% -3.3 p.p 13.5% -5.1 p.p 10.1% 17.1% -7.0 p.p Selling, general and administrative expenses (42) (45) -6.7% (41) 2.4% (87) (77) 13.0% Other operating income (expenses) 1 4 -75.0% 2 -50.0% 5 11 -54.5% Depreciation and amortization 78 70 11.4% 75 4.0% 148 134 10.4% Adjusted EBITDA ¹ 149 188 -20.7% 227 -34.3% 338 512 -34.1% Adjusted EBITDA Margin ¹ (%) 11.2% 13.8% -2.6 p.p 16.2% -5.0 p.p 12.5% 19.7% -7.2 p.p |
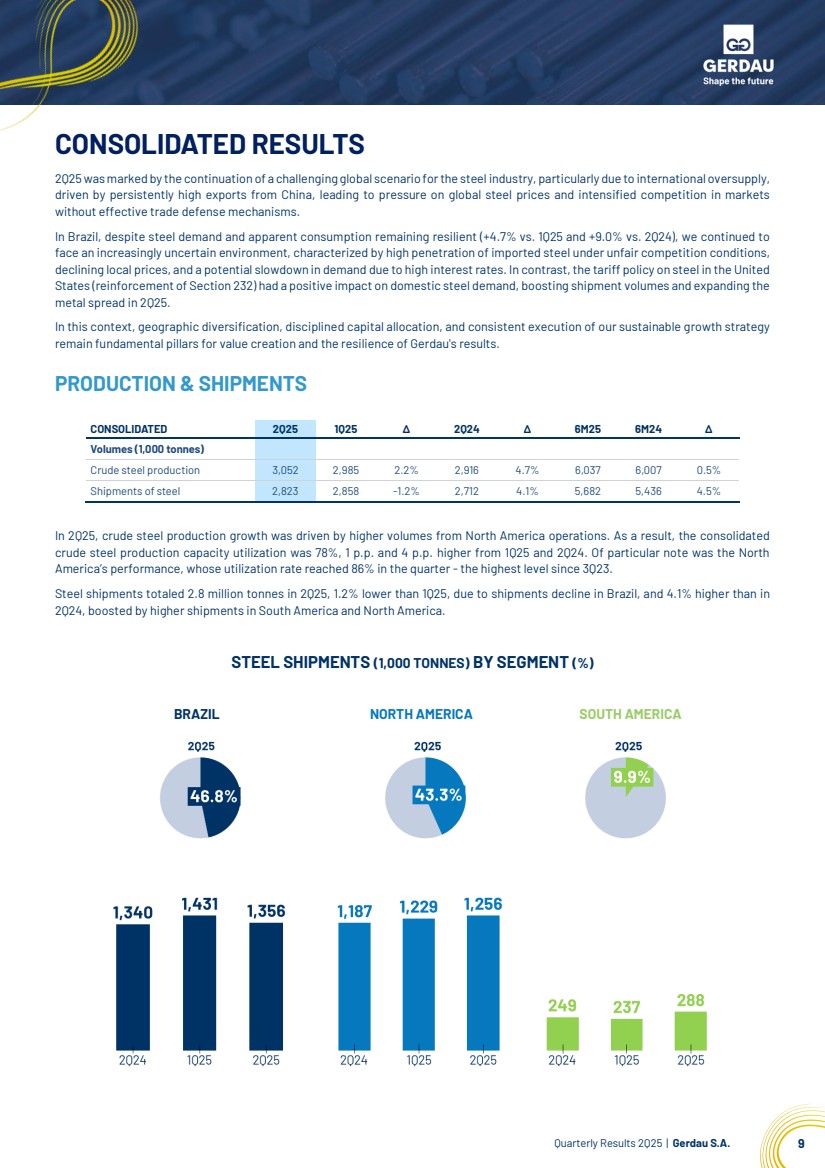
| Quarterly Results 2Q25 | Gerdau S.A. 9 CONSOLIDATED RESULTS 2Q25 was marked by the continuation of a challenging global scenario for the steel industry, particularly due to international oversupply, driven by persistently high exports from China, leading to pressure on global steel prices and intensified competition in markets without effective trade defense mechanisms. In Brazil, despite steel demand and apparent consumption remaining resilient (+4.7% vs. 1Q25 and +9.0% vs. 2Q24), we continued to face an increasingly uncertain environment, characterized by high penetration of imported steel under unfair competition conditions, declining local prices, and a potential slowdown in demand due to high interest rates. In contrast, the tariff policy on steel in the United States (reinforcement of Section 232) had a positive impact on domestic steel demand, boosting shipment volumes and expanding the metal spread in 2Q25. In this context, geographic diversification, disciplined capital allocation, and consistent execution of our sustainable growth strategy remain fundamental pillars for value creation and the resilience of Gerdau's results. PRODUCTION & SHIPMENTS CONSOLIDATED 2Q25 1Q25 ∆ 2Q24 ∆ 6M25 6M24 ∆ Volumes (1,000 tonnes) Crude steel production 3,052 2,985 2.2% 2,916 4.7% 6,037 6,007 0.5% Shipments of steel 2,823 2,858 -1.2% 2,712 4.1% 5,682 5,436 4.5% In 2Q25, crude steel production growth was driven by higher volumes from North America operations. As a result, the consolidated crude steel production capacity utilization was 78%, 1 p.p. and 4 p.p. higher from 1Q25 and 2Q24. Of particular note was the North America’s performance, whose utilization rate reached 86% in the quarter - the highest level since 3Q23. Steel shipments totaled 2.8 million tonnes in 2Q25, 1.2% lower than 1Q25, due to shipments decline in Brazil, and 4.1% higher than in 2Q24, boosted by higher shipments in South America and North America. STEEL SHIPMENTS (1,000 TONNES) BY SEGMENT (%) BRAZIL NORTH AMERICA SOUTH AMERICA |
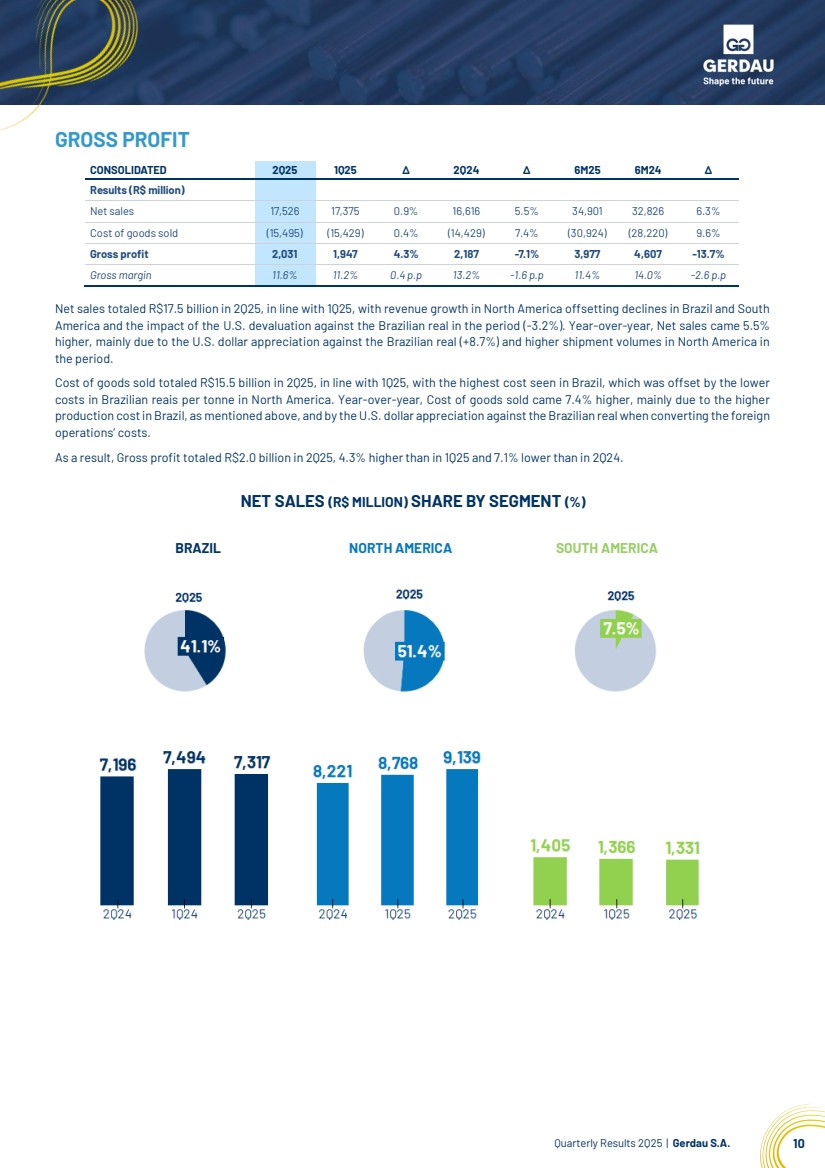
| Quarterly Results 2Q25 | Gerdau S.A. 10 GROSS PROFIT Net sales totaled R$17.5 billion in 2Q25, in line with 1Q25, with revenue growth in North America offsetting declines in Brazil and South America and the impact of the U.S. devaluation against the Brazilian real in the period (-3.2%). Year-over-year, Net sales came 5.5% higher, mainly due to the U.S. dollar appreciation against the Brazilian real (+8.7%) and higher shipment volumes in North America in the period. Cost of goods sold totaled R$15.5 billion in 2Q25, in line with 1Q25, with the highest cost seen in Brazil, which was offset by the lower costs in Brazilian reais per tonne in North America. Year-over-year, Cost of goods sold came 7.4% higher, mainly due to the higher production cost in Brazil, as mentioned above, and by the U.S. dollar appreciation against the Brazilian real when converting the foreign operations’ costs. As a result, Gross profit totaled R$2.0 billion in 2Q25, 4.3% higher than in 1Q25 and 7.1% lower than in 2Q24. NET SALES (R$ MILLION) SHARE BY SEGMENT (%) CONSOLIDATED 2Q25 1Q25 ∆ 2Q24 ∆ 6M25 6M24 ∆ Results (R$ million) Net sales 17,526 17,375 0.9% 16,616 5.5% 34,901 32,826 6.3% Cost of goods sold (15,495) (15,429) 0.4% (14,429) 7.4% (30,924) (28,220) 9.6% Gross profit 2,031 1,947 4.3% 2,187 -7.1% 3,977 4,607 -13.7% Gross margin 11.6% 11.2% 0.4 p.p 13.2% -1.6 p.p 11.4% 14.0% -2.6 p.p BRAZIL NORTH AMERICA SOUTH AMERICA |
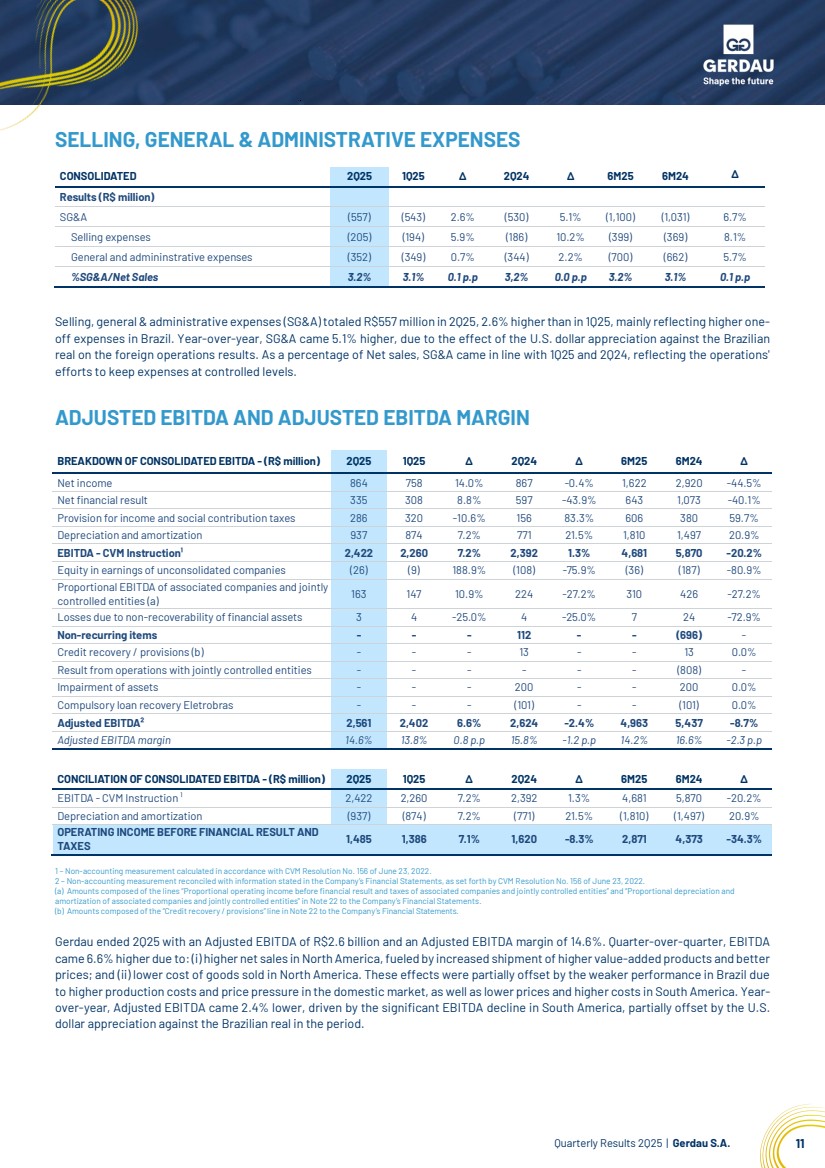
| Quarterly Results 2Q25 | Gerdau S.A. 11 SELLING, GENERAL & ADMINISTRATIVE EXPENSES Selling, general & administrative expenses (SG&A) totaled R$557 million in 2Q25, 2.6% higher than in 1Q25, mainly reflecting higher one-off expenses in Brazil. Year-over-year, SG&A came 5.1% higher, due to the effect of the U.S. dollar appreciation against the Brazilian real on the foreign operations results. As a percentage of Net sales, SG&A came in line with 1Q25 and 2Q24, reflecting the operations' efforts to keep expenses at controlled levels. ADJUSTED EBITDA AND ADJUSTED EBITDA MARGIN 1 – Non-accounting measurement calculated in accordance with CVM Resolution No. 156 of June 23, 2022. 2 – Non-accounting measurement reconciled with information stated in the Company’s Financial Statements, as set forth by CVM Resolution No. 156 of June 23, 2022. (a) Amounts composed of the lines “Proportional operating income before financial result and taxes of associated companies and jointly controlled entities” and “Proportional depreciation and amortization of associated companies and jointly controlled entities" in Note 22 to the Company’s Financial Statements. (b) Amounts composed of the “Creditrecovery / provisions” line inNote 22 to the Company’s Financial Statements. Gerdau ended 2Q25 with an Adjusted EBITDA of R$2.6 billion and an Adjusted EBITDA margin of 14.6%. Quarter-over-quarter, EBITDA came 6.6% higher due to: (i) higher net sales in North America, fueled by increased shipment of higher value-added products and better prices; and (ii) lower cost of goods sold in North America. These effects were partially offset by the weaker performance in Brazil due to higher production costs and price pressure in the domestic market, as well as lower prices and higher costs in South America. Year-over-year, Adjusted EBITDA came 2.4% lower, driven by the significant EBITDA decline in South America, partially offset by the U.S. dollar appreciation against the Brazilian real in the period. CONSOLIDATED 2Q25 1Q25 ∆ 2Q24 ∆ 6M25 6M24 ∆ Results (R$ million) SG&A (557) (543) 2.6% (530) 5.1% (1,100) (1,031) 6.7% Selling expenses (205) (194) 5.9% (186) 10.2% (399) (369) 8.1% General and admininstrative expenses (352) (349) 0.7% (344) 2.2% (700) (662) 5.7% %SG&A/Net Sales 3.2% 3.1% 0.1 p.p 3,2% 0.0 p.p 3.2% 3.1% 0.1 p.p BREAKDOWN OF CONSOLIDATED EBITDA - (R$ million) 2Q25 1Q25 ∆ 2Q24 ∆ 6M25 6M24 ∆ Net income 864 758 14.0% 867 -0.4% 1,622 2,920 -44.5% Net financial result 335 308 8.8% 597 -43.9% 643 1,073 -40.1% Provision for income and social contribution taxes 286 320 -10.6% 156 83.3% 606 380 59.7% Depreciation and amortization 937 874 7.2% 771 21.5% 1,810 1,497 20.9% EBITDA - CVM Instruction¹ 2,422 2,260 7.2% 2,392 1.3% 4,681 5,870 -20.2% Equity in earnings of unconsolidated companies (26) (9) 188.9% (108) -75.9% (36) (187) -80.9% Proportional EBITDA of associated companies and jointly controlled entities (a) 163 147 10.9% 224 -27.2% 310 426 -27.2% Losses due to non-recoverability of financial assets 3 4 -25.0% 4 -25.0% 7 24 -72.9% Non-recurring items - - - 112 - - (696) - Credit recovery / provisions (b) - - - 13 - - 13 0.0% Result from operations with jointly controlled entities - - - - - - (808) - Impairment of assets - - - 200 - - 200 0.0% Compulsory loan recovery Eletrobras - - - (101) - - (101) 0.0% Adjusted EBITDA² 2,561 2,402 6.6% 2,624 -2.4% 4,963 5,437 -8.7% Adjusted EBITDA margin 14.6% 13.8% 0.8 p.p 15.8% -1.2 p.p 14.2% 16.6% -2.3 p.p CONCILIATION OF CONSOLIDATED EBITDA - (R$ million) 2Q25 1Q25 ∆ 2Q24 ∆ 6M25 6M24 ∆ EBITDA - CVM Instruction ¹ 2,422 2,260 7.2% 2,392 1.3% 4,681 5,870 -20.2% Depreciation and amortization (937) (874) 7.2% (771) 21.5% (1,810) (1,497) 20.9% OPERATING INCOME BEFORE FINANCIAL RESULT AND TAXES 1,485 1,386 7.1% 1,620 -8.3% 2,871 4,373 -34.3% |
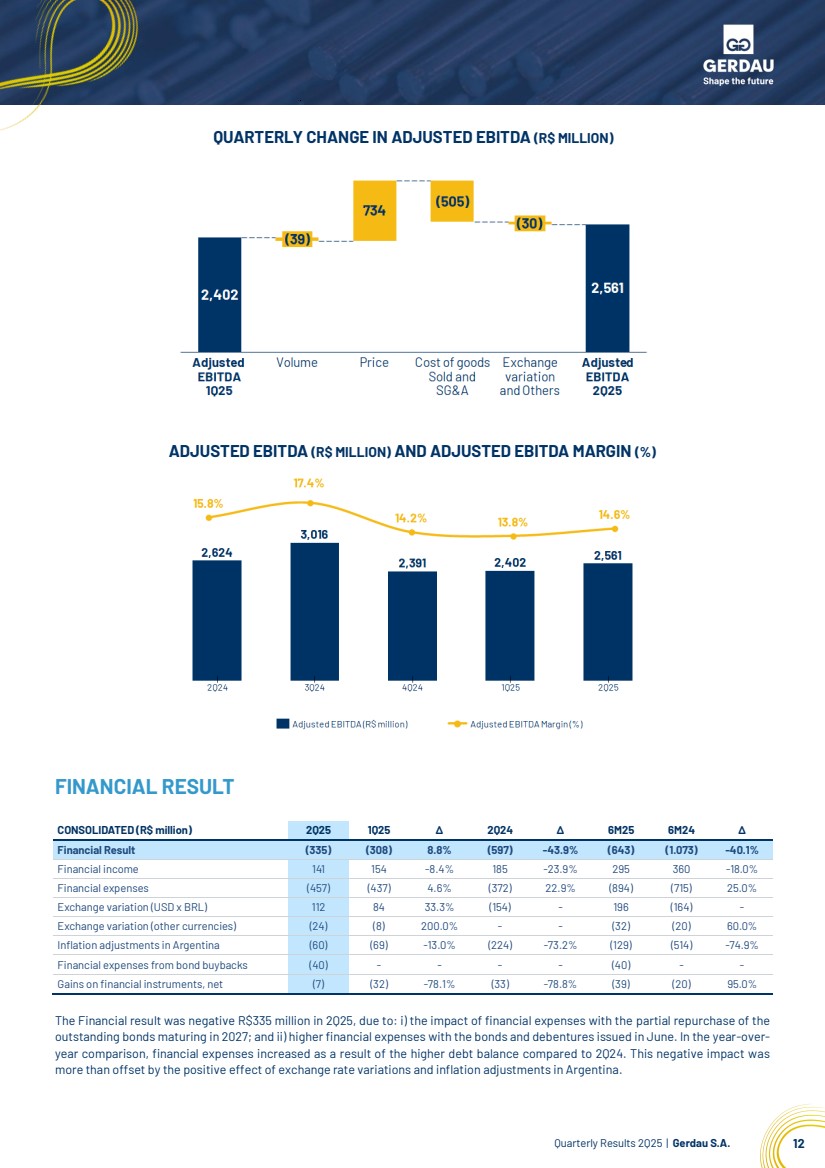
| Quarterly Results 2Q25 | Gerdau S.A. 12 QUARTERLY CHANGE IN ADJUSTED EBITDA (R$ MILLION) ADJUSTED EBITDA (R$ MILLION) AND ADJUSTED EBITDA MARGIN (%) FINANCIAL RESULT CONSOLIDATED (R$ million) 2Q25 1Q25 ∆ 2Q24 ∆ 6M25 6M24 ∆ Financial Result (335) (308) 8.8% (597) -43.9% (643) (1.073) -40.1% Financial income 141 154 -8.4% 185 -23.9% 295 360 -18.0% Financial expenses (457) (437) 4.6% (372) 22.9% (894) (715) 25.0% Exchange variation (USD x BRL) 112 84 33.3% (154) - 196 (164) - Exchange variation (other currencies) (24) (8) 200.0% - - (32) (20) 60.0% Inflation adjustments in Argentina (60) (69) -13.0% (224) -73.2% (129) (514) -74.9% Financial expenses from bond buybacks (40) - - - - (40) - - Gains on financial instruments, net (7) (32) -78.1% (33) -78.8% (39) (20) 95.0% The Financial result was negative R$335 million in 2Q25, due to: i) the impact of financial expenses with the partial repurchase of the outstanding bonds maturing in 2027; and ii) higher financial expenses with the bonds and debentures issued in June. In the year-over-year comparison, financial expenses increased as a result of the higher debt balance compared to 2Q24. This negative impact was more than offset by the positive effect of exchange rate variations and inflation adjustments in Argentina. |
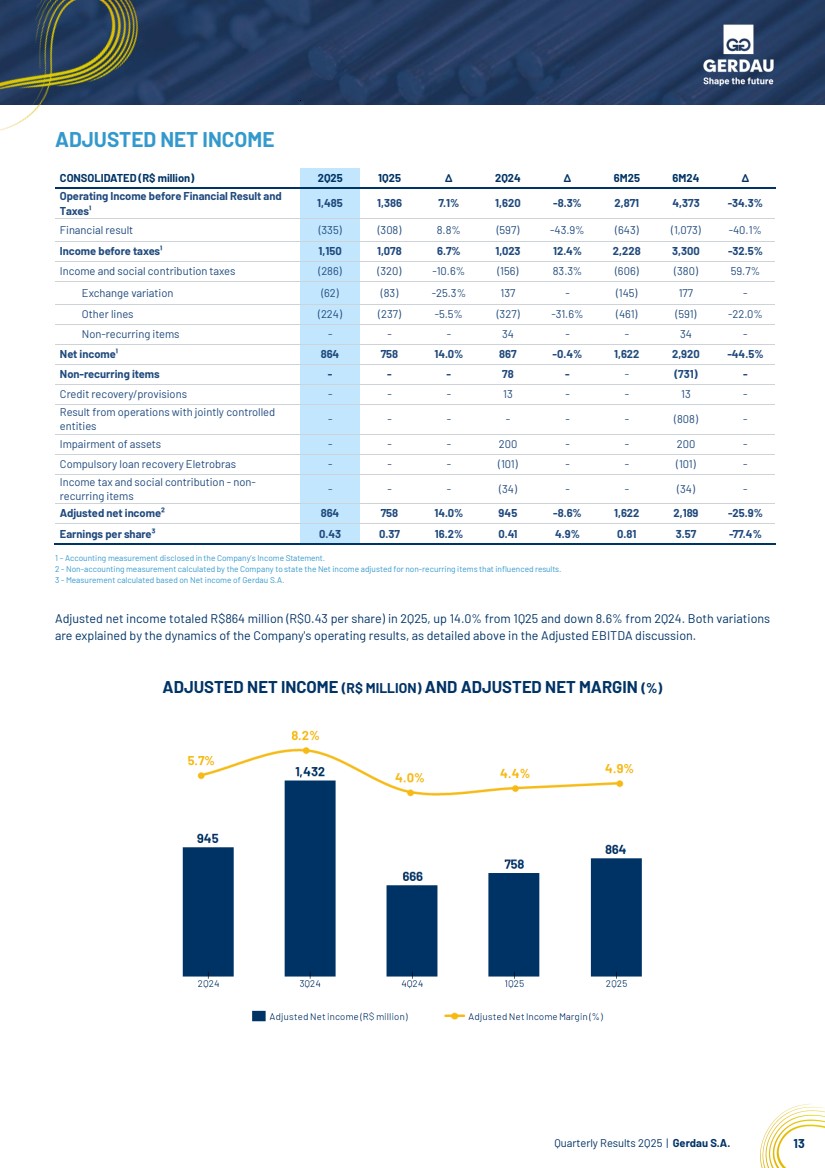
| Quarterly Results 2Q25 | Gerdau S.A. 13 ADJUSTED NET INCOME 1 – Accounting measurement disclosed in the Company’s Income Statement. 2 - Non-accounting measurement calculated by the Company to state the Netincome adjusted for non-recurring items thatinfluenced results. 3 - Measurement calculated based on Net income of Gerdau S.A. Adjusted net income totaled R$864 million (R$0.43 per share) in 2Q25, up 14.0% from 1Q25 and down 8.6% from 2Q24. Both variations are explained by the dynamics of the Company's operating results, as detailed above in the Adjusted EBITDA discussion. ADJUSTED NET INCOME (R$ MILLION) AND ADJUSTED NET MARGIN (%) CONSOLIDATED (R$ million) 2Q25 1Q25 ∆ 2Q24 ∆ 6M25 6M24 ∆ Operating Income before Financial Result and Taxes¹ 1,485 1,386 7.1% 1,620 -8.3% 2,871 4,373 -34.3% Financial result (335) (308) 8.8% (597) -43.9% (643) (1,073) -40.1% Income before taxes¹ 1,150 1,078 6.7% 1,023 12.4% 2,228 3,300 -32.5% Income and social contribution taxes (286) (320) -10.6% (156) 83.3% (606) (380) 59.7% Exchange variation (62) (83) -25.3% 137 - (145) 177 - Other lines (224) (237) -5.5% (327) -31.6% (461) (591) -22.0% Non-recurring items - - - 34 - - 34 - Net income¹ 864 758 14.0% 867 -0.4% 1,622 2,920 -44.5% Non-recurring items - - - 78 - - (731) - Credit recovery/provisions - - - 13 - - 13 - Result from operations with jointly controlled entities - - - - - - (808) - Impairment of assets - - - 200 - - 200 - Compulsory loan recovery Eletrobras - - - (101) - - (101) - Income tax and social contribution - non-recurring items - - - (34) - - (34) - Adjusted net income² 864 758 14.0% 945 -8.6% 1,622 2,189 -25.9% Earnings per share³ 0.43 0.37 16.2% 0.41 4.9% 0.81 3.57 -77.4% |
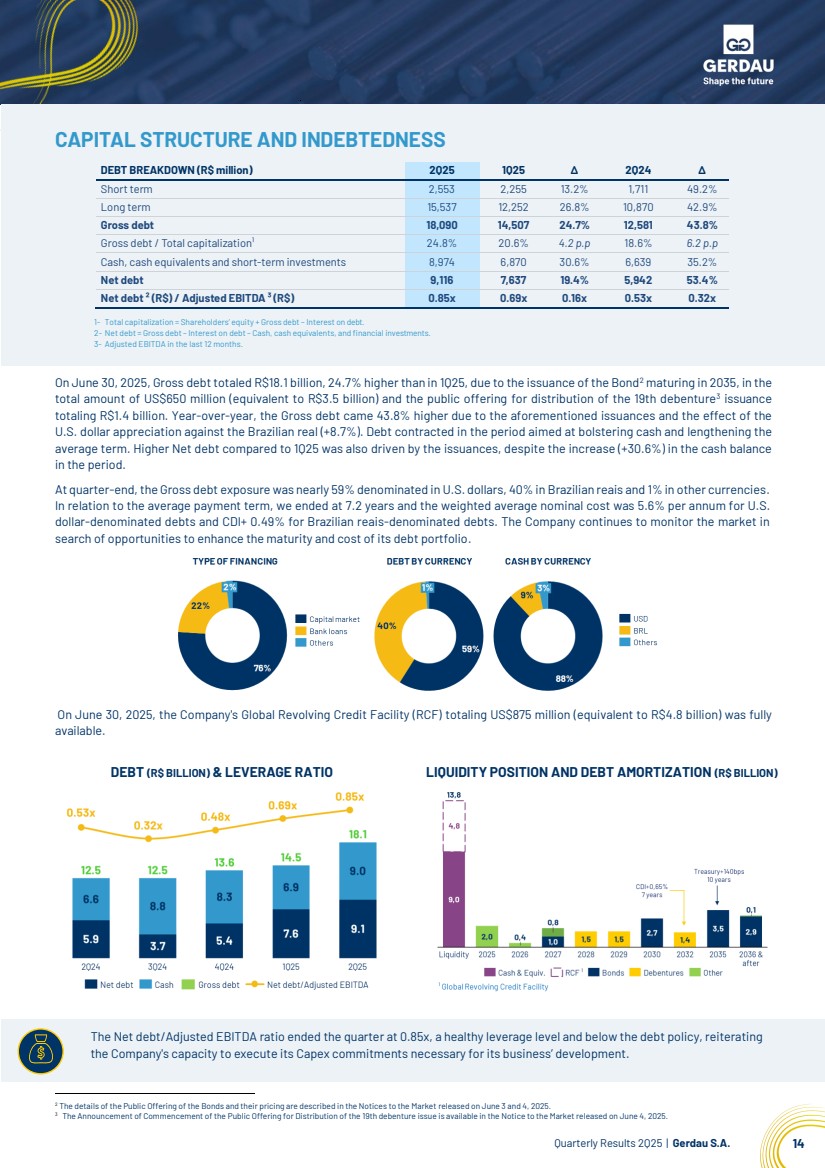
| Quarterly Results 2Q25 | Gerdau S.A. 14 The Net debt/Adjusted EBITDA ratio ended the quarter at 0.85x, a healthy leverage level and below the debt policy, reiterating the Company's capacity to execute its Capex commitments necessary for its business’ development. CAPITAL STRUCTURE AND INDEBTEDNESS DEBT BREAKDOWN (R$ million) 2Q25 1Q25 ∆ 2Q24 ∆ Short term 2,553 2,255 13.2% 1,711 49.2% Long term 15,537 12,252 26.8% 10,870 42.9% Gross debt 18,090 14,507 24.7% 12,581 43.8% Gross debt / Total capitalization¹ 24.8% 20.6% 4.2 p.p 18.6% 6.2 p.p Cash, cash equivalents and short-term investments 8,974 6,870 30.6% 6,639 35.2% Net debt 9,116 7,637 19.4% 5,942 53.4% Net debt ² (R$) / Adjusted EBITDA ³ (R$) 0.85x 0.69x 0.16x 0.53x 0.32x 1- Total capitalization = Shareholders’ equity + Gross debt – Interest on debt. 2- Net debt = Gross debt – Interest on debt – Cash, cash equivalents, and financial investments. 3- Adjusted EBITDA in the last 12 months. On June 30, 2025, Gross debt totaled R$18.1 billion, 24.7% higher than in 1Q25, due to the issuance of the Bond2 maturing in 2035, in the total amount of US$650 million (equivalent to R$3.5 billion) and the public offering for distribution of the 19th debenture3 issuance totaling R$1.4 billion. Year-over-year, the Gross debt came 43.8% higher due to the aforementioned issuances and the effect of the U.S. dollar appreciation against the Brazilian real (+8.7%). Debt contracted in the period aimed at bolstering cash and lengthening the average term. Higher Net debt compared to 1Q25 was also driven by the issuances, despite the increase (+30.6%) in the cash balance in the period. At quarter-end, the Gross debt exposure was nearly 59% denominated in U.S. dollars, 40% in Brazilian reais and 1% in other currencies. In relation to the average payment term, we ended at 7.2 years and the weighted average nominal cost was 5.6% per annum for U.S. dollar-denominated debts and CDI+ 0.49% for Brazilian reais-denominated debts. The Company continues to monitor the market in search of opportunities to enhance the maturity and cost of its debt portfolio. On June 30, 2025, the Company's Global Revolving Credit Facility (RCF) totaling US$875 million (equivalent to R$4.8 billion) was fully available. 2 The details of the Public Offering of the Bonds and their pricing are described in the Notices to the Market released on June 3 and 4, 2025. 3 The Announcement of Commencement of the Public Offering for Distribution of the 19th debenture issue is available in the Notice to the Market released on June 4, 2025. DEBT (R$ BILLION) & LEVERAGE RATIO LIQUIDITY POSITION AND DEBT AMORTIZATION (R$ BILLION) |
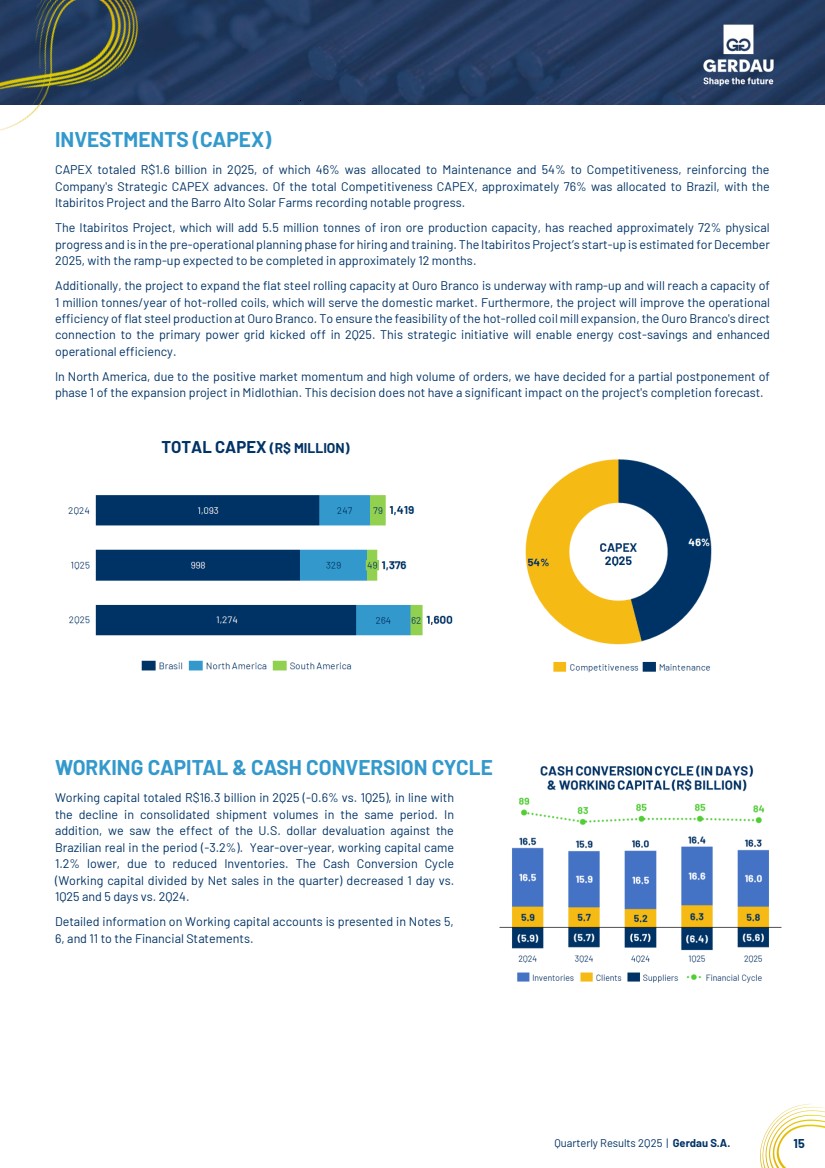
| Quarterly Results 2Q25 | Gerdau S.A. 15 INVESTMENTS (CAPEX) CAPEX totaled R$1.6 billion in 2Q25, of which 46% was allocated to Maintenance and 54% to Competitiveness, reinforcing the Company's Strategic CAPEX advances. Of the total Competitiveness CAPEX, approximately 76% was allocated to Brazil, with the Itabiritos Project and the Barro Alto Solar Farms recording notable progress. The Itabiritos Project, which will add 5.5 million tonnes of iron ore production capacity, has reached approximately 72% physical progress and is in the pre-operational planning phase for hiring and training. The Itabiritos Project’s start-up is estimated for December 2025, with the ramp-up expected to be completed in approximately 12 months. Additionally, the project to expand the flat steel rolling capacity at Ouro Branco is underway with ramp-up and will reach a capacity of 1 million tonnes/year of hot-rolled coils, which will serve the domestic market. Furthermore, the project will improve the operational efficiency of flat steel production at Ouro Branco. To ensure the feasibility of the hot-rolled coil mill expansion, the Ouro Branco's direct connection to the primary power grid kicked off in 2Q25. This strategic initiative will enable energy cost-savings and enhanced operational efficiency. In North America, due to the positive market momentum and high volume of orders, we have decided for a partial postponement of phase 1 of the expansion project in Midlothian. This decision does not have a significant impact on the project's completion forecast. TOTAL CAPEX (R$ MILLION) WORKING CAPITAL & CASH CONVERSION CYCLE Working capital totaled R$16.3 billion in 2Q25 (-0.6% vs. 1Q25), in line with the decline in consolidated shipment volumes in the same period. In addition, we saw the effect of the U.S. dollar devaluation against the Brazilian real in the period (-3.2%). Year-over-year, working capital came 1.2% lower, due to reduced Inventories. The Cash Conversion Cycle (Working capital divided by Net sales in the quarter) decreased 1 day vs. 1Q25 and 5 days vs. 2Q24. Detailed information on Working capital accounts is presented in Notes 5, 6, and 11 to the Financial Statements. |
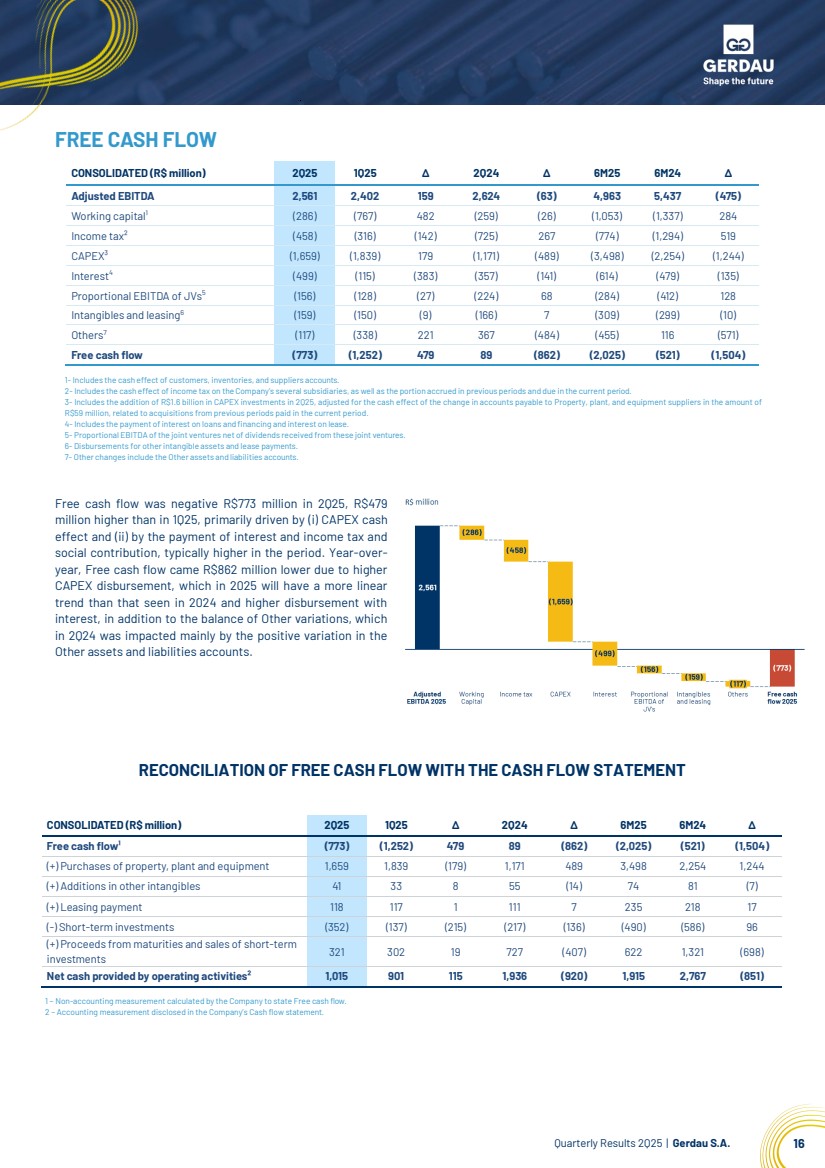
| Quarterly Results 2Q25 | Gerdau S.A. 16 FREE CASH FLOW CONSOLIDATED (R$ million) 2Q25 1Q25 ∆ 2Q24 ∆ 6M25 6M24 ∆ Adjusted EBITDA 2,561 2,402 159 2,624 (63) 4,963 5,437 (475) Working capital¹ (286) (767) 482 (259) (26) (1,053) (1,337) 284 Income tax² (458) (316) (142) (725) 267 (774) (1,294) 519 CAPEX³ (1,659) (1,839) 179 (1,171) (489) (3,498) (2,254) (1,244) Interest4 (499) (115) (383) (357) (141) (614) (479) (135) Proportional EBITDA of JVs5 (156) (128) (27) (224) 68 (284) (412) 128 Intangibles and leasing6 (159) (150) (9) (166) 7 (309) (299) (10) Others7 (117) (338) 221 367 (484) (455) 116 (571) Free cash flow (773) (1,252) 479 89 (862) (2,025) (521) (1,504) 1- Includes the cash effect of customers, inventories, and suppliers accounts. 2- Includes the cash effect of income tax on the Company’s several subsidiaries, as well as the portion accrued in previous periods and due in the current period. 3- Includes the addition of R$1.6 billion in CAPEX investments in 2Q25, adjusted for the cash effect of the change in accounts payable to Property, plant, and equipment suppliers in the amount of R$59 million, related to acquisitions from previous periods paid in the current period. 4- Includes the payment of interest on loans and financing and interest on lease. 5- Proportional EBITDA of the joint ventures net of dividends received from these joint ventures. 6- Disbursements for otherintangible assets and lease payments. 7- Other changes include the Other assets and liabilities accounts. Free cash flow was negative R$773 million in 2Q25, R$479 million higher than in 1Q25, primarily driven by (i) CAPEX cash effect and (ii) by the payment of interest and income tax and social contribution, typically higher in the period. Year-over-year, Free cash flow came R$862 million lower due to higher CAPEX disbursement, which in 2025 will have a more linear trend than that seen in 2024 and higher disbursement with interest, in addition to the balance of Other variations, which in 2Q24 was impacted mainly by the positive variation in the Other assets and liabilities accounts. RECONCILIATION OF FREE CASH FLOW WITH THE CASH FLOW STATEMENT 1 – Non-accounting measurement calculated by the Company to state Free cash flow. 2 – Accounting measurement disclosed in the Company’s Cash flow statement. CONSOLIDATED (R$ million) 2Q25 1Q25 ∆ 2Q24 ∆ 6M25 6M24 ∆ Free cash flow¹ (773) (1,252) 479 89 (862) (2,025) (521) (1,504) (+) Purchases of property, plant and equipment 1,659 1,839 (179) 1,171 489 3,498 2,254 1,244 (+) Additions in other intangibles 41 33 8 55 (14) 74 81 (7) (+) Leasing payment 118 117 1 111 7 235 218 17 (-) Short-term investments (352) (137) (215) (217) (136) (490) (586) 96 (+) Proceeds from maturities and sales of short-term investments 321 302 19 727 (407) 622 1,321 (698) Net cash provided by operating activities² 1,015 901 115 1,936 (920) 1,915 2,767 (851) |
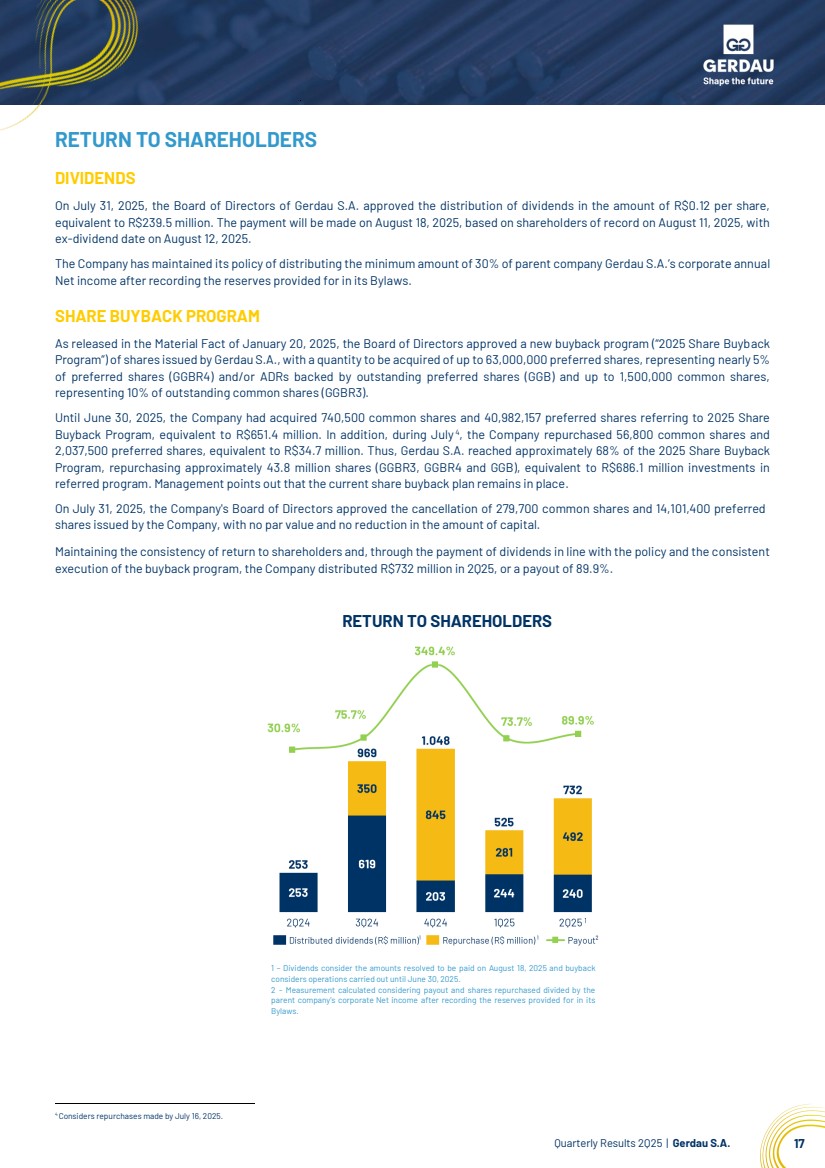
| Quarterly Results 2Q25 | Gerdau S.A. 17 RETURN TO SHAREHOLDERS DIVIDENDS On July 31, 2025, the Board of Directors of Gerdau S.A. approved the distribution of dividends in the amount of R$0.12 per share, equivalent to R$239.5 million. The payment will be made on August 18, 2025, based on shareholders of record on August 11, 2025, with ex-dividend date on August 12, 2025. The Company has maintained its policy of distributing the minimum amount of 30% of parent company Gerdau S.A.’s corporate annual Net income after recording the reserves provided for in its Bylaws. SHARE BUYBACK PROGRAM As released in the Material Fact of January 20, 2025, the Board of Directors approved a new buyback program (“2025 Share Buyback Program”) of shares issued by Gerdau S.A., with a quantity to be acquired of up to 63,000,000 preferred shares, representing nearly 5% of preferred shares (GGBR4) and/or ADRs backed by outstanding preferred shares (GGB) and up to 1,500,000 common shares, representing 10% of outstanding common shares (GGBR3). Until June 30, 2025, the Company had acquired 740,500 common shares and 40,982,157 preferred shares referring to 2025 Share Buyback Program, equivalent to R$651.4 million. In addition, during July2F3F 4 , the Company repurchased 56,800 common shares and 2,037,500 preferred shares, equivalent to R$34.7 million. Thus, Gerdau S.A. reached approximately 68% of the 2025 Share Buyback Program, repurchasing approximately 43.8 million shares (GGBR3, GGBR4 and GGB), equivalent to R$686.1 million investments in referred program. Management points out that the current share buyback plan remains in place. On July 31, 2025, the Company's Board of Directors approved the cancellation of 279,700 common shares and 14,101,400 preferred shares issued by the Company, with no par value and no reduction in the amount of capital. Maintaining the consistency of return to shareholders and, through the payment of dividends in line with the policy and the consistent execution of the buyback program, the Company distributed R$732 million in 2Q25, or a payout of 89.9%. RETURN TO SHAREHOLDERS 1 – Dividends consider the amounts resolved to be paid on August 18, 2025 and buyback considers operations carried out until June 30, 2025. 2 - Measurement calculated considering payout and shares repurchased divided by the parent company’s corporate Net income after recording the reserves provided for in its Bylaws. 4Considers repurchases made by July 16, 2025. |
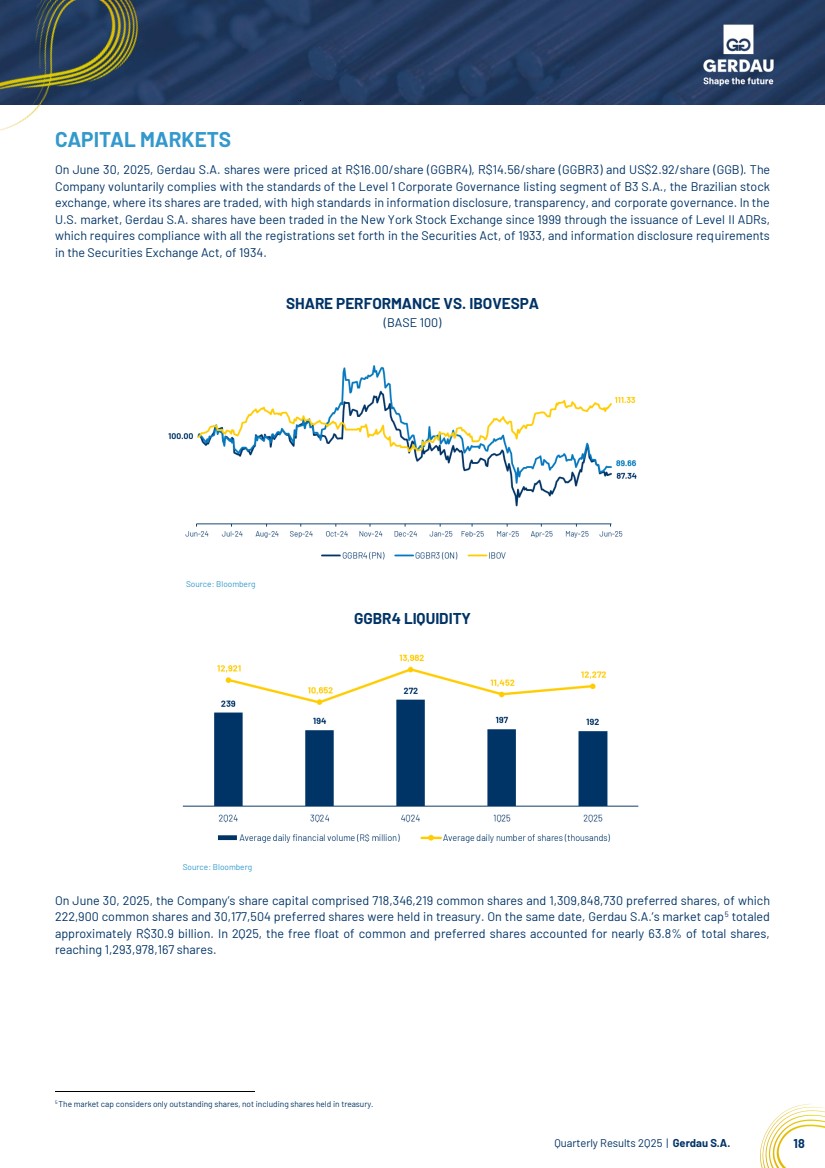
| Quarterly Results 2Q25 | Gerdau S.A. 18 CAPITAL MARKETS On June 30, 2025, Gerdau S.A. shares were priced at R$16.00/share (GGBR4), R$14.56/share (GGBR3) and US$2.92/share (GGB). The Company voluntarily complies with the standards of the Level 1 Corporate Governance listing segment of B3 S.A., the Brazilian stock exchange, where its shares are traded, with high standards in information disclosure, transparency, and corporate governance. In the U.S. market, Gerdau S.A. shares have been traded in the New York Stock Exchange since 1999 through the issuance of Level II ADRs, which requires compliance with all the registrations set forth in the Securities Act, of 1933, and information disclosure requirements in the Securities Exchange Act, of 1934. SHARE PERFORMANCE VS. IBOVESPA (BASE 100) Source: Bloomberg GGBR4 LIQUIDITY Source: Bloomberg On June 30, 2025, the Company’s share capital comprised 718,346,219 common shares and 1,309,848,730 preferred shares, of which 222,900 common shares and 30,177,504 preferred shares were held in treasury. On the same date, Gerdau S.A.’s market cap4F 5 totaled approximately R$30.9 billion. In 2Q25, the free float of common and preferred shares accounted for nearly 63.8% of total shares, reaching 1,293,978,167 shares. 5The market cap considers only outstanding shares, not including shares held in treasury. |
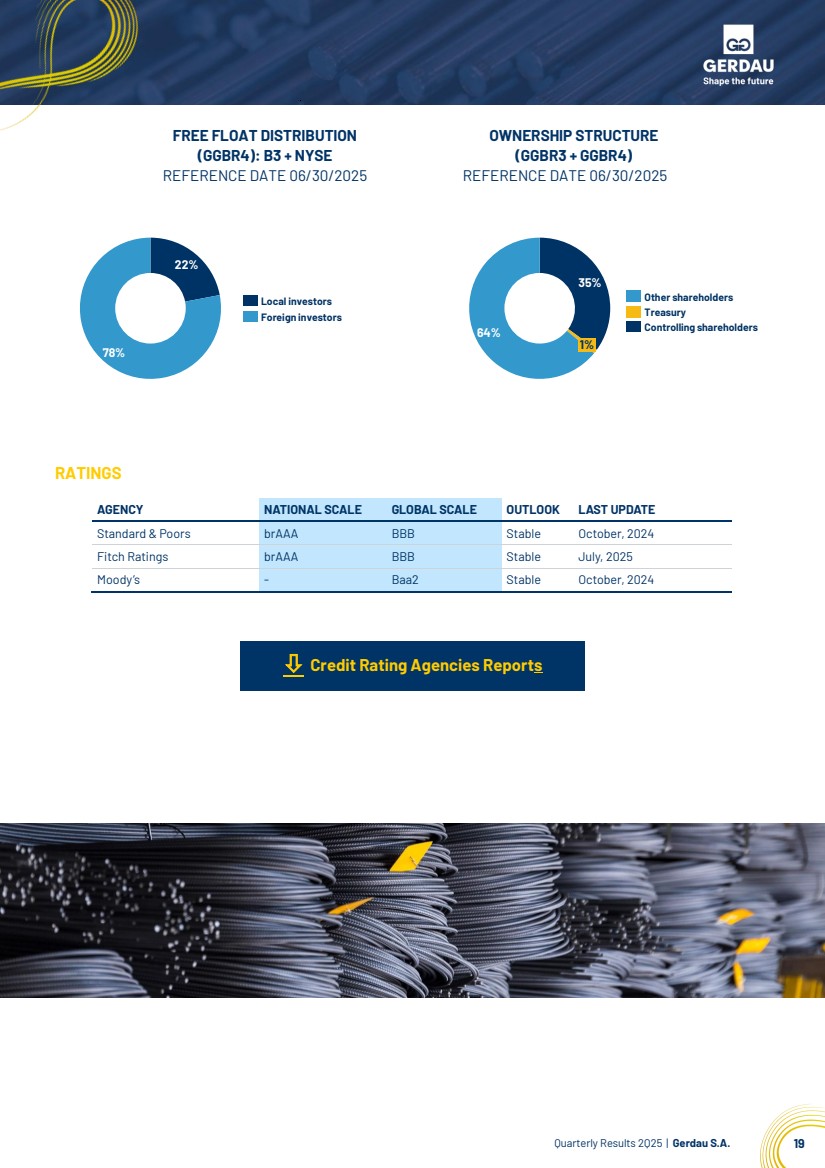
| Quarterly Results 2Q25 | Gerdau S.A. 19 FREE FLOAT DISTRIBUTION (GGBR4): B3 + NYSE REFERENCE DATE 06/30/2025 OWNERSHIP STRUCTURE (GGBR3 + GGBR4) REFERENCE DATE 06/30/2025 RATINGS Credit Rating Agencies Reports 22% 78% Local investors Foreign investors 35% 64% 1% Other shareholders Treasury Controlling shareholders AGENCY NATIONAL SCALE GLOBAL SCALE OUTLOOK LAST UPDATE Standard & Poors brAAA BBB Stable October, 2024 Fitch Ratings brAAA BBB Stable July, 2025 Moody’s - Baa2 Stable October, 2024 |
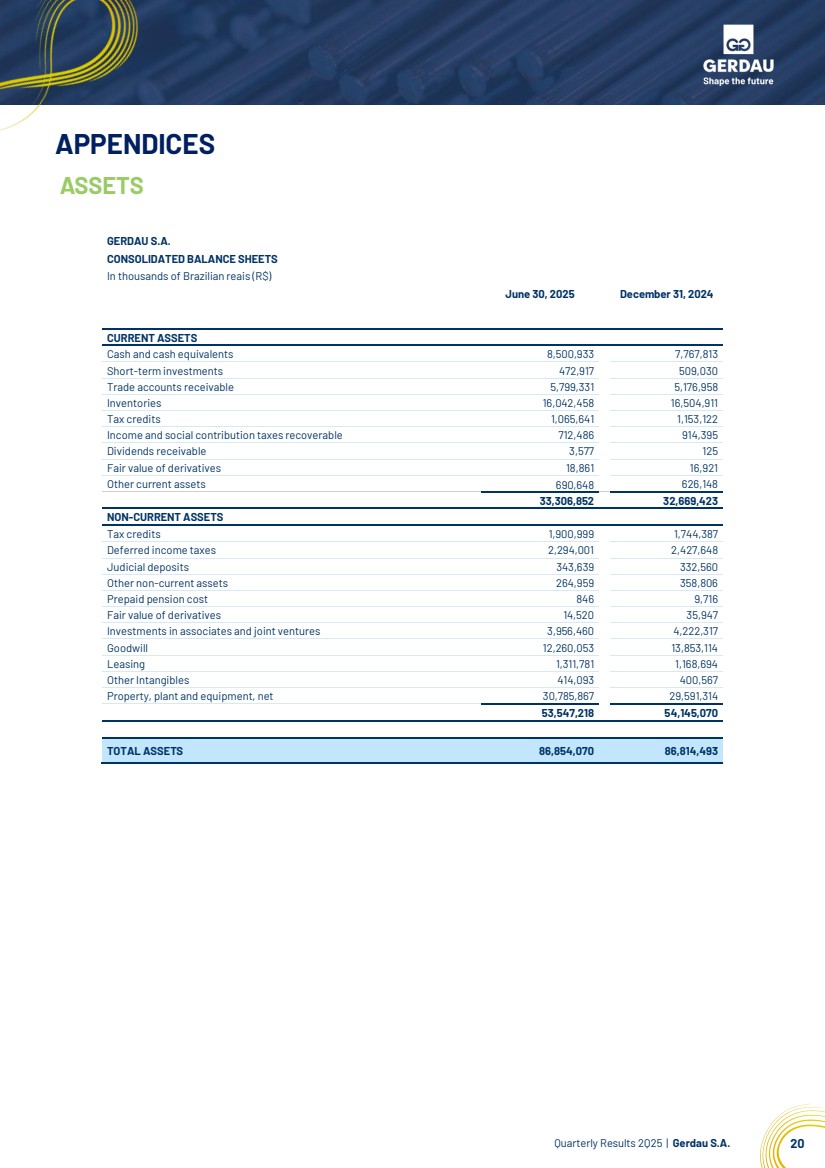
| Quarterly Results 2Q25 | Gerdau S.A. 20 APPENDICES ASSETS GERDAU S.A. CONSOLIDATED BALANCE SHEETS In thousands of Brazilian reais (R$) June 30, 2025 December 31, 2024 CURRENT ASSETS Cash and cash equivalents 8,500,933 7,767,813 Short-term investments 472,917 509,030 Trade accounts receivable 5,799,331 5,176,958 Inventories 16,042,458 16,504,911 Tax credits 1,065,641 1,153,122 Income and social contribution taxes recoverable 712,486 914,395 Dividends receivable 3,577 125 Fair value of derivatives 18,861 16,921 Other current assets 690,648 626,148 33,306,852 32,669,423 NON-CURRENT ASSETS Tax credits 1,900,999 1,744,387 Deferred income taxes 2,294,001 2,427,648 Judicial deposits 343,639 332,560 Other non-current assets 264,959 358,806 Prepaid pension cost 846 9,716 Fair value of derivatives 14,520 35,947 Investments in associates and joint ventures 3,956,460 4,222,317 Goodwill 12,260,053 13,853,114 Leasing 1,311,781 1,168,694 Other Intangibles 414,093 400,567 Property, plant and equipment, net 30,785,867 29,591,314 53,547,218 54,145,070 TOTAL ASSETS 86,854,070 86,814,493 |
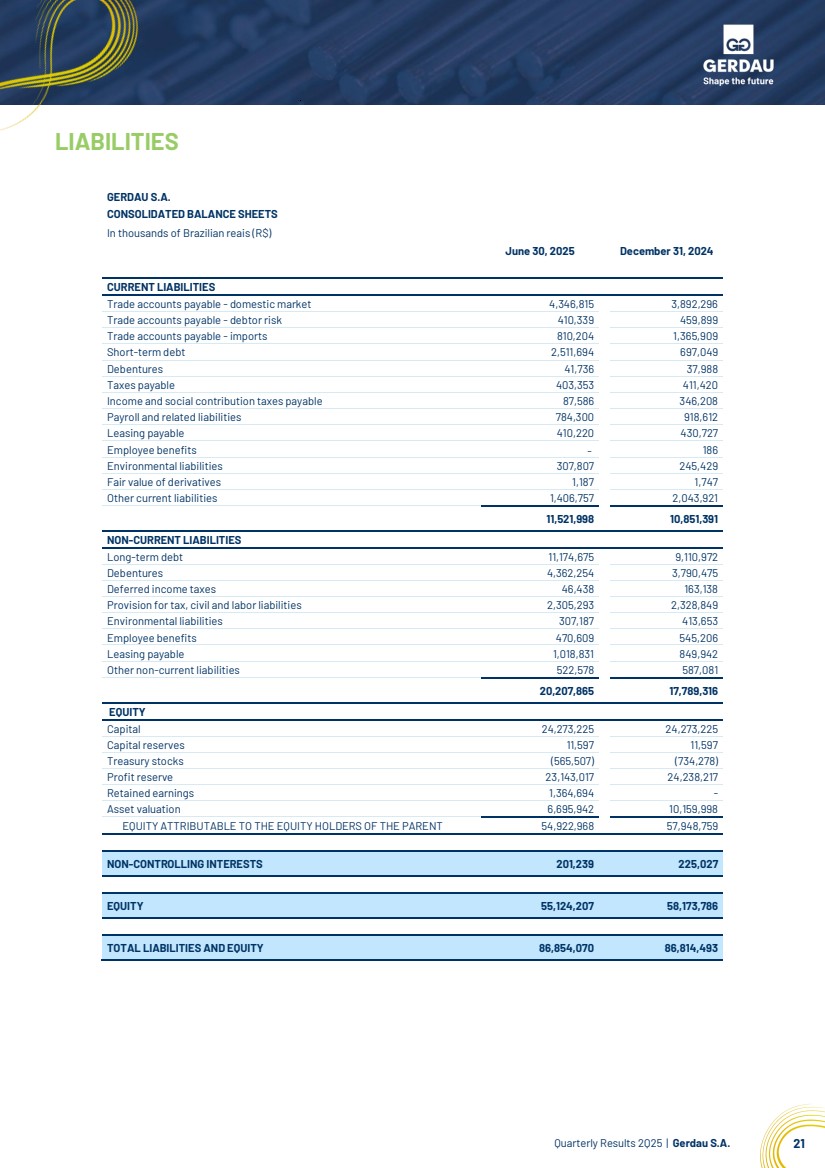
| Quarterly Results 2Q25 | Gerdau S.A. 21 LIABILITIES GERDAU S.A. CONSOLIDATED BALANCE SHEETS In thousands of Brazilian reais (R$) June 30, 2025 December 31, 2024 CURRENT LIABILITIES Trade accounts payable - domestic market 4,346,815 3,892,296 Trade accounts payable - debtor risk 410,339 459,899 Trade accounts payable -imports 810,204 1,365,909 Short-term debt 2,511,694 697,049 Debentures 41,736 37,988 Taxes payable 403,353 411,420 Income and social contribution taxes payable 87,586 346,208 Payroll and related liabilities 784,300 918,612 Leasing payable 410,220 430,727 Employee benefits - 186 Environmental liabilities 307,807 245,429 Fair value of derivatives 1,187 1,747 Other current liabilities 1,406,757 2,043,921 11,521,998 10,851,391 NON-CURRENT LIABILITIES Long-term debt 11,174,675 9,110,972 Debentures 4,362,254 3,790,475 Deferred income taxes 46,438 163,138 Provision for tax, civil and labor liabilities 2,305,293 2,328,849 Environmental liabilities 307,187 413,653 Employee benefits 470,609 545,206 Leasing payable 1,018,831 849,942 Other non-current liabilities 522,578 587,081 20,207,865 17,789,316 EQUITY Capital 24,273,225 24,273,225 Capital reserves 11,597 11,597 Treasury stocks (565,507) (734,278) Profit reserve 23,143,017 24,238,217 Retained earnings 1,364,694 - Asset valuation 6,695,942 10,159,998 EQUITY ATTRIBUTABLE TO THE EQUITY HOLDERS OF THE PARENT 54,922,968 57,948,759 NON-CONTROLLING INTERESTS 201,239 225,027 EQUITY 55,124,207 58,173,786 TOTAL LIABILITIES AND EQUITY 86,854,070 86,814,493 |
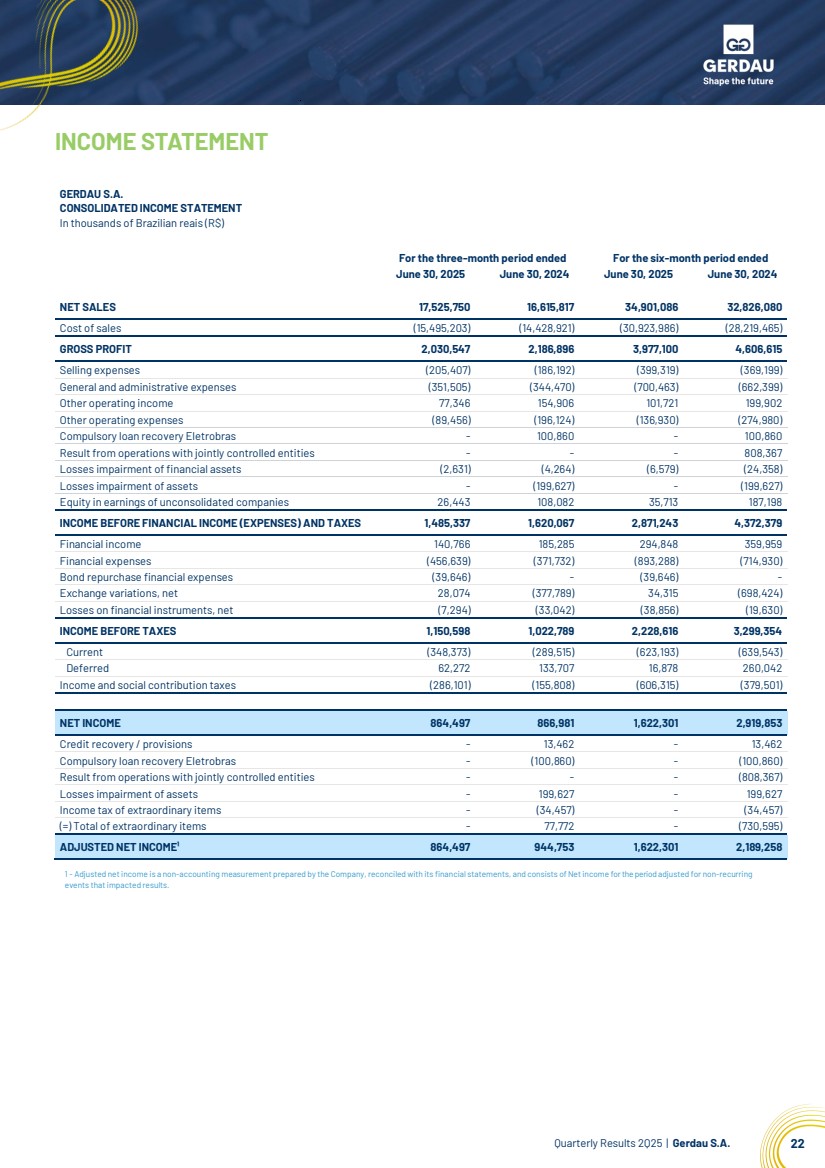
| Quarterly Results 2Q25 | Gerdau S.A. 22 INCOME STATEMENT GERDAU S.A. CONSOLIDATED INCOME STATEMENT In thousands of Brazilian reais (R$) For the three-month period ended For the six-month period ended June 30, 2025 June 30, 2024 June 30, 2025 June 30, 2024 NET SALES 17,525,750 16,615,817 34,901,086 32,826,080 Cost of sales (15,495,203) (14,428,921) (30,923,986) (28,219,465) GROSS PROFIT 2,030,547 2,186,896 3,977,100 4,606,615 Selling expenses (205,407) (186,192) (399,319) (369,199) General and administrative expenses (351,505) (344,470) (700,463) (662,399) Other operating income 77,346 154,906 101,721 199,902 Other operating expenses (89,456) (196,124) (136,930) (274,980) Compulsory loan recovery Eletrobras - 100,860 - 100,860 Result from operations with jointly controlled entities - - - 808,367 Losses impairment of financial assets (2,631) (4,264) (6,579) (24,358) Losses impairment of assets - (199,627) - (199,627) Equity in earnings of unconsolidated companies 26,443 108,082 35,713 187,198 INCOME BEFORE FINANCIAL INCOME (EXPENSES) AND TAXES 1,485,337 1,620,067 2,871,243 4,372,379 Financial income 140,766 185,285 294,848 359,959 Financial expenses (456,639) (371,732) (893,288) (714,930) Bond repurchase financial expenses (39,646) - (39,646) - Exchange variations, net 28,074 (377,789) 34,315 (698,424) Losses on financial instruments, net (7,294) (33,042) (38,856) (19,630) INCOME BEFORE TAXES 1,150,598 1,022,789 2,228,616 3,299,354 Current (348,373) (289,515) (623,193) (639,543) Deferred 62,272 133,707 16,878 260,042 Income and social contribution taxes (286,101) (155,808) (606,315) (379,501) NET INCOME 864,497 866,981 1,622,301 2,919,853 Credit recovery / provisions - 13,462 - 13,462 Compulsory loan recovery Eletrobras - (100,860) - (100,860) Result from operations with jointly controlled entities - - - (808,367) Losses impairment of assets - 199,627 - 199,627 Income tax of extraordinary items - (34,457) - (34,457) (=) Total of extraordinary items - 77,772 - (730,595) ADJUSTED NET INCOME¹ 864,497 944,753 1,622,301 2,189,258 1 - Adjusted netincome is a non-accounting measurement prepared by the Company,reconciled with its financial statements, and consists ofNetincome for the period adjusted for non-recurring events thatimpacted results. |
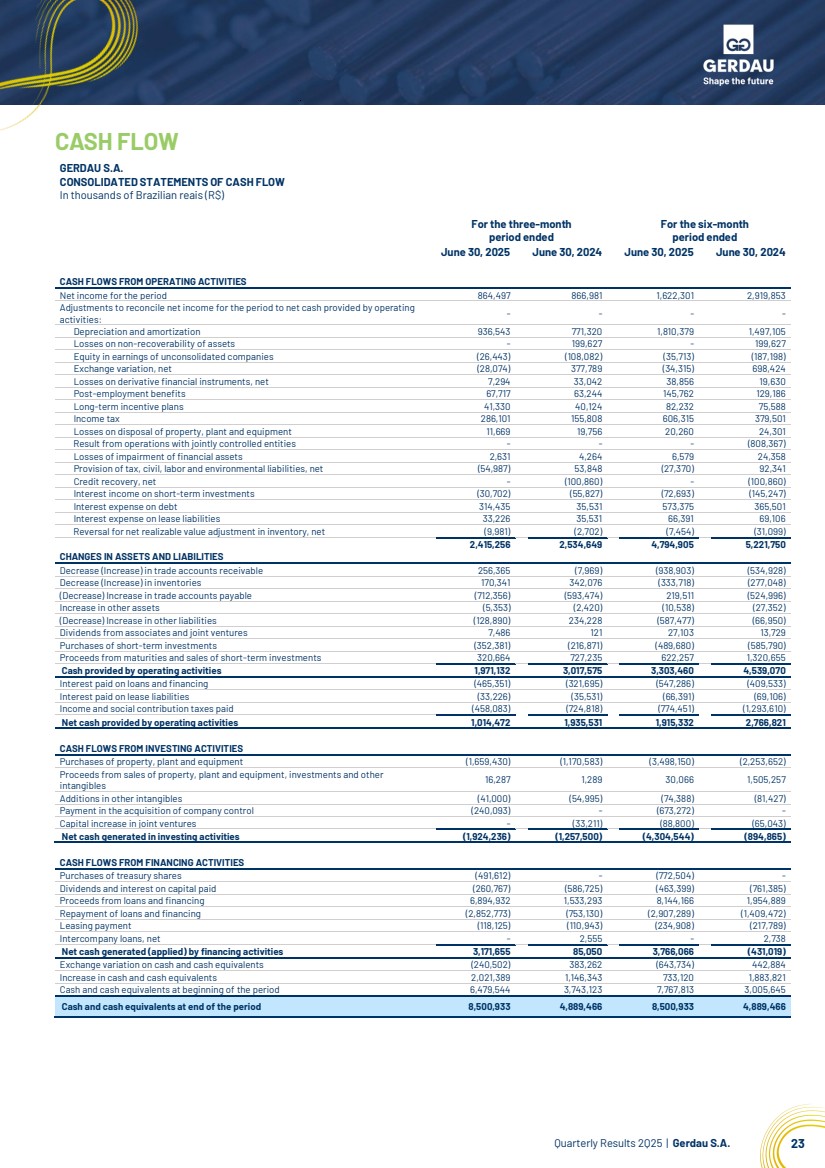
| Quarterly Results 2Q25 | Gerdau S.A. 23 CASH FLOW GERDAU S.A. CONSOLIDATED STATEMENTS OF CASH FLOW In thousands of Brazilian reais (R$) For the three-month period ended For the six-month period ended June 30, 2025 June 30, 2024 June 30, 2025 June 30, 2024 CASH FLOWS FROM OPERATING ACTIVITIES Net income for the period 864,497 866,981 1,622,301 2,919,853 Adjustments to reconcile net income for the period to net cash provided by operating activities: - - - - Depreciation and amortization 936,543 771,320 1,810,379 1,497,105 Losses on non-recoverability of assets - 199,627 - 199,627 Equity in earnings of unconsolidated companies (26,443) (108,082) (35,713) (187,198) Exchange variation, net (28,074) 377,789 (34,315) 698,424 Losses on derivative financial instruments, net 7,294 33,042 38,856 19,630 Post-employment benefits 67,717 63,244 145,762 129,186 Long-term incentive plans 41,330 40,124 82,232 75,588 Income tax 286,101 155,808 606,315 379,501 Losses on disposal of property, plant and equipment 11,669 19,756 20,260 24,301 Result from operations with jointly controlled entities - - - (808,367) Losses of impairment of financial assets 2,631 4,264 6,579 24,358 Provision of tax, civil, labor and environmental liabilities, net (54,987) 53,848 (27,370) 92,341 Credit recovery, net - (100,860) - (100,860) Interest income on short-term investments (30,702) (55,827) (72,693) (145,247) Interest expense on debt 314,435 35,531 573,375 365,501 Interest expense on lease liabilities 33,226 35,531 66,391 69,106 Reversal for net realizable value adjustment in inventory, net (9,981) (2,702) (7,454) (31,099) 2,415,256 2,534,649 4,794,905 5,221,750 CHANGES IN ASSETS AND LIABILITIES Decrease (Increase) in trade accounts receivable 256,365 (7,969) (938,903) (534,928) Decrease (Increase) in inventories 170,341 342,076 (333,718) (277,048) (Decrease) Increase in trade accounts payable (712,356) (593,474) 219,511 (524,996) Increase in other assets (5,353) (2,420) (10,538) (27,352) (Decrease) Increase in other liabilities (128,890) 234,228 (587,477) (66,950) Dividends from associates and joint ventures 7,486 121 27,103 13,729 Purchases of short-term investments (352,381) (216,871) (489,680) (585,790) Proceeds from maturities and sales of short-term investments 320,664 727,235 622,257 1,320,655 Cash provided by operating activities 1,971,132 3,017,575 3,303,460 4,539,070 Interest paid on loans and financing (465,351) (321,695) (547,286) (409,533) Interest paid on lease liabilities (33,226) (35,531) (66,391) (69,106) Income and social contribution taxes paid (458,083) (724,818) (774,451) (1,293,610) Net cash provided by operating activities 1,014,472 1,935,531 1,915,332 2,766,821 CASH FLOWS FROM INVESTING ACTIVITIES Purchases of property, plant and equipment (1,659,430) (1,170,583) (3,498,150) (2,253,652) Proceeds from sales of property, plant and equipment, investments and other intangibles 16,287 1,289 30,066 1,505,257 Additions in other intangibles (41,000) (54,995) (74,388) (81,427) Payment in the acquisition of company control (240,093) - (673,272) - Capital increase in joint ventures - (33,211) (88,800) (65,043) Net cash generated in investing activities (1,924,236) (1,257,500) (4,304,544) (894,865) CASH FLOWS FROM FINANCING ACTIVITIES Purchases of treasury shares (491,612) - (772,504) - Dividends and interest on capital paid (260,767) (586,725) (463,399) (761,385) Proceeds from loans and financing 6,894,932 1,533,293 8,144,166 1,954,889 Repayment of loans and financing (2,852,773) (753,130) (2,907,289) (1,409,472) Leasing payment (118,125) (110,943) (234,908) (217,789) Intercompany loans, net - 2,555 - 2,738 Net cash generated (applied) by financing activities 3,171,655 85,050 3,766,066 (431,019) Exchange variation on cash and cash equivalents (240,502) 383,262 (643,734) 442,884 Increase in cash and cash equivalents 2,021,389 1,146,343 733,120 1,883,821 Cash and cash equivalents at beginning of the period 6,479,544 3,743,123 7,767,813 3,005,645 Cash and cash equivalents at end of the period 8,500,933 4,889,466 8,500,933 4,889,466 |
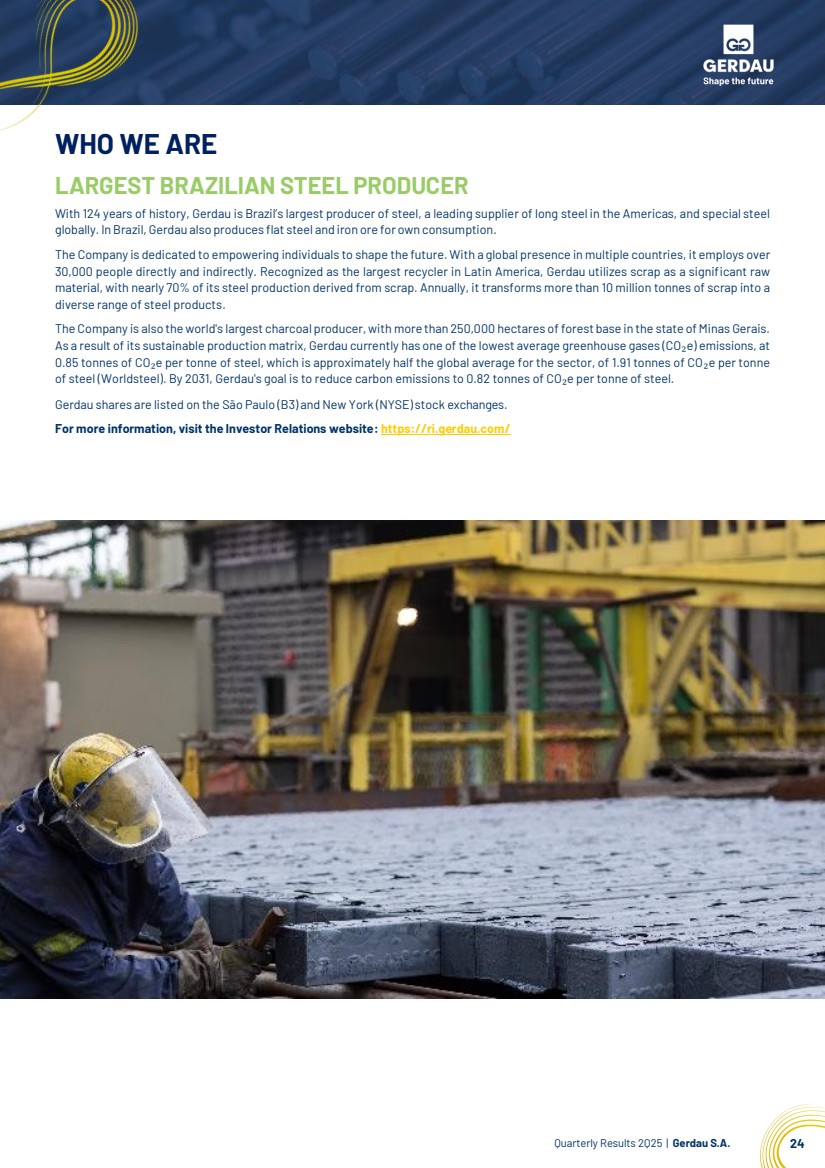
| Quarterly Results 2Q25 | Gerdau S.A. 24 WHO WE ARE LARGEST BRAZILIAN STEEL PRODUCER With 124 years of history, Gerdau is Brazil’s largest producer of steel, a leading supplier of long steel in the Americas, and special steel globally. InBrazil, Gerdau also produces flat steel and iron ore for own consumption. The Company is dedicated to empowering individuals to shape the future. With a global presence in multiple countries, it employs over 30,000 people directly and indirectly. Recognized as the largest recycler in Latin America, Gerdau utilizes scrap as a significant raw material, with nearly 70% of its steel production derived from scrap. Annually, it transforms more than 10 million tonnes of scrap into a diverse range of steel products. The Company is also the world's largest charcoal producer, with more than 250,000 hectares offorest base in the state of Minas Gerais. As a result of its sustainable production matrix, Gerdau currently has one of the lowest average greenhouse gases (CO₂e) emissions, at 0.85 tonnes of CO₂e per tonne of steel, which is approximately half the global average for the sector, of 1.91 tonnes of CO₂e per tonne of steel (Worldsteel). By 2031, Gerdau's goal is to reduce carbon emissions to 0.82 tonnes of CO₂e per tonne of steel. Gerdau shares are listed on the São Paulo (B3) and New York (NYSE) stock exchanges. For more information, visit the Investor Relations website: https://ri.gerdau.com/ |
| IR CONTACTS Investor Relations website: http://ri.gerdau.com/ IR e-mail: inform@gerdau.com Press e-mail: atendimentogerdau.br@bcw-global.com Rafael Japur Vice President and Investor Relations Officer Mariana Velho Dutra IR Manager Ariana De Cesare Renata Albuquerque Arthur Alves Trovo Adriana Costa Siga a Gerdau nas Redes Sociais |