| Confidential and subject to change Par Health Confidential and subject to change Par Health Transaction Overview |

| Confidential and subject to change Par Health Confidential and subject to change Transaction Summary |

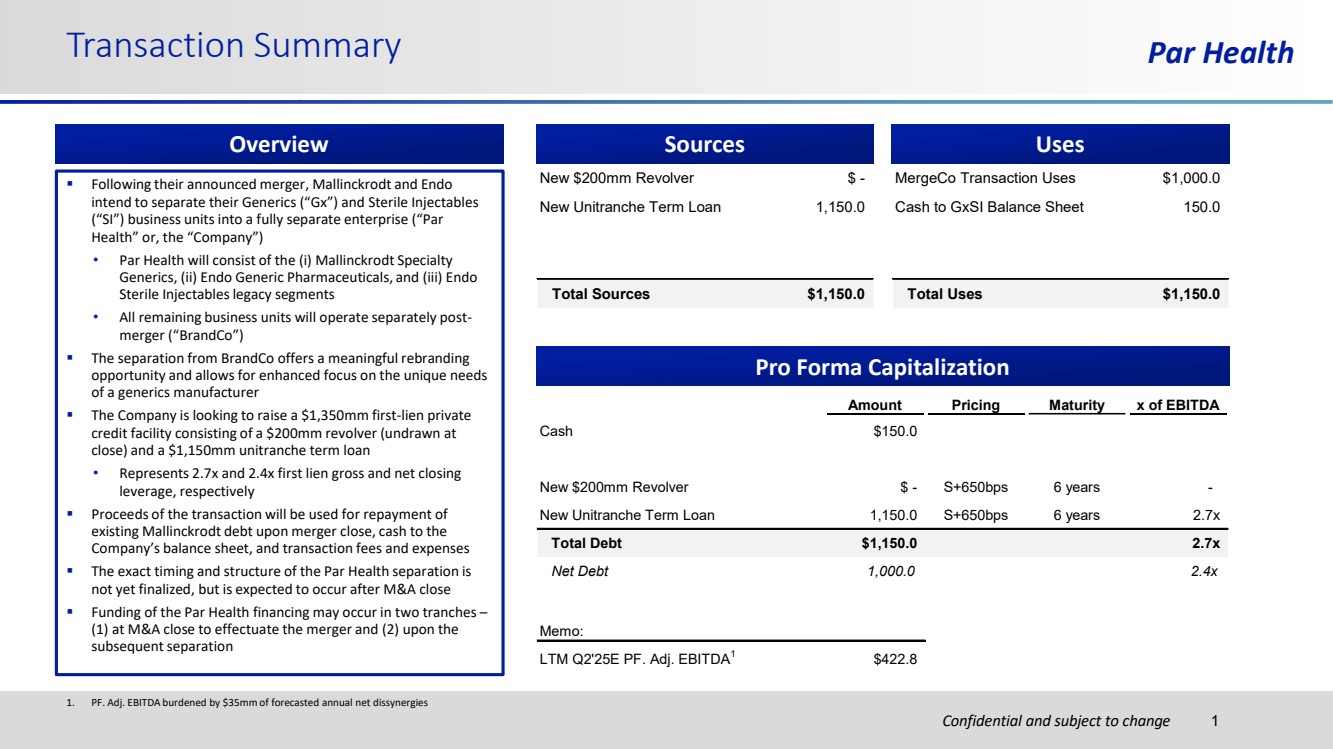
| Confidential and subject to change Par Health 1. PF. Adj. EBITDA burdened by $35mm of forecasted annual net dissynergies Transaction Summary 1 Sources New $200mm Revolver $ - New Unitranche Term Loan 1,150.0 Total Sources $1,150.0 MergeCo Transaction Uses $1,000.0 Cash to GxSI Balance Sheet 150.0 Total Uses $1,150.0 Uses Pro Forma Capitalization Amount Pricing Maturity x of EBITDA Cash $150.0 New $200mm Revolver $ - S+650bps 6 years - New Unitranche Term Loan 1,150.0 S+650bps 6 years 2.7x Total Debt $1,150.0 2.7x Net Debt 1,000.0 2.4x Memo: LTM Q2'25E PF. Adj. EBITDA1 $422.8 Overview ▪ Following their announced merger, Mallinckrodt and Endo intend to separate their Generics (“Gx”) and Sterile Injectables (“SI”) business units into a fully separate enterprise (“Par Health” or, the “Company”) • Par Health will consist of the (i) Mallinckrodt Specialty Generics, (ii) Endo Generic Pharmaceuticals, and (iii) Endo Sterile Injectables legacy segments • All remaining business units will operate separately post-merger (“BrandCo”) ▪ The separation from BrandCo offers a meaningful rebranding opportunity and allows for enhanced focus on the unique needs of a generics manufacturer ▪ The Company is looking to raise a $1,350mm first-lien private credit facility consisting of a $200mm revolver (undrawn at close) and a $1,150mm unitranche term loan • Represents 2.7x and 2.4x first lien gross and net closing leverage, respectively ▪ Proceeds of the transaction will be used for repayment of existing Mallinckrodt debt upon merger close, cash to the Company’s balance sheet, and transaction fees and expenses ▪ The exact timing and structure of the Par Health separation is not yet finalized, but is expected to occur after M&A close ▪ Funding of the Par Health financing may occur in two tranches – (1) at M&A close to effectuate the merger and (2) upon the subsequent separation |
| Confidential and subject to change Par Health Confidential and subject to change Company Overview |

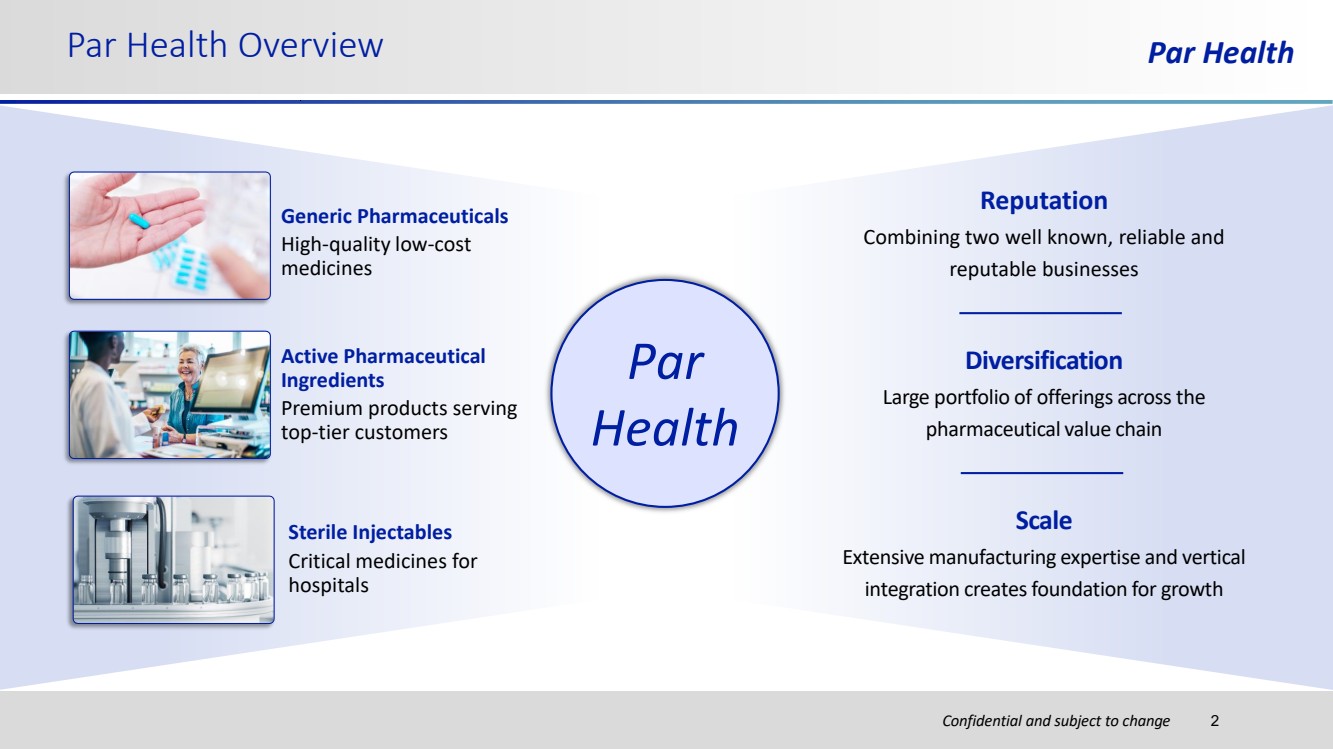
| Confidential and subject to change Par Health Overview Par Health Reputation Combining two well known, reliable and reputable businesses Active Pharmaceutical Ingredients Premium products serving top-tier customers Sterile Injectables Critical medicines for hospitals Generic Pharmaceuticals High-quality low-cost medicines Diversification Large portfolio of offerings across the pharmaceutical value chain Scale Extensive manufacturing expertise and vertical integration creates foundation for growth Par Health 2 |
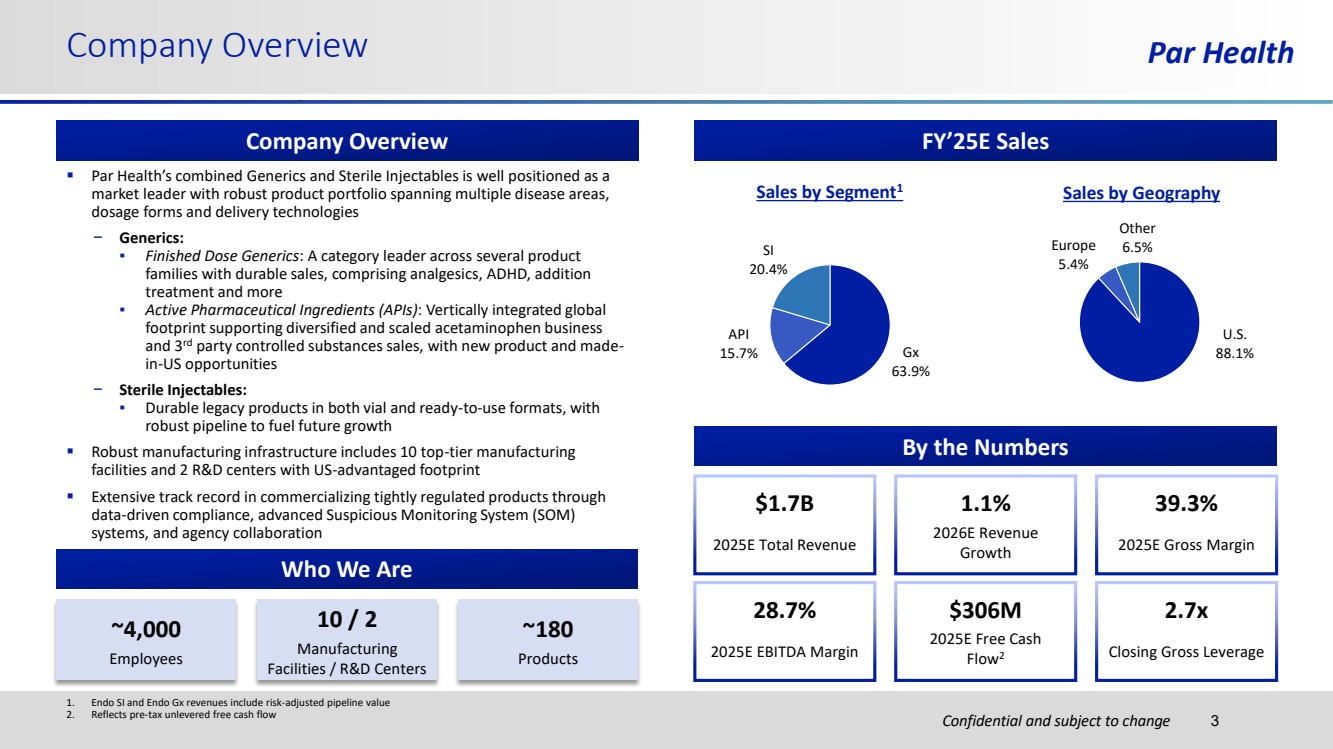
| Confidential and subject to change Par Health ▪ Par Health’s combined Generics and Sterile Injectables is well positioned as a market leader with robust product portfolio spanning multiple disease areas, dosage forms and delivery technologies − Generics: ▪ Finished Dose Generics: A category leader across several product families with durable sales, comprising analgesics, ADHD, addition treatment and more ▪ Active Pharmaceutical Ingredients (APIs): Vertically integrated global footprint supporting diversified and scaled acetaminophen business and 3rd party controlled substances sales, with new product and made-in-US opportunities − Sterile Injectables: ▪ Durable legacy products in both vial and ready-to-use formats, with robust pipeline to fuel future growth ▪ Robust manufacturing infrastructure includes 10 top-tier manufacturing facilities and 2 R&D centers with US-advantaged footprint ▪ Extensive track record in commercializing tightly regulated products through data-driven compliance, advanced Suspicious Monitoring System (SOM) systems, and agency collaboration Company Overview Company Overview Who We Are By the Numbers $306M 2025E Free Cash Flow2 2.7x Closing Gross Leverage 39.3% 2025E Gross Margin 28.7% 2025E EBITDA Margin 1.1% 2026E Revenue Growth ~4,000 Employees 10 / 2 Manufacturing Facilities / R&D Centers ~180 Products $1.7B 2025E Total Revenue 1. Endo SI and Endo Gx revenues include risk-adjusted pipeline value 2. Reflects pre-tax unlevered free cash flow 3 FY’25E Sales Sales by Segment1 Sales by Geography Gx 63.9% API 15.7% SI 20.4% U.S. 88.1% Europe 5.4% Other 6.5% |
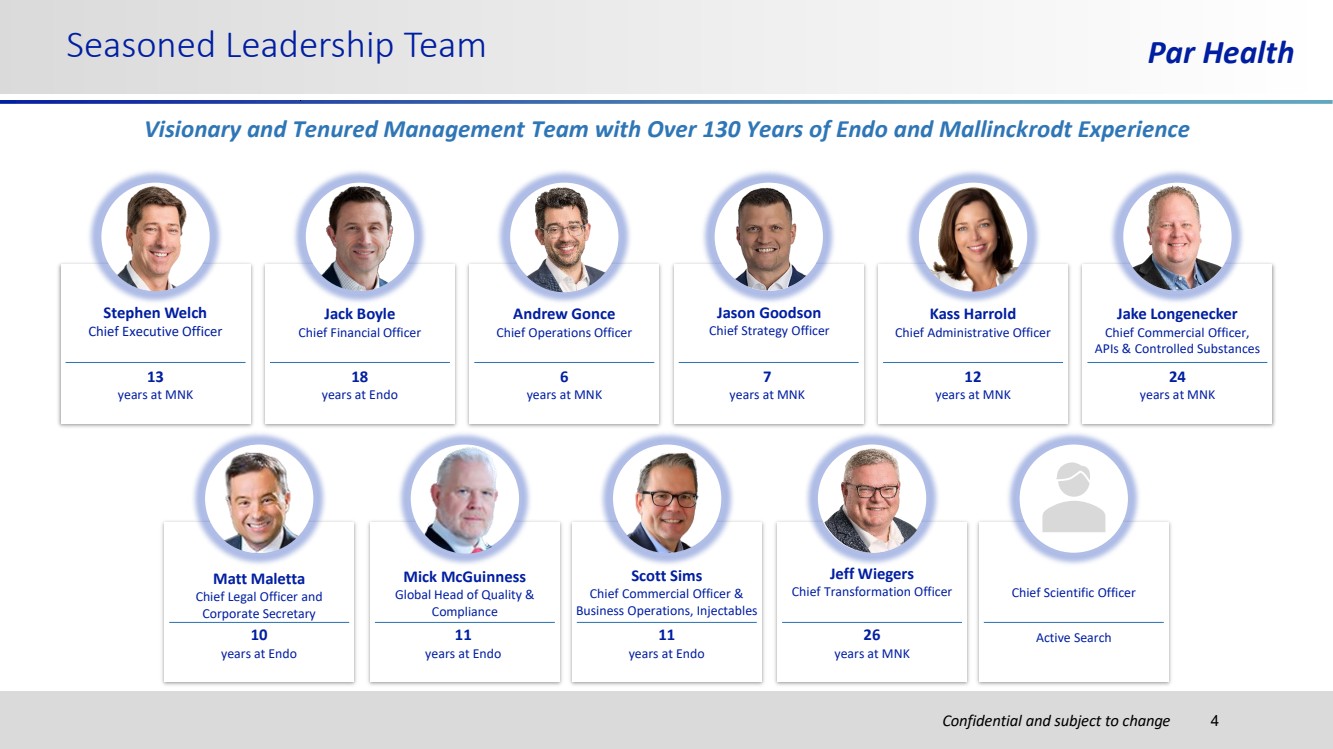
| Confidential and subject to change Seasoned Leadership Team Par Health Stephen Welch Chief Executive Officer 24 years at MNK Jack Boyle Chief Financial Officer Andrew Gonce Chief Operations Officer Jason Goodson Chief Strategy Officer Kass Harrold Chief Administrative Officer Jake Longenecker Chief Commercial Officer, APIs & Controlled Substances Chief Scientific Officer Active Search Matt Maletta Chief Legal Officer and Corporate Secretary Mick McGuinness Global Head of Quality & Compliance Scott Sims Chief Commercial Officer & Business Operations, Injectables Jeff Wiegers Chief Transformation Officer Visionary and Tenured Management Team with Over 130 Years of Endo and Mallinckrodt Experience 12 years at MNK 7 years at MNK 6 years at MNK 18 years at Endo 13 years at MNK 10 years at Endo 11 years at Endo 11 years at Endo 26 years at MNK 4 |
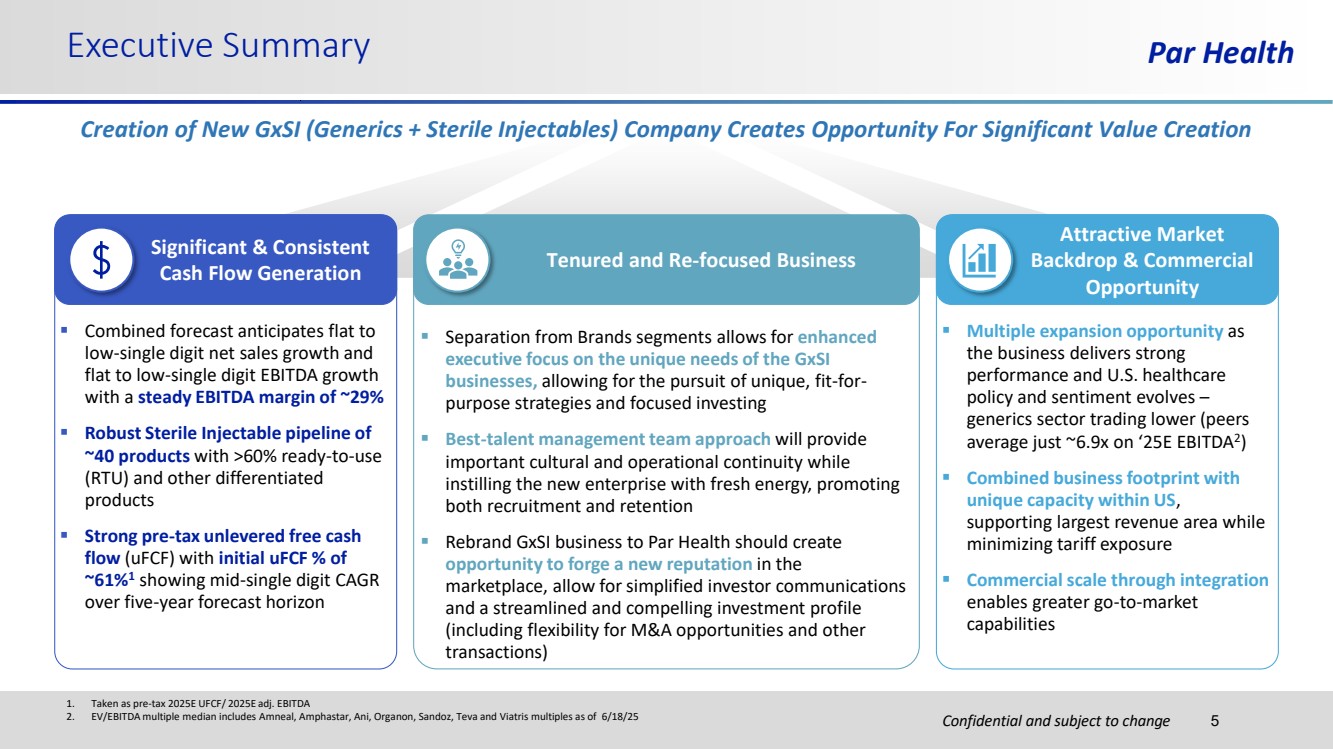
| Confidential and subject to change Par Health 1. Taken as pre-tax 2025E UFCF/ 2025E adj. EBITDA 2. EV/EBITDA multiple median includes Amneal, Amphastar, Ani, Organon, Sandoz, Teva and Viatris multiples as of 6/18/25 Executive Summary Creation of New GxSI (Generics + Sterile Injectables) Company Creates Opportunity For Significant Value Creation ▪ Combined forecast anticipates flat to low-single digit net sales growth and flat to low-single digit EBITDA growth with a steady EBITDA margin of ~29% ▪ Robust Sterile Injectable pipeline of ~40 products with >60% ready-to-use (RTU) and other differentiated products ▪ Strong pre-tax unlevered free cash flow (uFCF) with initial uFCF % of ~61%1 showing mid-single digit CAGR over five-year forecast horizon Significant & Consistent Cash Flow Generation ▪ Separation from Brands segments allows for enhanced executive focus on the unique needs of the GxSI businesses, allowing for the pursuit of unique, fit-for-purpose strategies and focused investing ▪ Best-talent management team approach will provide important cultural and operational continuity while instilling the new enterprise with fresh energy, promoting both recruitment and retention ▪ Rebrand GxSI business to Par Health should create opportunity to forge a new reputation in the marketplace, allow for simplified investor communications and a streamlined and compelling investment profile (including flexibility for M&A opportunities and other transactions) Tenured and Re-focused Business 5 ▪ Multiple expansion opportunity as the business delivers strong performance and U.S. healthcare policy and sentiment evolves – generics sector trading lower (peers average just ~6.9x on ‘25E EBITDA2 ) ▪ Combined business footprint with unique capacity within US, supporting largest revenue area while minimizing tariff exposure ▪ Commercial scale through integration enables greater go-to-market capabilities Attractive Market Backdrop & Commercial Opportunity |
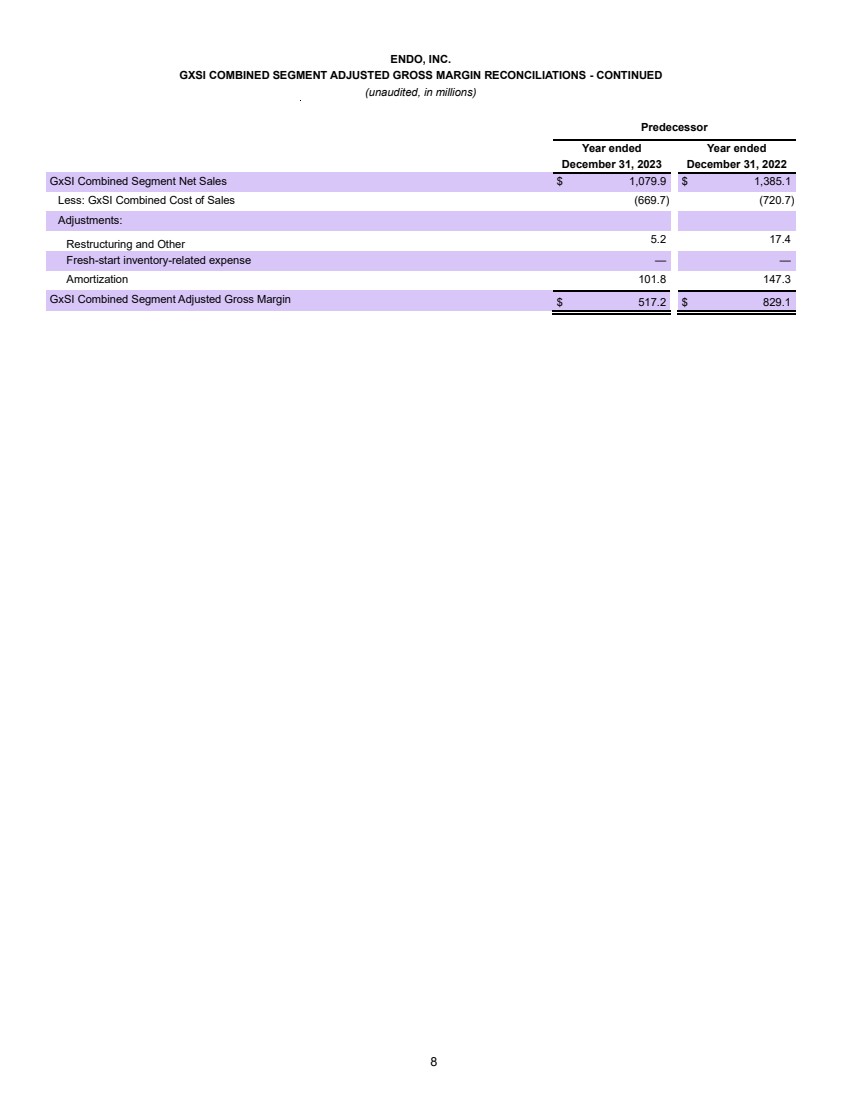
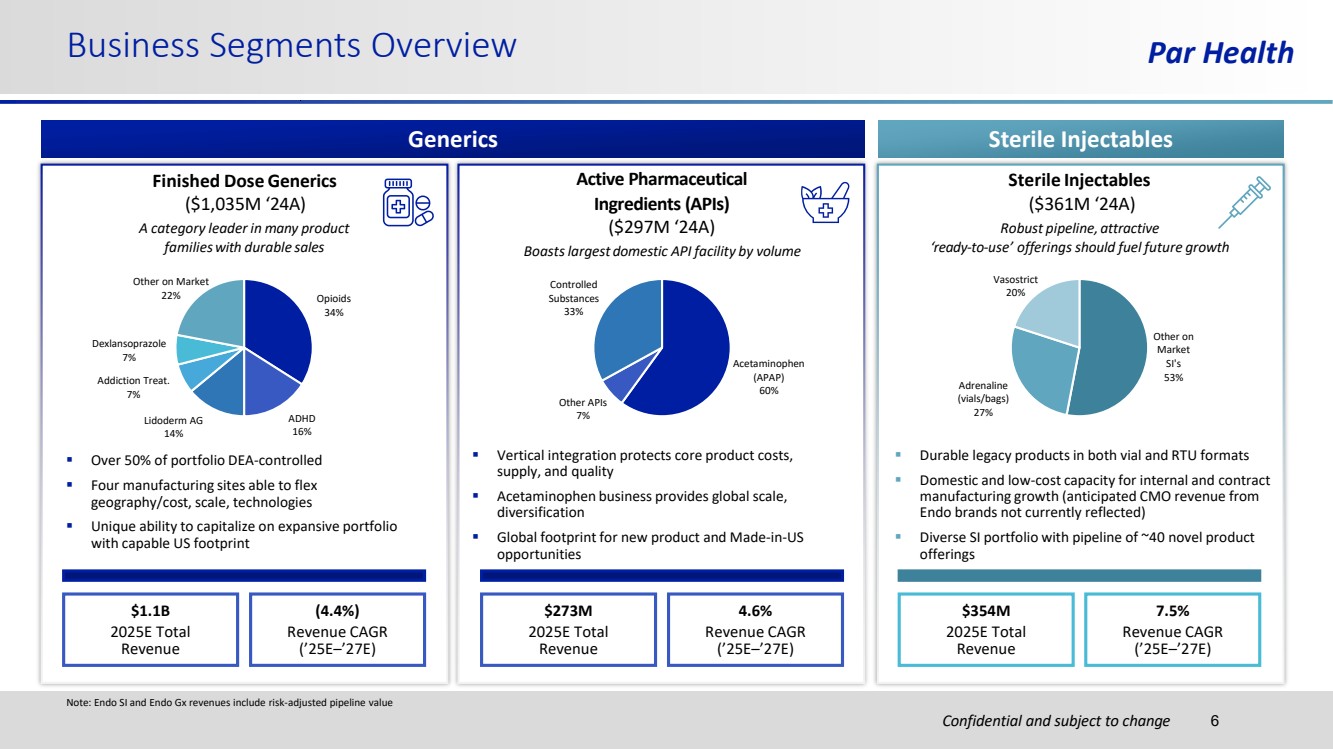
| Confidential and subject to change Business Segments Overview Par Health Generics Sterile Injectables $1.1B 2025E Total Revenue (4.4%) Revenue CAGR (’25E–’27E) $273M 2025E Total Revenue 4.6% Revenue CAGR (’25E–’27E) $354M 2025E Total Revenue 7.5% Revenue CAGR (’25E–’27E) Finished Dose Generics ($1,035M ‘24A) A category leader in many product familieswith durable sales ▪ Over 50% of portfolio DEA-controlled ▪ Four manufacturing sites able to flex geography/cost, scale, technologies ▪ Unique ability to capitalize on expansive portfolio with capable US footprint Sterile Injectables ($361M ‘24A) Robust pipeline, attractive ‘ready-to-use’ offerings should fuel future growth ▪ Durable legacy products in both vial and RTU formats ▪ Domestic and low-cost capacity for internal and contract manufacturing growth (anticipated CMO revenue from Endo brands not currently reflected) ▪ Diverse SI portfolio with pipeline of ~40 novel product offerings Active Pharmaceutical Ingredients (APIs) ($297M ‘24A) Boastslargest domestic API facility by volume ▪ Vertical integration protects core product costs, supply, and quality ▪ Acetaminophen business provides global scale, diversification ▪ Global footprint for new product and Made-in-US opportunities Opioids 34% ADHD 16% Lidoderm AG 14% Addiction Treat. 7% Dexlansoprazole 7% Other on Market 22% Other on Market SI's 53% Adrenaline (vials/bags) 27% Vasostrict 20% Acetaminophen (APAP) 60% Other APIs 7% Controlled Substances 33% 6 Note: Endo SI and Endo Gx revenues include risk-adjusted pipeline value |
| Confidential and subject to change Par Health Confidential and subject to change A) Generics Overview |

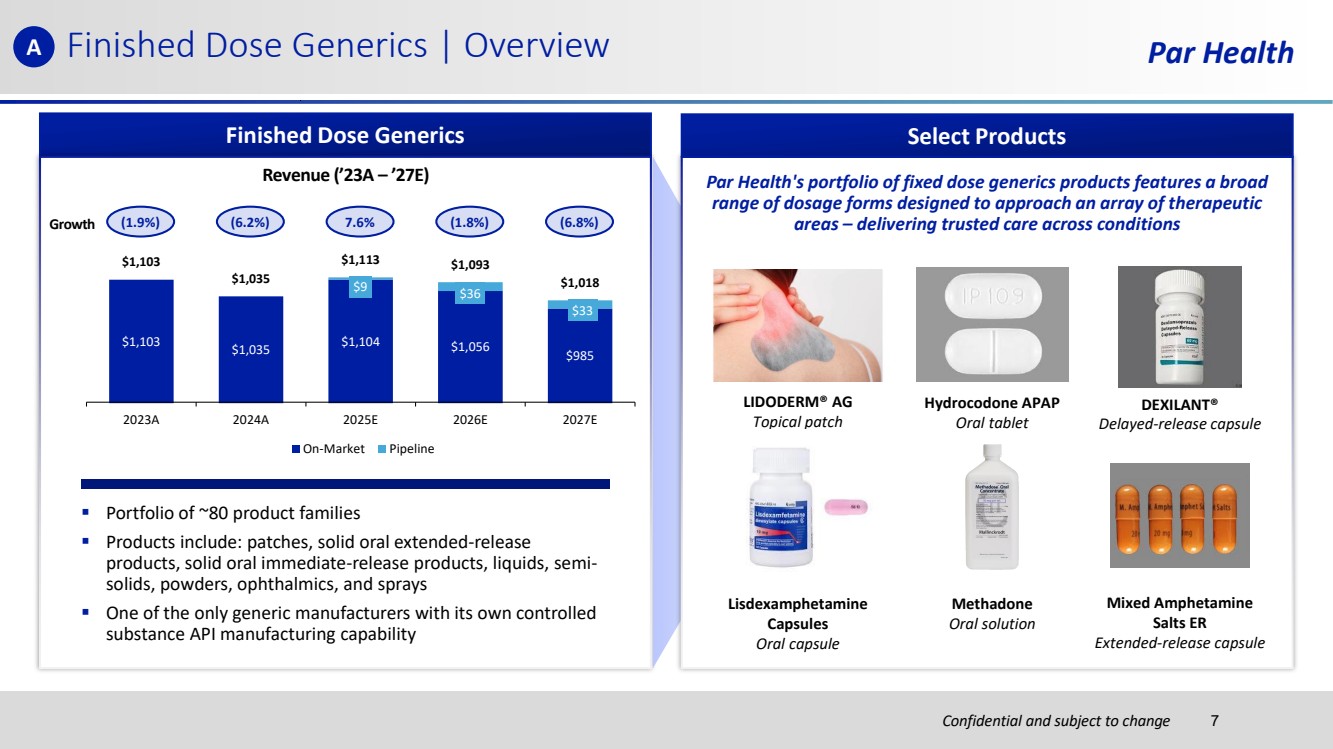
| Confidential and subject to change Finished Dose Generics | Overview Par Health Finished Dose Generics Revenue (’23A – ’27E) $1,103 $1,035 $1,104 $1,056 $985 $9 $36 $33 $1,103 $1,035 $1,113 $1,093 $1,018 2023A 2024A 2025E 2026E 2027E On-Market Pipeline Growth ▪ Portfolio of ~80 product families ▪ Products include: patches, solid oral extended-release products, solid oral immediate-release products, liquids, semi-solids, powders, ophthalmics, and sprays ▪ One of the only generic manufacturers with its own controlled substance API manufacturing capability (1.9%) (6.2%) 7.6% (1.8%) (6.8%) Select Products LIDODERM® AG Topical patch Hydrocodone APAP Oral tablet DEXILANT® Delayed-release capsule Par Health's portfolio of fixed dose generics products features a broad range of dosage forms designed to approach an array of therapeutic areas – delivering trusted care across conditions Lisdexamphetamine Capsules Oral capsule Methadone Oral solution Mixed Amphetamine Salts ER Extended-release capsule A 7 |
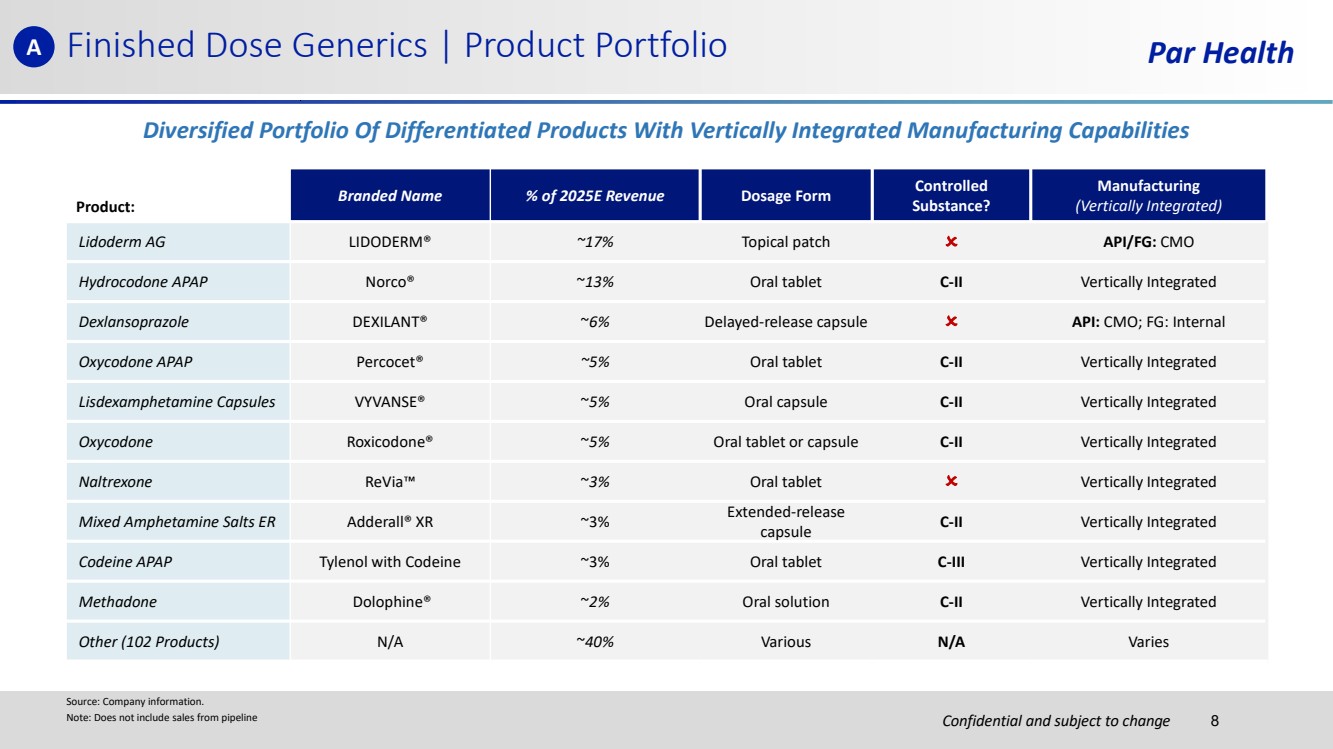
| Confidential and subject to change Par Health Product: Branded Name % of 2025E Revenue Dosage Form Controlled Substance? Manufacturing (Vertically Integrated) Lidoderm AG LIDODERM® ~17% Topical patch API/FG: CMO Hydrocodone APAP Norco® ~13% Oral tablet C-II Vertically Integrated Dexlansoprazole DEXILANT® ~6% Delayed-release capsule API: CMO; FG: Internal Oxycodone APAP Percocet® ~5% Oral tablet C-II Vertically Integrated Lisdexamphetamine Capsules VYVANSE® ~5% Oral capsule C-II Vertically Integrated Oxycodone Roxicodone® ~5% Oral tablet or capsule C-II Vertically Integrated Naltrexone ReVia ~3% Oral tablet Vertically Integrated Mixed Amphetamine Salts ER Adderall® XR ~3% Extended-release capsule C-II Vertically Integrated Codeine APAP Tylenol with Codeine ~3% Oral tablet C-III Vertically Integrated Methadone Dolophine® ~2% Oral solution C-II Vertically Integrated Other (102 Products) N/A ~40% Various N/A Varies Source: Company information. Note: Does not include sales from pipeline Finished Dose Generics | Product Portfolio Diversified Portfolio Of Differentiated Products With Vertically Integrated Manufacturing Capabilities A 8 |
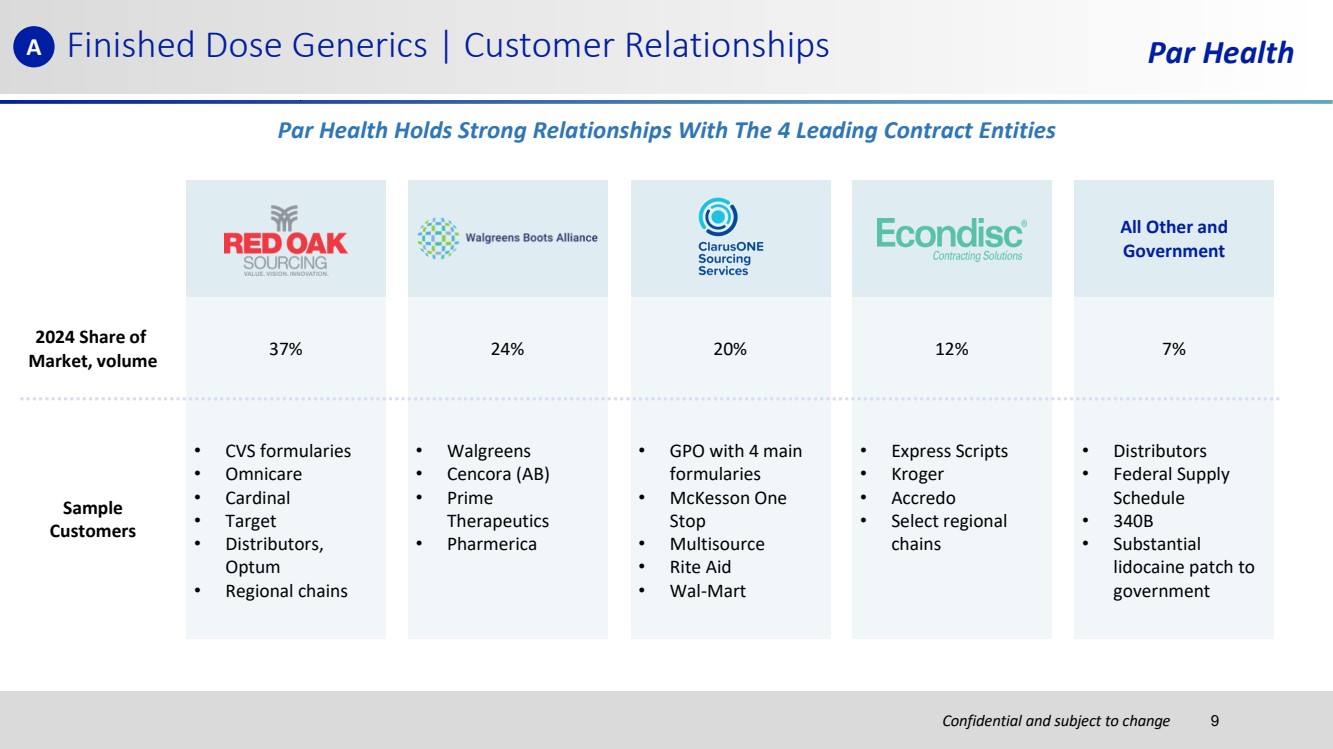
| Confidential and subject to change Finished Dose Generics | Customer Relationships Par Health All Other and Government Sample Customers • CVS formularies • Omnicare • Cardinal • Target • Distributors, Optum • Regional chains • Walgreens • Cencora (AB) • Prime Therapeutics • Pharmerica • GPO with 4 main formularies • McKesson One Stop • Multisource • Rite Aid • Wal-Mart • Express Scripts • Kroger • Accredo • Select regional chains • Distributors • Federal Supply Schedule • 340B • Substantial lidocaine patch to government Par Health Holds Strong Relationships With The 4 Leading Contract Entities A 2024 Share of Market, volume 37% 24% 20% 12% 7% 9 |
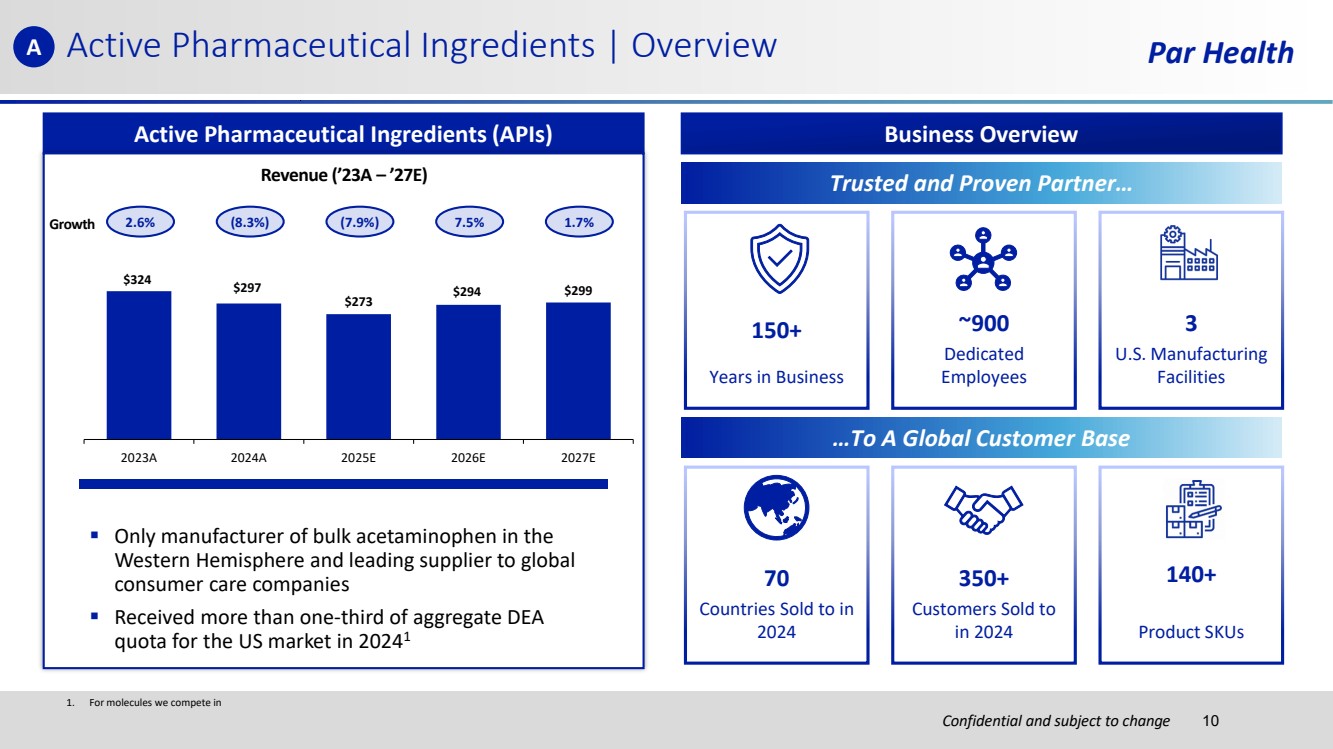
| Confidential and subject to change Par Health 1. For molecules we compete in Active Pharmaceutical Ingredients | Overview Active Pharmaceutical Ingredients (APIs) Revenue (’23A – ’27E) $324 $297 $273 $294 $299 2023A 2024A 2025E 2026E 2027E ▪ Only manufacturer of bulk acetaminophen in the Western Hemisphere and leading supplier to global consumer care companies ▪ Received more than one-third of aggregate DEA quota for the US market in 20241 2.6% (8.3%) (7.9%) 7.5% 1.7% Business Overview …To A Global Customer Base 150+ Years in Business ~900 Dedicated Employees 3 U.S. Manufacturing Facilities 70 Countries Sold to in 2024 350+ Customers Sold to in 2024 140+ Product SKUs Trusted and Proven Partner… Growth A 10 |
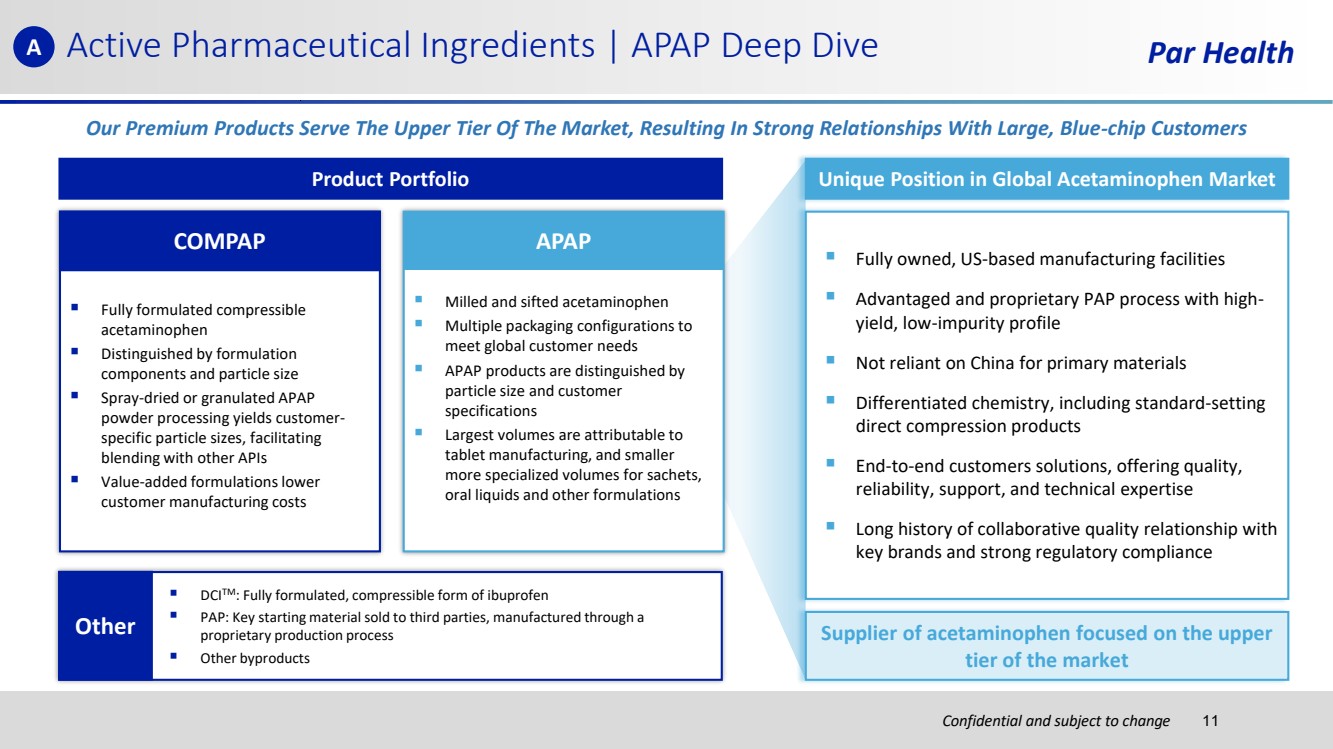
| Confidential and subject to change Active Pharmaceutical Ingredients | APAP Deep Dive Par Health Our Premium Products Serve The Upper Tier Of The Market, Resulting In Strong Relationships With Large, Blue-chip Customers Unique Position in Global Acetaminophen Market ▪ Fully owned, US-based manufacturing facilities ▪ Advantaged and proprietary PAP process with high-yield, low-impurity profile ▪ Not reliant on China for primary materials ▪ Differentiated chemistry, including standard-setting direct compression products ▪ End-to-end customers solutions, offering quality, reliability, support, and technical expertise ▪ Long history of collaborative quality relationship with key brands and strong regulatory compliance Supplier of acetaminophen focused on the upper tier of the market Product Portfolio ▪ Fully formulated compressible acetaminophen ▪ Distinguished by formulation components and particle size ▪ Spray-dried or granulated APAP powder processing yields customer-specific particle sizes, facilitating blending with other APIs ▪ Value-added formulations lower customer manufacturing costs COMPAP ▪ DCITM: Fully formulated, compressible form of ibuprofen ▪ PAP: Key starting material sold to third parties, manufactured through a proprietary production process ▪ Other byproducts Other ▪ Milled and sifted acetaminophen ▪ Multiple packaging configurations to meet global customer needs ▪ APAP products are distinguished by particle size and customer specifications ▪ Largest volumes are attributable to tablet manufacturing, and smaller more specialized volumes for sachets, oral liquids and other formulations APAP A 11 |
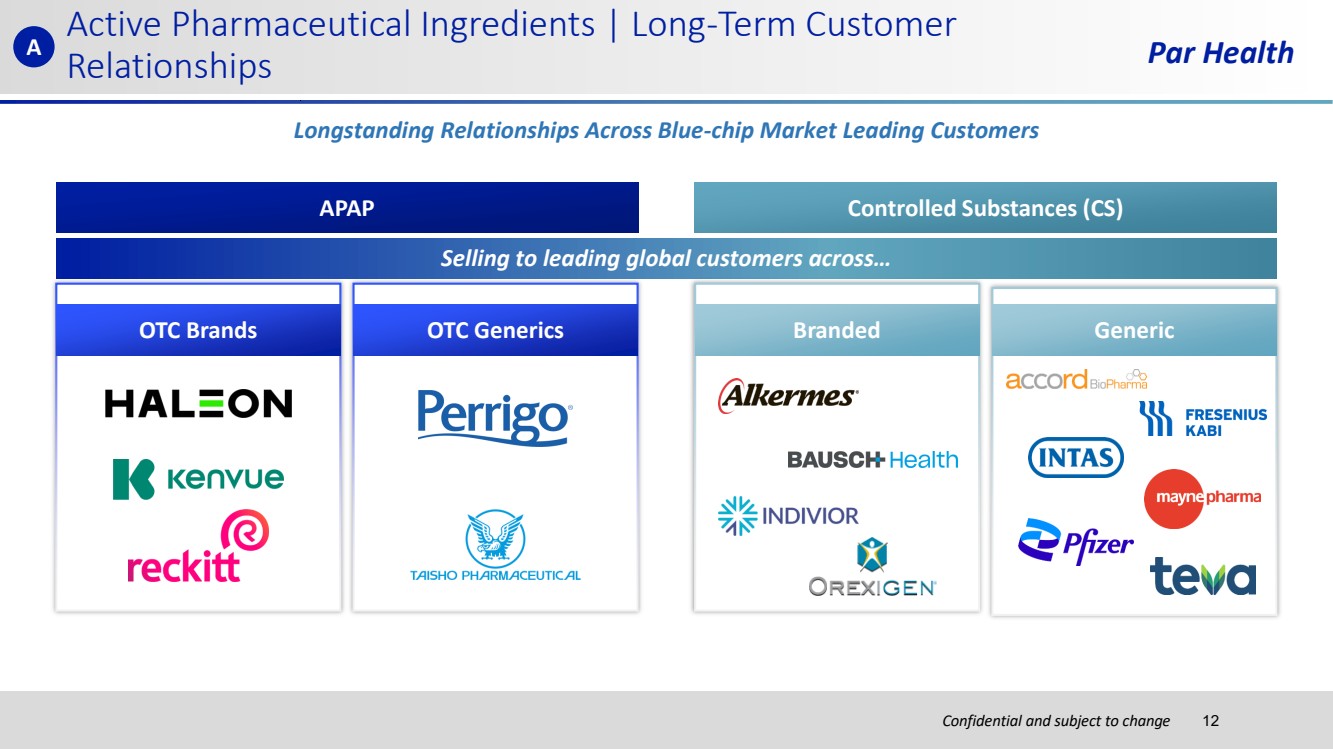
| Confidential and subject to change Par Health OTC Generics Active Pharmaceutical Ingredients | Long-Term Customer Relationships APAP Controlled Substances (CS) OTC Brands Selling to leading global customers across… Branded Generic Longstanding Relationships Across Blue-chip Market Leading Customers A 12 |
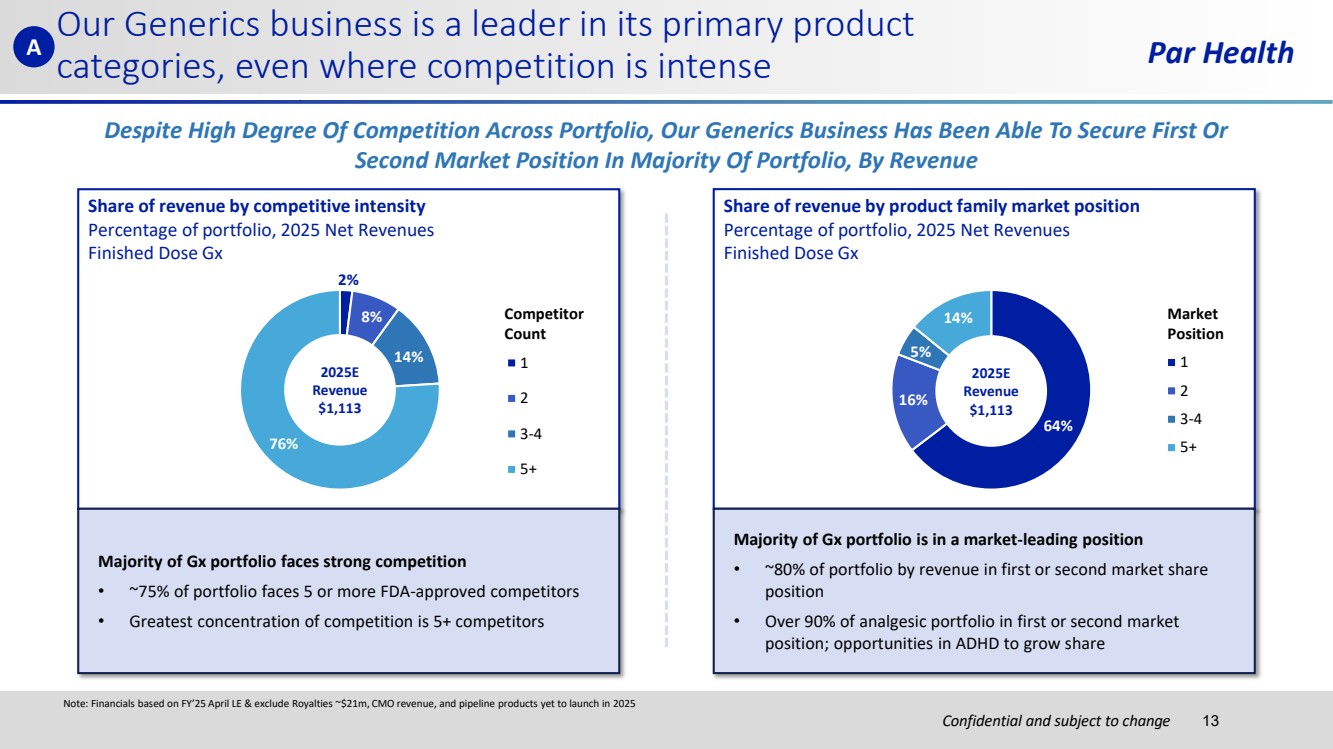
| Confidential and subject to change Par Health Share of revenue by competitive intensity Percentage of portfolio, 2025 Net Revenues Finished Dose Gx Share of revenue by product family market position Percentage of portfolio, 2025 Net Revenues Finished Dose Gx 2% 8% 14% 76% 1 2 3-4 5+ 2025E Revenue $1,113 64% 16% 5% 14% 1 2 3-4 5+ 2025E Revenue $1,113 Market Position Competitor Count Despite High Degree Of Competition Across Portfolio, Our Generics Business Has Been Able To Secure First Or Second Market Position In Majority Of Portfolio, By Revenue Note: Financials based on FY’25 April LE & exclude Royalties ~$21m, CMO revenue, and pipeline products yet to launch in 2025 Our Generics business is a leader in its primary product categories, even where competition is intense Majority of Gx portfolio faces strong competition • ~75% of portfolio faces 5 or more FDA-approved competitors • Greatest concentration of competition is 5+ competitors Majority of Gx portfolio is in a market-leading position • ~80% of portfolio by revenue in first or second market share position • Over 90% of analgesic portfolio in first or second market position; opportunities in ADHD to grow share A 13 |
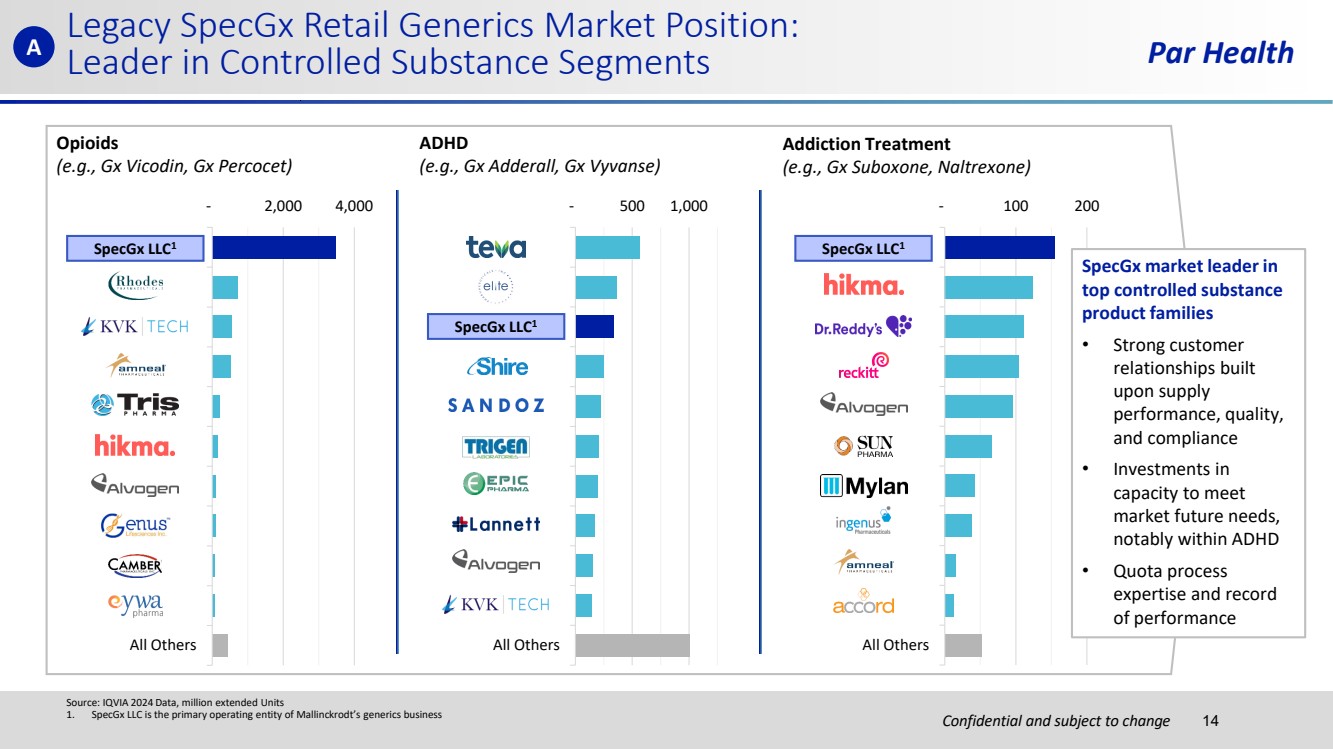
| Confidential and subject to change Par Health Source: IQVIA 2024 Data, million extended Units 1. SpecGx LLC is the primary operating entity of Mallinckrodt’s generics business A Opioids (e.g., Gx Vicodin, Gx Percocet) ADHD (e.g., Gx Adderall, Gx Vyvanse) Addiction Treatment (e.g., Gx Suboxone, Naltrexone) - 2,000 4,000 MALLINCKRODT RHODES PHARMA KVK-TECH INC AMNEAL PHARMA TRIS PHARMA INC HIKMA PHARMA ALVOGEN INC GENUS LIFESCIEN CAMBER PHARMA EYWA PHARMA All Others - 500 1,000 Teva USA ELITE PHARMA MALLINCKRODT SHIRE US INC SANDOZ INC TRIGEN LAB EPIC PHARMA LLC LANNETT ALVOGEN INC KVK-TECH INC All Others - 100 200 MALLINCKRODT HIKMA PHARMA DR.REDDY'S LAB RECKITT BENCKIS ALVOGEN INC SUN PHARMA MYLAN INGENUS AMNEAL PHARMA ACCORD HEALTH All Others SpecGx LLC1 SpecGx market leader in top controlled substance product families • Strong customer relationships built upon supply performance, quality, and compliance • Investments in capacity to meet market future needs, notably within ADHD • Quota process expertise and record of performance Legacy SpecGx Retail Generics Market Position: Leader in Controlled Substance Segments 14 SpecGx LLC1 SpecGx LLC1 |
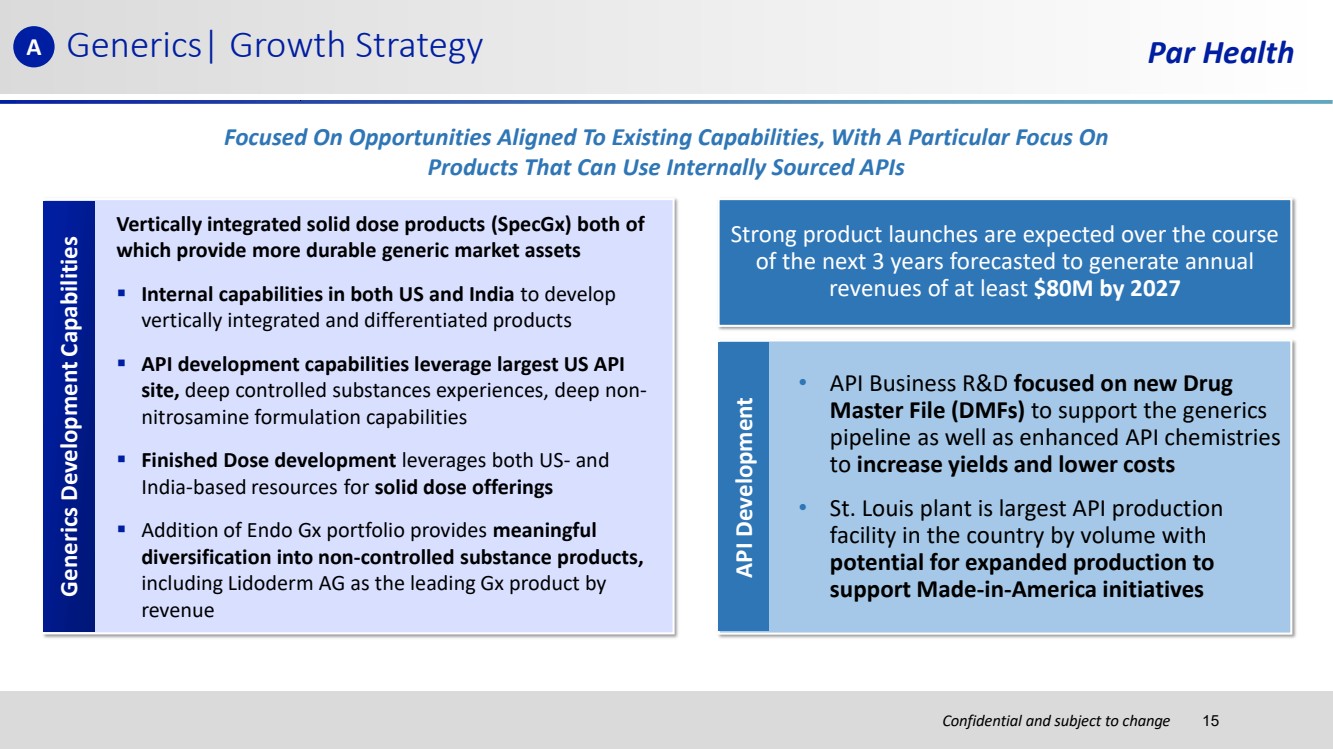
| Confidential and subject to change Par Health • API Business R&D focused on new Drug Master File (DMFs) to support the generics pipeline as well as enhanced API chemistries to increase yields and lower costs • St. Louis plant is largest API production facility in the country by volume with potential for expanded production to support Made-in-America initiatives Generics| Growth Strategy Generics Pipeline Strong product launches are expected over the course of the next 3 years forecasted to generate annual revenues of at least $80M by 2027 API Development Vertically integrated solid dose products (SpecGx) both of which provide more durable generic market assets ▪ Internal capabilities in both US and India to develop vertically integrated and differentiated products ▪ API development capabilities leverage largest US API site, deep controlled substances experiences, deep non-nitrosamine formulation capabilities ▪ Finished Dose development leverages both US- and India-based resources for solid dose offerings ▪ Addition of Endo Gx portfolio provides meaningful diversification into non-controlled substance products, including Lidoderm AG as the leading Gx product by revenue Generics Development Capabilities Focused On Opportunities Aligned To Existing Capabilities, With A Particular Focus On Products That Can Use Internally Sourced APIs A 15 |
| Confidential and subject to change Par Health Confidential and subject to change B) Sterile Injectables Overview |

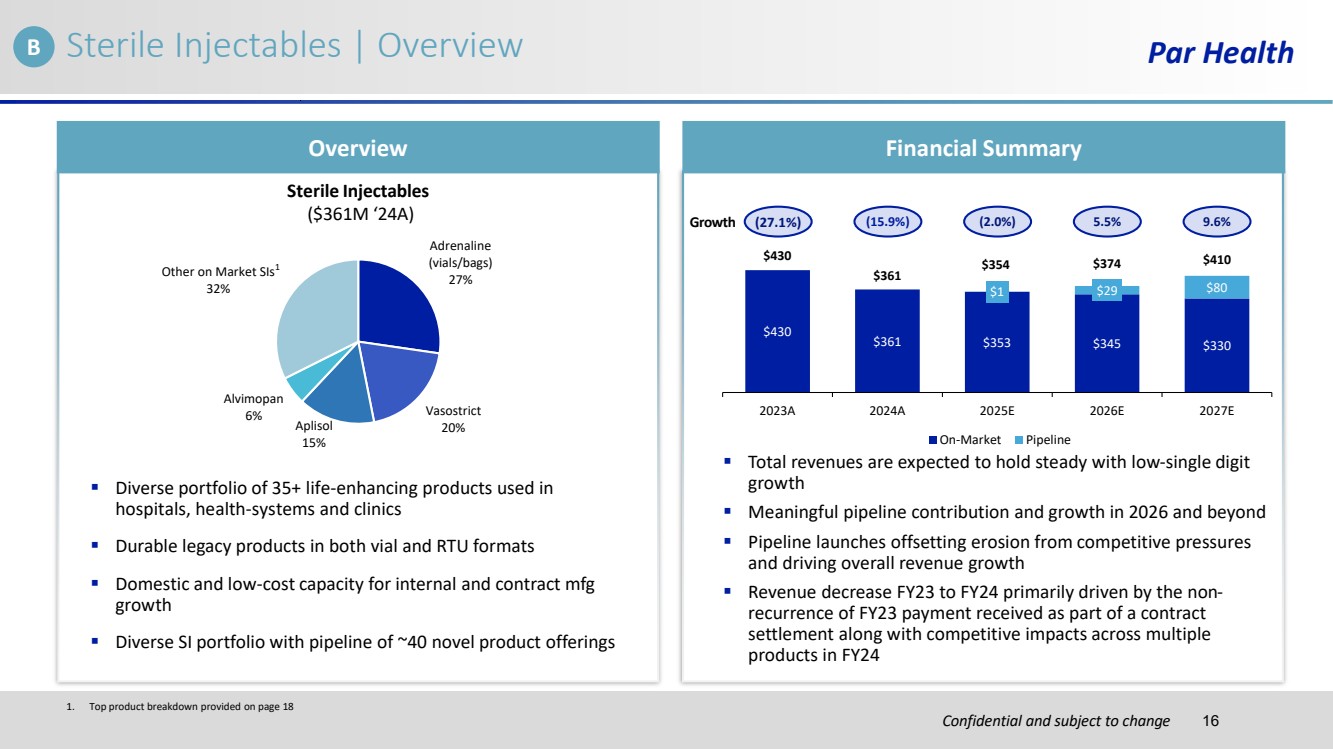
| Confidential and subject to change Sterile Injectables | Overview Par Health Overview Financial Summary ▪ Diverse portfolio of 35+ life-enhancing products used in hospitals, health-systems and clinics ▪ Durable legacy products in both vial and RTU formats ▪ Domestic and low-cost capacity for internal and contract mfg growth ▪ Diverse SI portfolio with pipeline of ~40 novel product offerings Adrenaline (vials/bags) 27% Vasostrict Aplisol 20% 15% Alvimopan 6% Other on Market SIs 32% Sterile Injectables ($361M ‘24A) ▪ Total revenues are expected to hold steady with low-single digit growth ▪ Meaningful pipeline contribution and growth in 2026 and beyond ▪ Pipeline launches offsetting erosion from competitive pressures and driving overall revenue growth ▪ Revenue decrease FY23 to FY24 primarily driven by the non-recurrence of FY23 payment received as part of a contract settlement along with competitive impacts across multiple products in FY24 $430 $361 $353 $345 $330 $1 $29 $80 $430 $361 $354 $374 $410 2023A 2024A 2025E 2026E 2027E On-Market Pipeline Growth (27.1%) (15.9%) (2.0%) 5.5% 9.6% 1 1. Top product breakdown provided on page 18 B 16 |
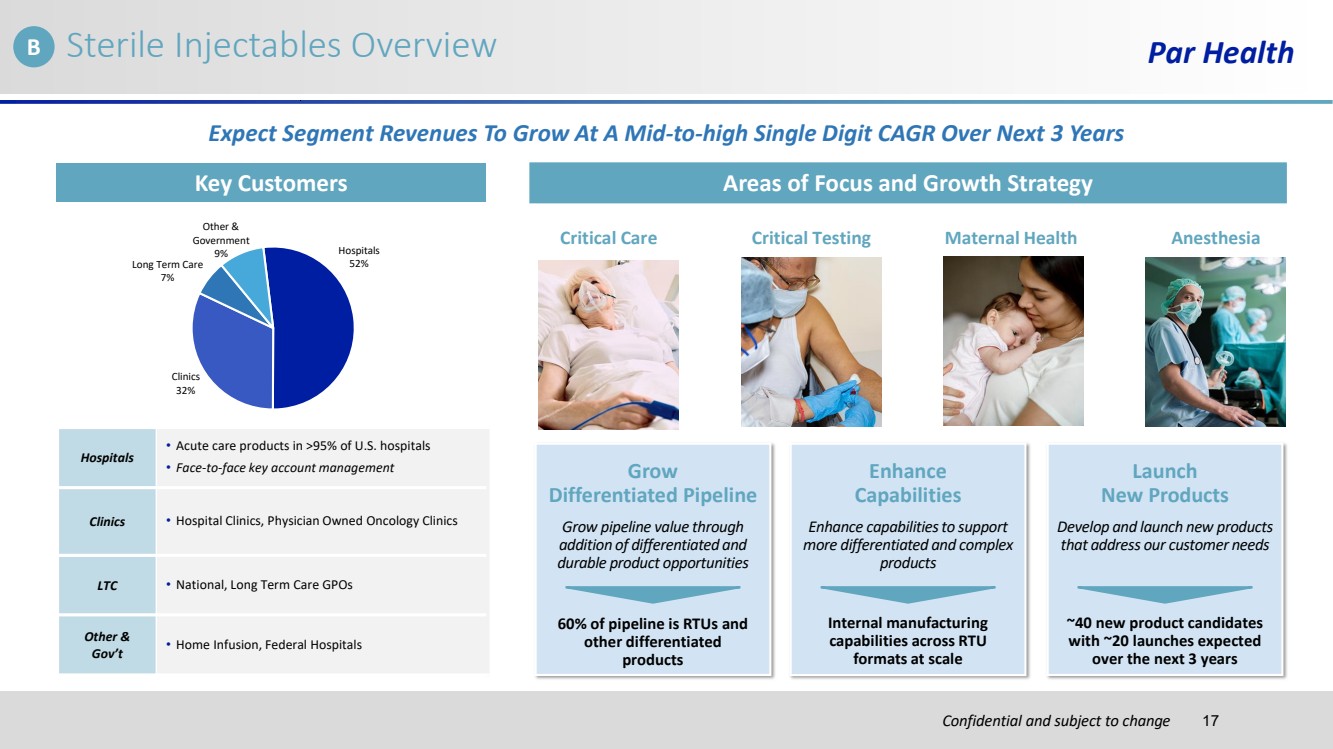
| Confidential and subject to change Sterile Injectables Overview Par Health Key Customers Areas of Focus and Growth Strategy Hospitals 52% Clinics 32% Long Term Care 7% Other & Government 9% Hospitals • Acute care products in >95% of U.S. hospitals • Face-to-face key account management Clinics • Hospital Clinics, Physician Owned Oncology Clinics LTC • National, Long Term Care GPOs Other & Gov’t • Home Infusion, Federal Hospitals Critical Care Critical Testing Maternal Health Anesthesia Grow Differentiated Pipeline Enhance Capabilities Launch New Products Grow pipeline value through addition of differentiated and durable product opportunities Enhance capabilities to support more differentiated and complex products Develop and launch new products that address our customer needs Expect Segment Revenues To Grow At A Mid-to-high Single Digit CAGR Over Next 3 Years 60% of pipeline is RTUs and other differentiated products Internal manufacturing capabilities across RTU formats at scale ~40 new product candidates with ~20 launches expected over the next 3 years B 17 |
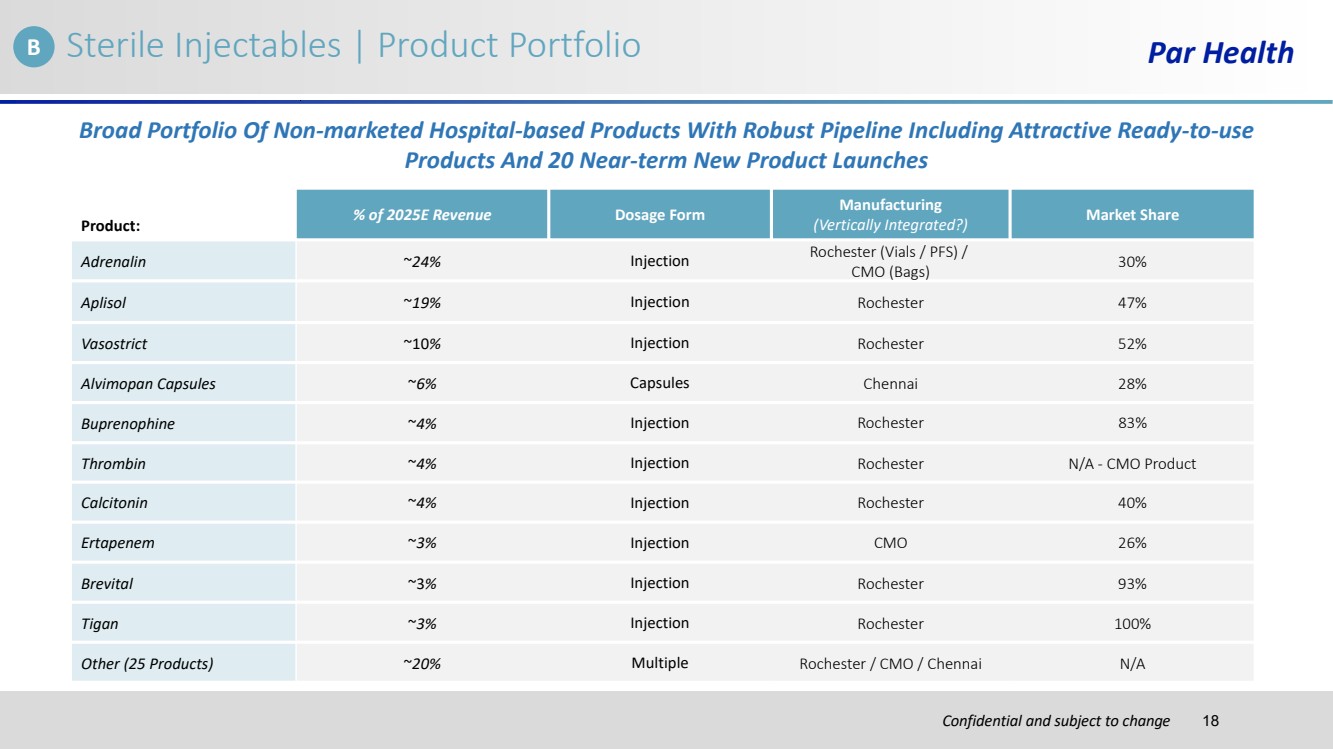
| Confidential and subject to change Par Health Product: % of 2025E Revenue Dosage Form Manufacturing (Vertically Integrated?) Market Share Adrenalin ~24% Injection Rochester (Vials / PFS) / CMO (Bags) 30% Aplisol ~19% Injection Rochester 47% Vasostrict ~10% Injection Rochester 52% Alvimopan Capsules ~6% Capsules Chennai 28% Buprenophine ~4% Injection Rochester 83% Thrombin ~4% Injection Rochester N/A - CMO Product Calcitonin ~4% Injection Rochester 40% Ertapenem ~3% Injection CMO 26% Brevital ~3% Injection Rochester 93% Tigan ~3% Injection Rochester 100% Other (25 Products) ~20% Multiple Rochester / CMO / Chennai N/A Sterile Injectables | Product Portfolio Broad Portfolio Of Non-marketed Hospital-based Products With Robust Pipeline Including Attractive Ready-to-use Products And 20 Near-term New Product Launches B 18 |
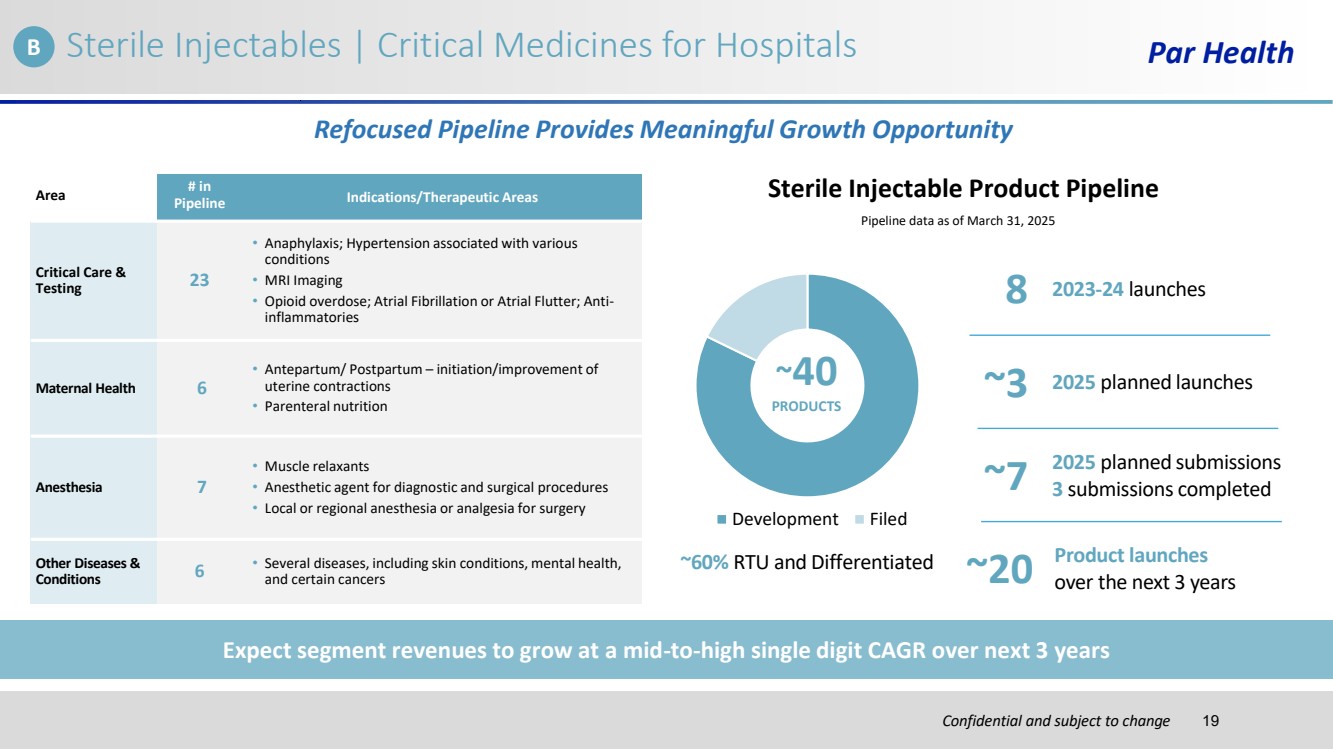
| Confidential and subject to change Par Health Development Filed Refocused Pipeline Provides Meaningful Growth Opportunity Sterile Injectable Product Pipeline Pipeline data as of March 31, 2025 ~40 ~3 2025 planned launches PRODUCTS ~60% RTU and Differentiated Expect segment revenues to grow at a mid-to-high single digit CAGR over next 3 years Product launches ~20 over the next 3 years 2025 planned submissions ~7 3 submissions completed 8 2023-24 launches Area # in Pipeline Indications/Therapeutic Areas Critical Care & Testing 23 • Anaphylaxis; Hypertension associated with various conditions • MRI Imaging • Opioid overdose; Atrial Fibrillation or Atrial Flutter; Anti-inflammatories Maternal Health 6 • Antepartum/ Postpartum – initiation/improvement of uterine contractions • Parenteral nutrition Anesthesia 7 • Muscle relaxants • Anesthetic agent for diagnostic and surgical procedures • Local or regional anesthesia or analgesia for surgery Other Diseases & Conditions 6 • Several diseases, including skin conditions, mental health, and certain cancers B Sterile Injectables | Critical Medicines for Hospitals 19 |
| Confidential and subject to change Par Health Confidential and subject to change C) Manufacturing and Quality Control |

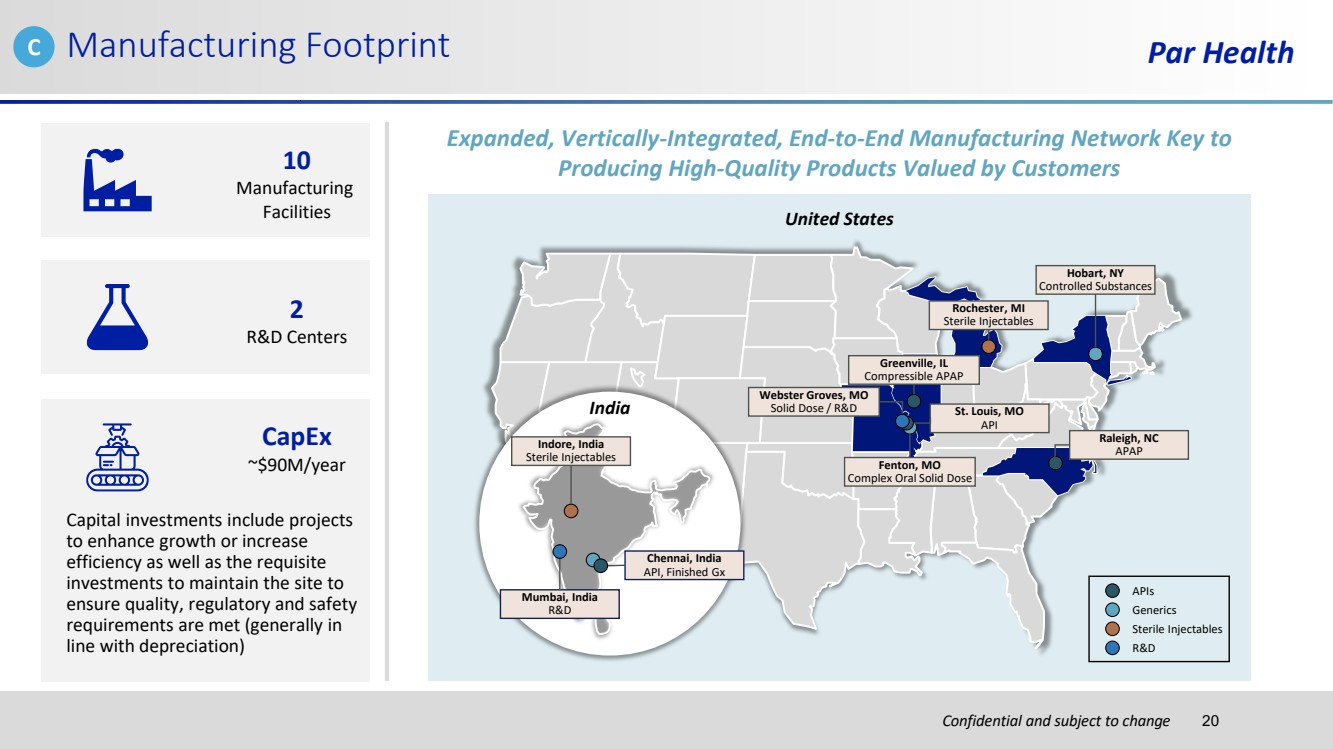
| Confidential and subject to change Manufacturing Footprint Par Health 10 Manufacturing Facilities 2 R&D Centers Capital investments include projects to enhance growth or increase efficiency as well as the requisite investments to maintain the site to ensure quality, regulatory and safety requirements are met (generally in line with depreciation) CapEx ~$90M/year United States Indore, India Sterile Injectables India Mumbai, India R&D Chennai, India API, Finished Gx Greenville, IL Compressible APAP Webster Groves, MO Solid Dose / R&D Fenton, MO Complex Oral Solid Dose St. Louis, MO API Rochester, MI Sterile Injectables Hobart, NY Controlled Substances Raleigh, NC APAP APIs Generics Sterile Injectables R&D Expanded, Vertically-Integrated, End-to-End Manufacturing Network Key to Producing High-Quality Products Valued by Customers C 20 |
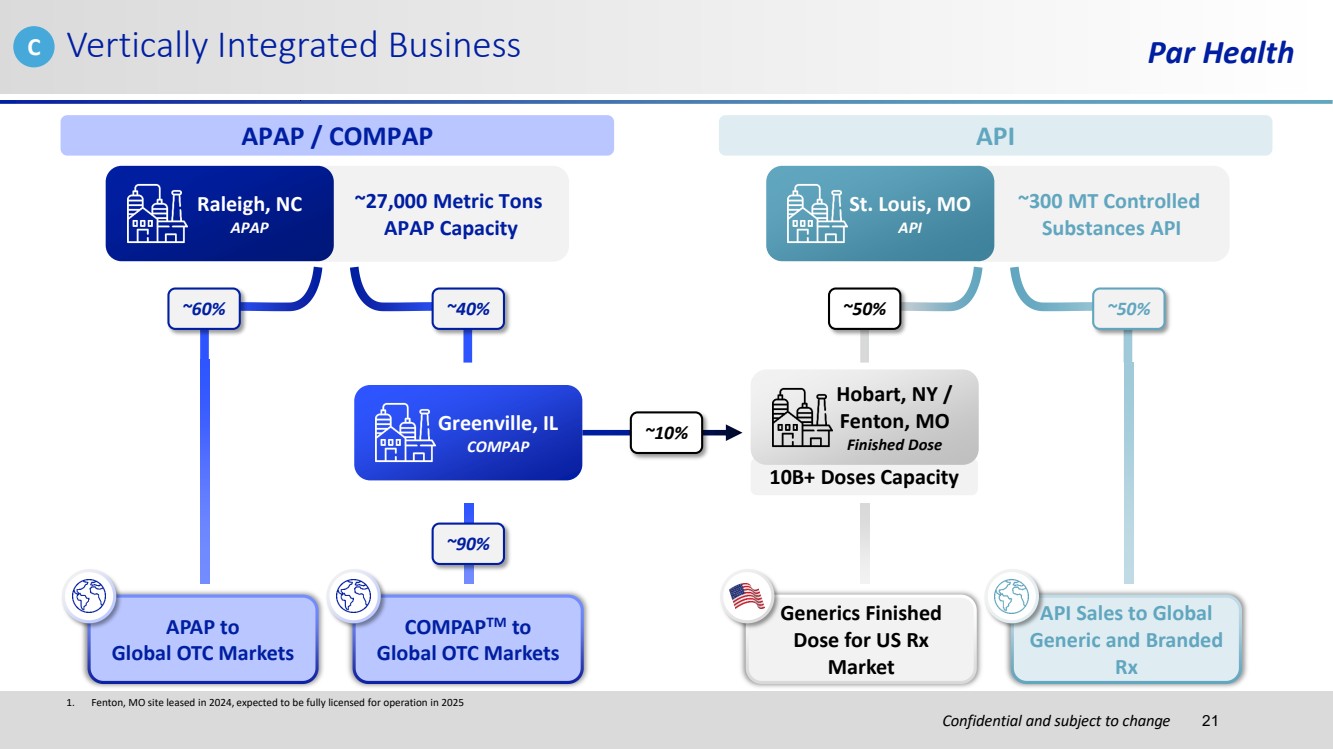
| Confidential and subject to change Par Health 10B+ Doses Capacity 1. Fenton, MO site leased in 2024, expected to be fully licensed for operation in 2025 Vertically Integrated Business ~10% APAP / COMPAP ~27,000 Metric Tons APAP Capacity Raleigh, NC APAP ~60% ~40% Greenville, IL COMPAP ~90% APAP to Global OTC Markets COMPAPTM to Global OTC Markets API ~300 MT Controlled Substances API St. Louis, MO API ~50% ~50% Hobart, NY / Fenton, MO Finished Dose Generics Finished Dose for US Rx Market API Sales to Global Generic and Branded Rx C 21 |
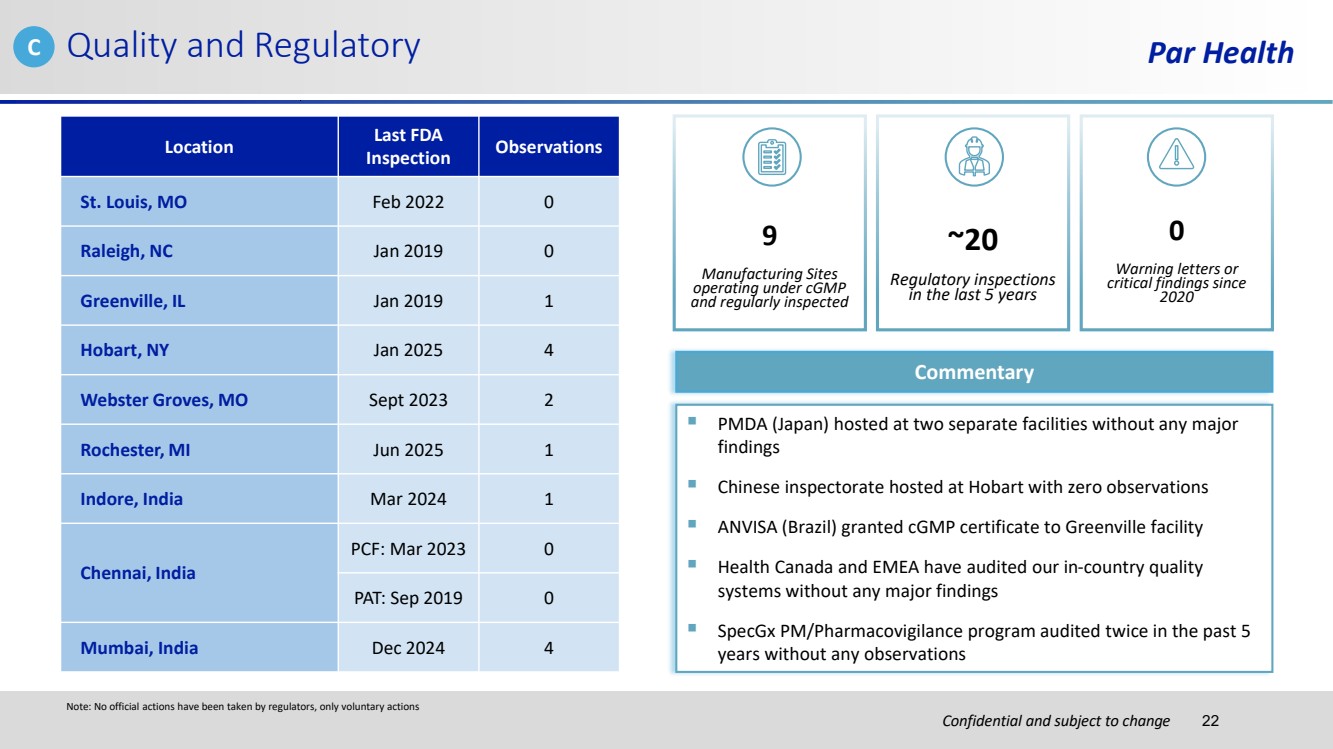
| Confidential and subject to change Par Health 0 Warning letters or critical findings since 2020 Location Last FDA Inspection Observations St. Louis, MO Feb 2022 0 Raleigh, NC Jan 2019 0 Greenville, IL Jan 2019 1 Hobart, NY Jan 2025 4 Webster Groves, MO Sept 2023 2 Rochester, MI Jun 2025 1 Indore, India Mar 2024 1 Chennai, India PCF: Mar 2023 0 PAT: Sep 2019 0 Mumbai, India Dec 2024 4 ~20 Regulatory inspections in the last 5 years 9 Manufacturing Sites operating under cGMP and regularly inspected Commentary ▪ PMDA (Japan) hosted at two separate facilities without any major findings ▪ Chinese inspectorate hosted at Hobart with zero observations ▪ ANVISA (Brazil) granted cGMP certificate to Greenville facility ▪ Health Canada and EMEA have audited our in-country quality systems without any major findings ▪ SpecGx PM/Pharmacovigilance program audited twice in the past 5 years without any observations Quality and Regulatory Note: No official actions have been taken by regulators, only voluntary actions C 22 |
| Confidential and subject to change Par Health Confidential and subject to change D) Additional Growth Levers |

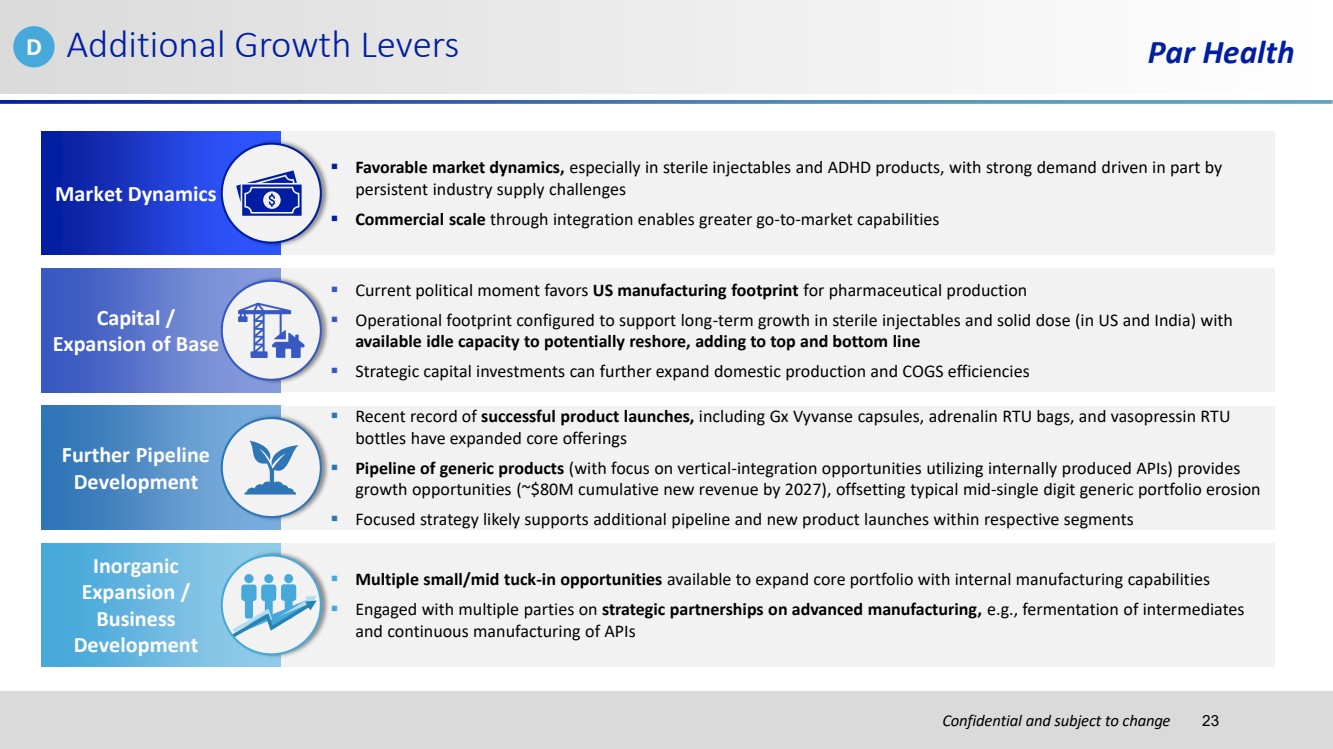
| Confidential and subject to change Par Health ▪ Favorable market dynamics, especially in sterile injectables and ADHD products, with strong demand driven in part by persistent industry supply challenges ▪ Commercial scale through integration enables greater go-to-market capabilities ▪ Multiple small/mid tuck-in opportunities available to expand core portfolio with internal manufacturing capabilities ▪ Engaged with multiple parties on strategic partnerships on advanced manufacturing, e.g., fermentation of intermediates and continuous manufacturing of APIs ▪ Current political moment favors US manufacturing footprint for pharmaceutical production ▪ Operational footprint configured to support long-term growth in sterile injectables and solid dose (in US and India) with available idle capacity to potentially reshore, adding to top and bottom line ▪ Strategic capital investments can further expand domestic production and COGS efficiencies ▪ Recent record of successful product launches, including Gx Vyvanse capsules, adrenalin RTU bags, and vasopressin RTU bottles have expanded core offerings ▪ Pipeline of generic products (with focus on vertical-integration opportunities utilizing internally produced APIs) provides growth opportunities (~$80M cumulative new revenue by 2027), offsetting typical mid-single digit generic portfolio erosion ▪ Focused strategy likely supports additional pipeline and new product launches within respective segments Market Dynamics Additional Growth Levers Inorganic Expansion / Business Development Capital / Expansion of Base Further Pipeline Development D 23 |
| Confidential and subject to change Par Health Confidential and subject to change Industry Overview and Outlook |

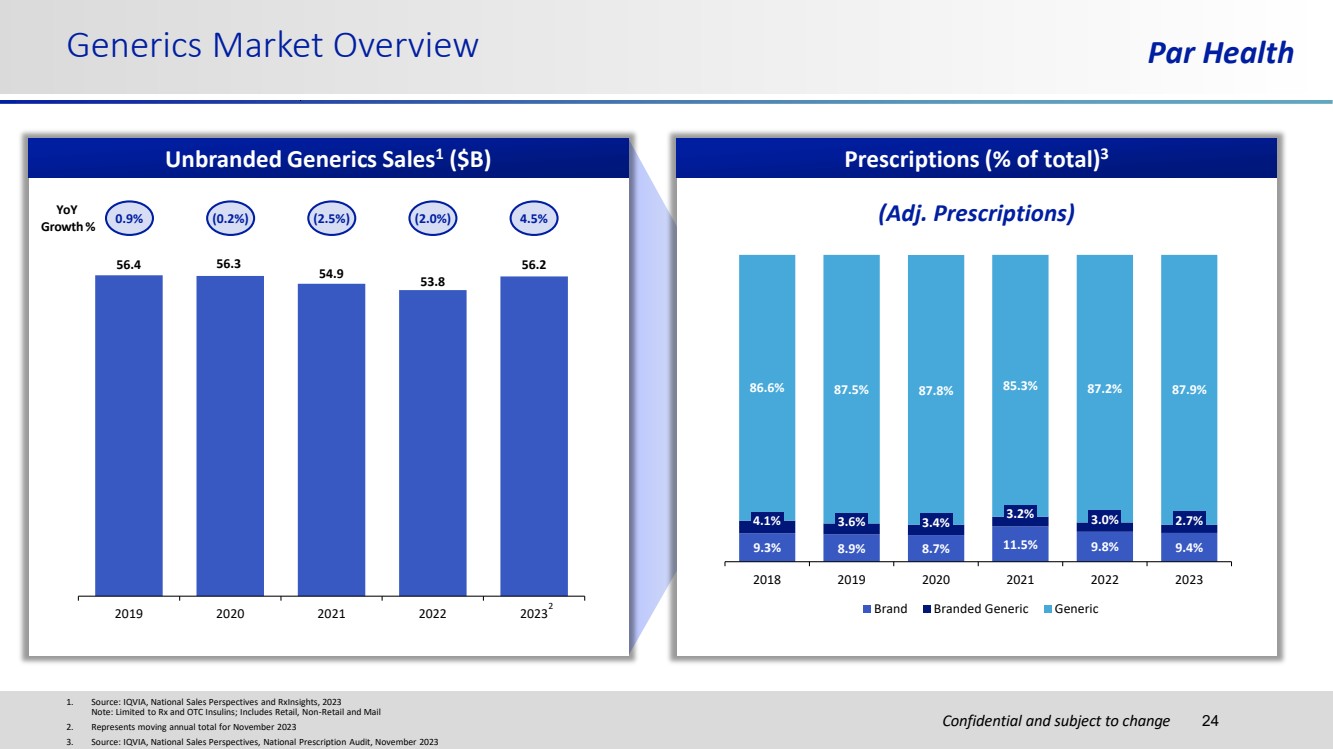
| Confidential and subject to change Generics Market Overview Par Health 1. Source: IQVIA, National Sales Perspectives and RxInsights, 2023 Note: Limited to Rx and OTC Insulins; Includes Retail, Non-Retail and Mail 2. Represents moving annual total for November 2023 3. Source: IQVIA, National Sales Perspectives, National Prescription Audit, November 2023 24 Unbranded Generics Sales1 ($B) YoY Growth % 0.9% (0.2%) (2.5%) (2.0%) 4.5% Prescriptions (% of total)3 56.4 56.3 54.9 53.8 56.2 2019 2020 2021 2022 2023 9.3% 8.9% 8.7% 11.5% 9.8% 9.4% 4.1% 3.6% 3.4% 3.2% 3.0% 2.7% 86.6% 87.5% 87.8% 85.3% 87.2% 87.9% 2018 2019 2020 2021 2022 2023 Brand Branded Generic Generic (Adj. Prescriptions) 2 |
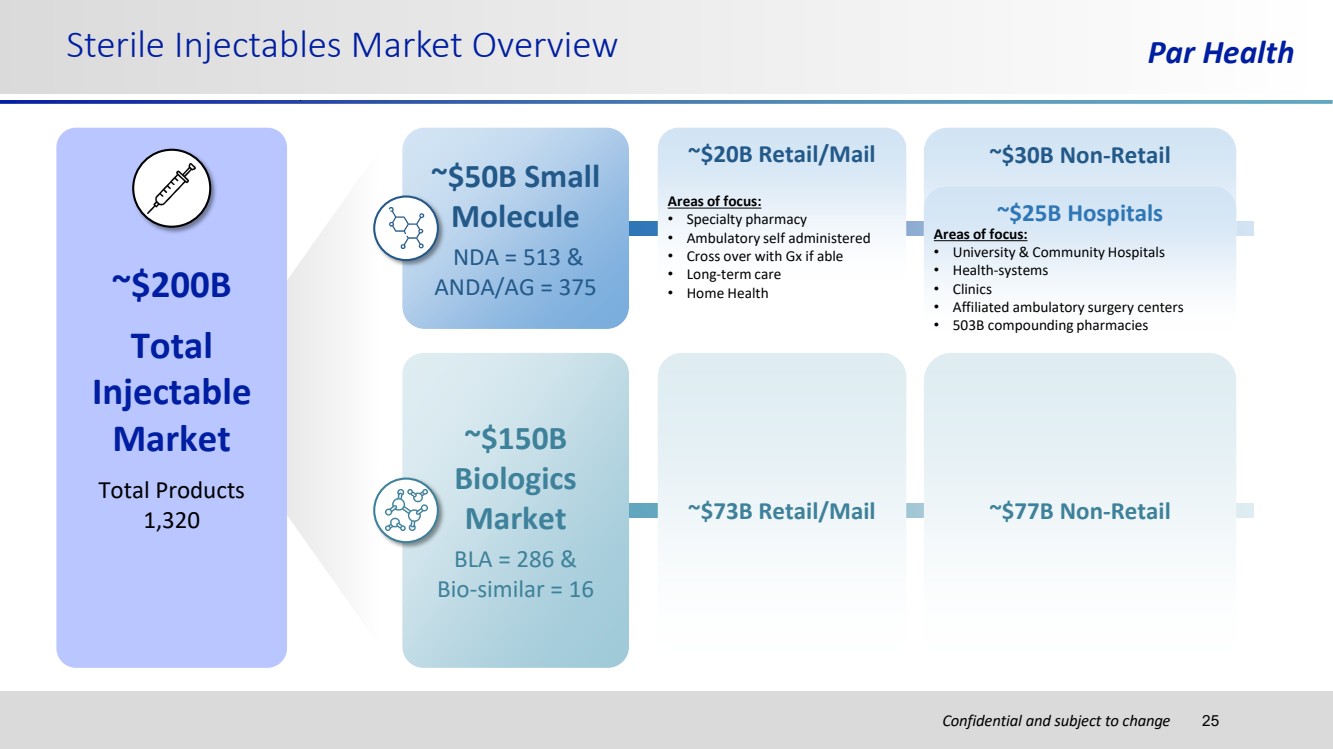
| Confidential and subject to change Sterile Injectables Market Overview Par Health ~$200B Total Injectable Market Total Products 1,320 ~$150B Biologics Market BLA = 286 & Bio-similar = 16 ~$50B Small Molecule NDA = 513 & ANDA/AG = 375 ~$20B Retail/Mail ~$30B Non-Retail Areas of focus: • Specialty pharmacy • Ambulatory self administered • Cross over with Gx if able • Long-term care • Home Health ~$25B Hospitals Areas of focus: • University & Community Hospitals • Health-systems • Clinics • Affiliated ambulatory surgery centers • 503B compounding pharmacies ~$73B Retail/Mail ~$77B Non-Retail 25 |
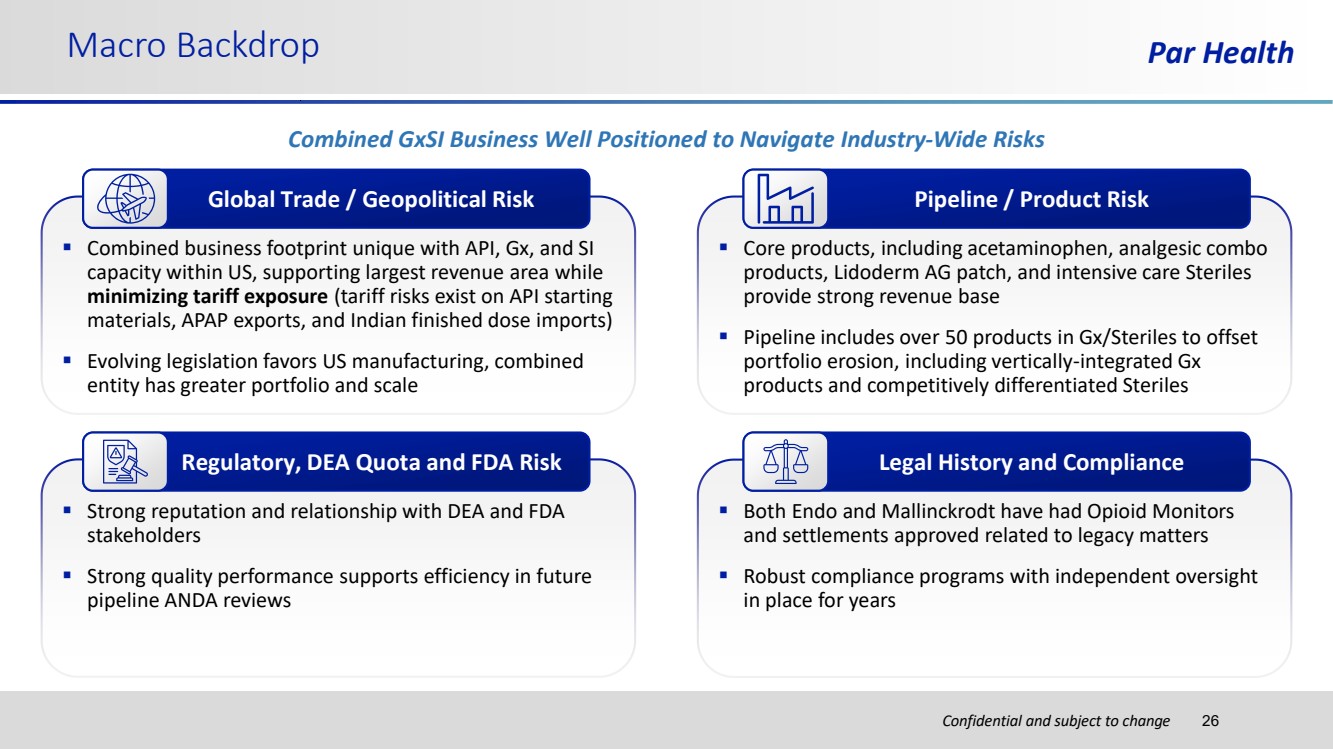
| Confidential and subject to change Par Health ▪ Combined business footprint unique with API, Gx, and SI capacity within US, supporting largest revenue area while minimizing tariff exposure (tariff risks exist on API starting materials, APAP exports, and Indian finished dose imports) ▪ Evolving legislation favors US manufacturing, combined entity has greater portfolio and scale Macro Backdrop ▪ Core products, including acetaminophen, analgesic combo products, Lidoderm AG patch, and intensive care Steriles provide strong revenue base ▪ Pipeline includes over 50 products in Gx/Steriles to offset portfolio erosion, including vertically-integrated Gx products and competitively differentiated Steriles ▪ Strong reputation and relationship with DEA and FDA stakeholders ▪ Strong quality performance supports efficiency in future pipeline ANDA reviews ▪ Both Endo and Mallinckrodt have had Opioid Monitors and settlements approved related to legacy matters ▪ Robust compliance programs with independent oversight in place for years Combined GxSI Business Well Positioned to Navigate Industry-Wide Risks Global Trade / Geopolitical Risk Pipeline / Product Risk Regulatory, DEA Quota and FDA Risk Legal History and Compliance 26 |
| Confidential and subject to change Par Health Confidential and subject to change Key Credit Highlights |

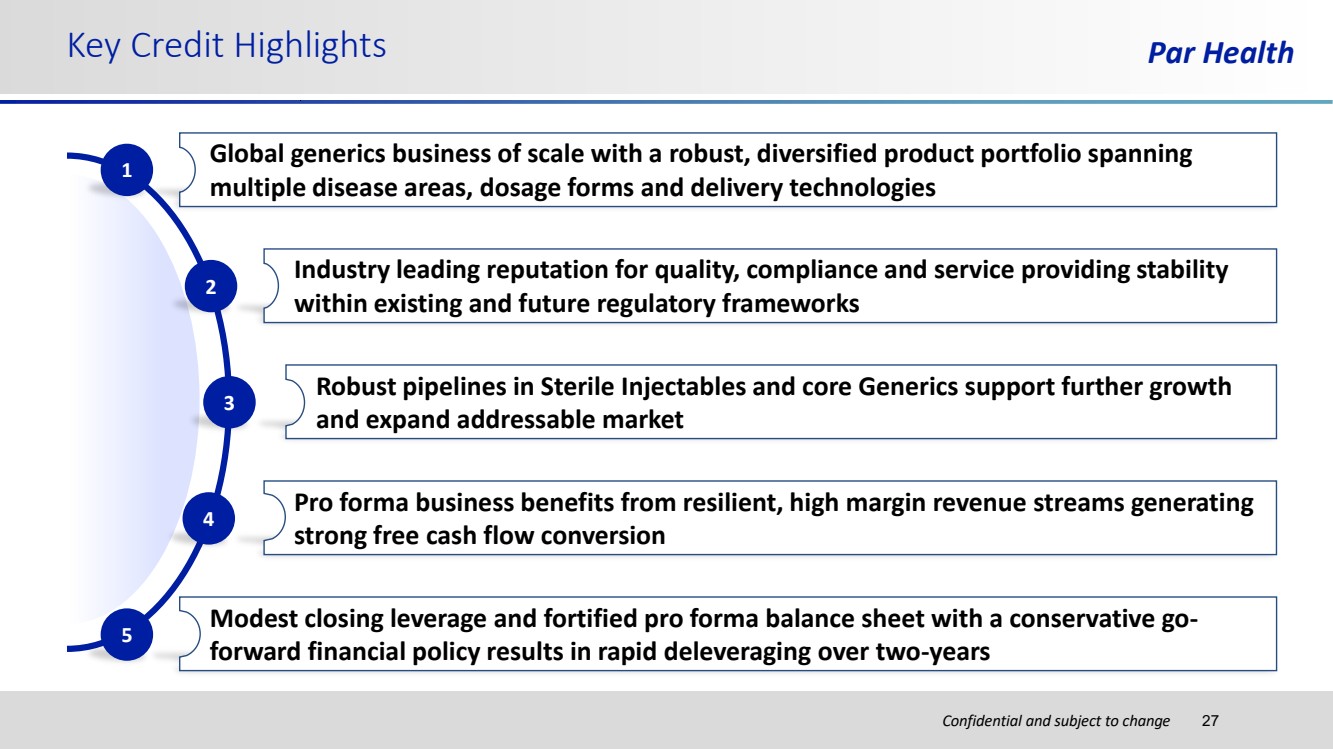
| Confidential and subject to change Key Credit Highlights Par Health 2 Industry leading reputation for quality, compliance and service providing stability within existing and future regulatory frameworks 3 Robust pipelines in Sterile Injectables and core Generics support further growth and expand addressable market 4 Pro forma business benefits from resilient, high margin revenue streams generating strong free cash flow conversion Modest closing leverage and fortified pro forma balance sheet with a conservative go-forward financial policy results in rapid deleveraging over two-years 5 1 Global generics business of scale with a robust, diversified product portfolio spanning multiple disease areas, dosage forms and delivery technologies 27 |
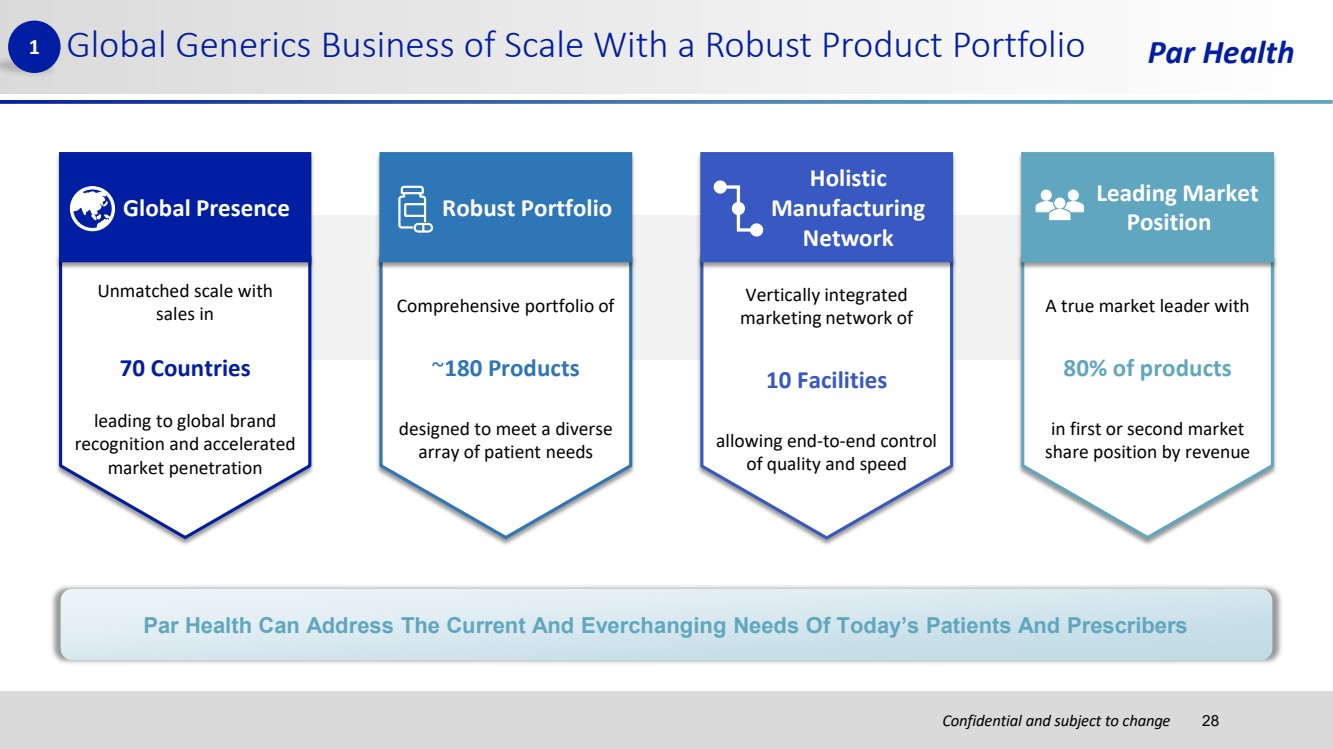
| Confidential and subject to change Par Health Click to edit Master title style Par Health Can Address The Current And Everchanging Needs Of Today’s Patients And Prescribers Comprehensive portfolio of ~180 Products designed to meet a diverse array of patient needs Robust Portfolio A true market leader with 80% of products in first or second market share position by revenue Leading Market Position Vertically integrated marketing network of 10 Facilities allowing end-to-end control of quality and speed Holistic Manufacturing Network Unmatched scale with sales in 70 Countries leading to global brand recognition and accelerated market penetration Global Presence 1 Global Generics Business of Scale With a Robust Product Portfolio 28 |
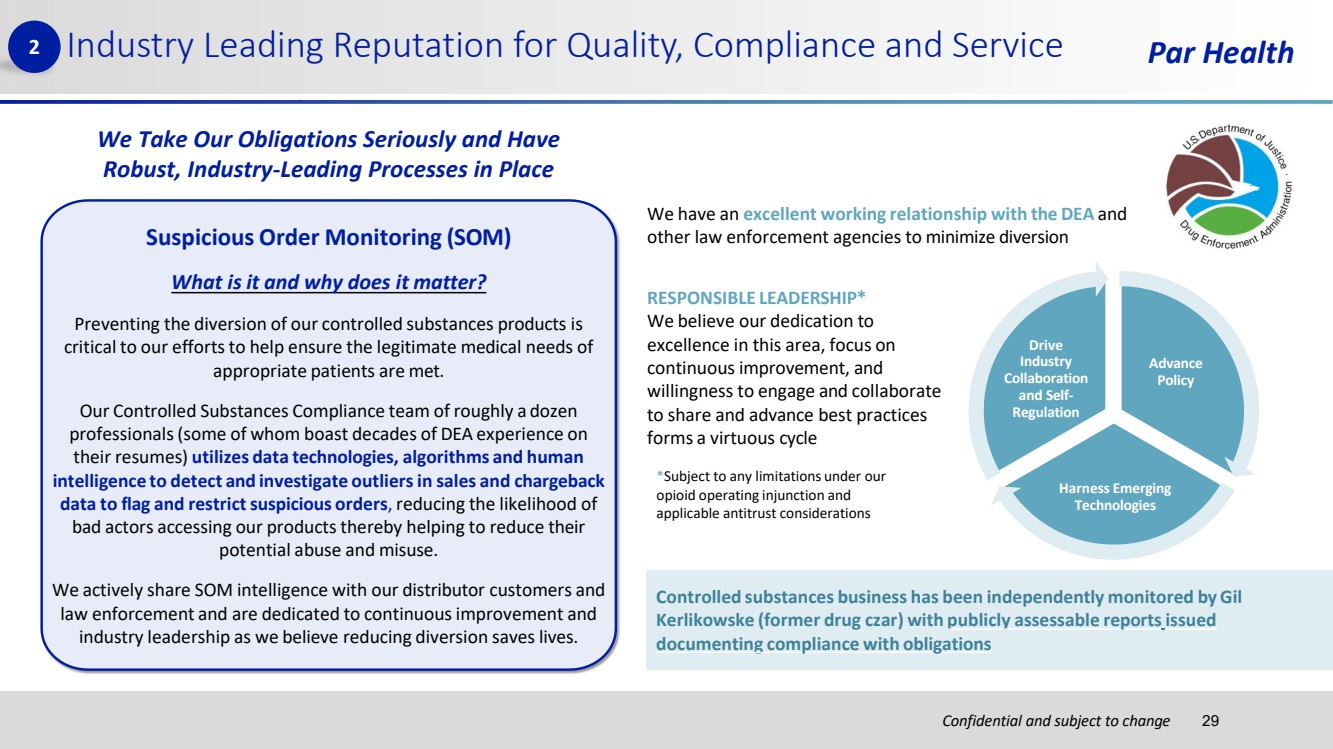
| Confidential and subject to change Par Health Suspicious Order Monitoring (SOM) What is it and why does it matter? Preventing the diversion of our controlled substances products is critical to our effortsto help ensure the legitimate medical needs of appropriate patients are met. Our Controlled Substances Compliance team of roughly a dozen professionals(some of whom boast decades of DEA experience on their resumes) utilizes data technologies, algorithms and human intelligence to detect and investigate outliersin sales and chargeback data to flag and restrictsuspicious orders, reducing the likelihood of bad actors accessing our products thereby helping to reduce their potential abuse and misuse. We actively share SOM intelligence with our distributor customers and law enforcement and are dedicated to continuousimprovement and industry leadership as we believe reducing diversion saves lives. We have an excellent working relationship with the DEA and other law enforcement agencies to minimize diversion Controlled substances business has been independently monitored by Gil Kerlikowske (former drug czar) with publicly assessable reportsissued documenting compliance with obligations Advance Policy Harness Emerging Technologies Drive Industry Collaboration and Self-Regulation RESPONSIBLE LEADERSHIP* We believe our dedication to excellence in this area, focus on continuous improvement, and willingness to engage and collaborate to share and advance best practices forms a virtuous cycle *Subject to any limitations under our opioid operating injunction and applicable antitrust considerations We Take Our Obligations Seriously and Have Robust, Industry-Leading Processes in Place 2 Industry Leading Reputation for Quality, Compliance and Service 29 |
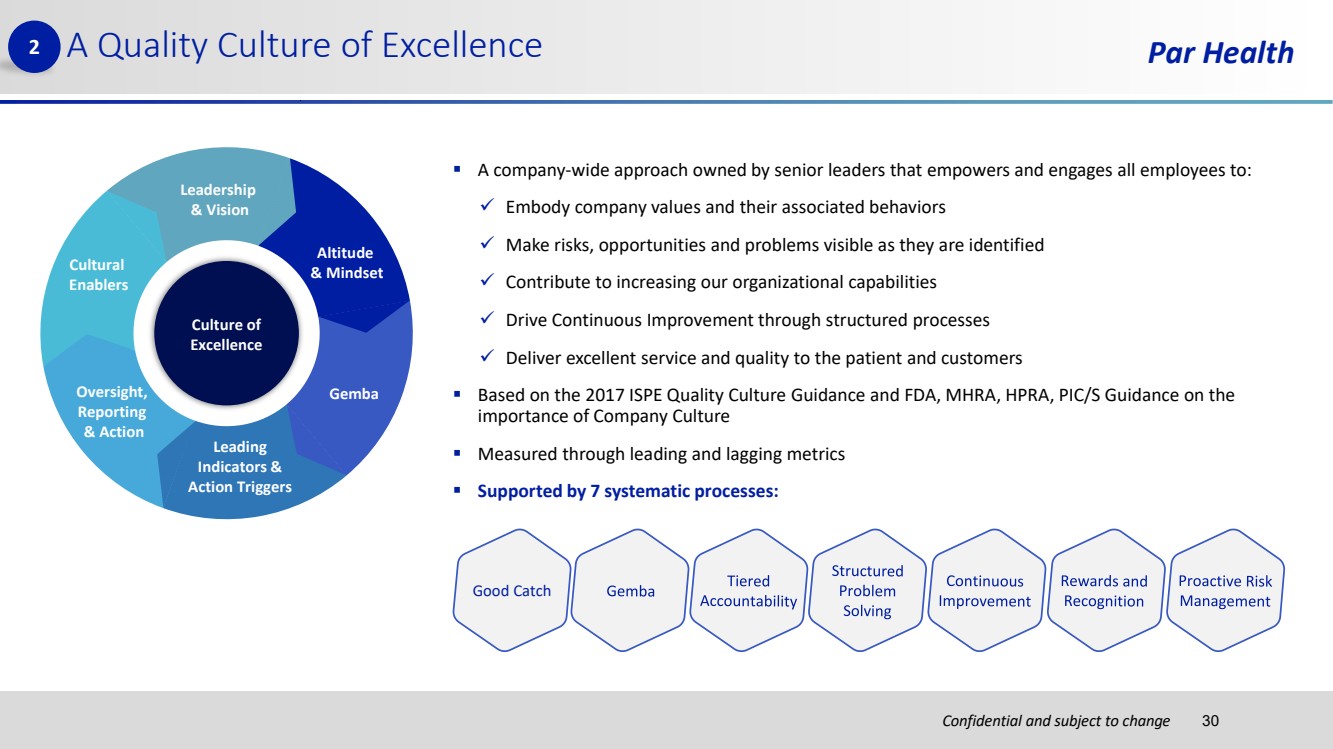
| Confidential and subject to change Par Health ▪ A company-wide approach owned by senior leaders that empowers and engages all employees to: ✓ Embody company values and their associated behaviors ✓ Make risks, opportunities and problems visible as they are identified ✓ Contribute to increasing our organizational capabilities ✓ Drive Continuous Improvement through structured processes ✓ Deliver excellent service and quality to the patient and customers ▪ Based on the 2017 ISPE Quality Culture Guidance and FDA, MHRA, HPRA, PIC/S Guidance on the importance of Company Culture ▪ Measured through leading and lagging metrics ▪ Supported by 7 systematic processes: A Quality Culture of Excellence Gemba Leadership & Vision Culture of Excellence Cultural Enablers Oversight, Reporting & Action Leading Indicators & Action Triggers Altitude & Mindset Good Catch 30 2 |
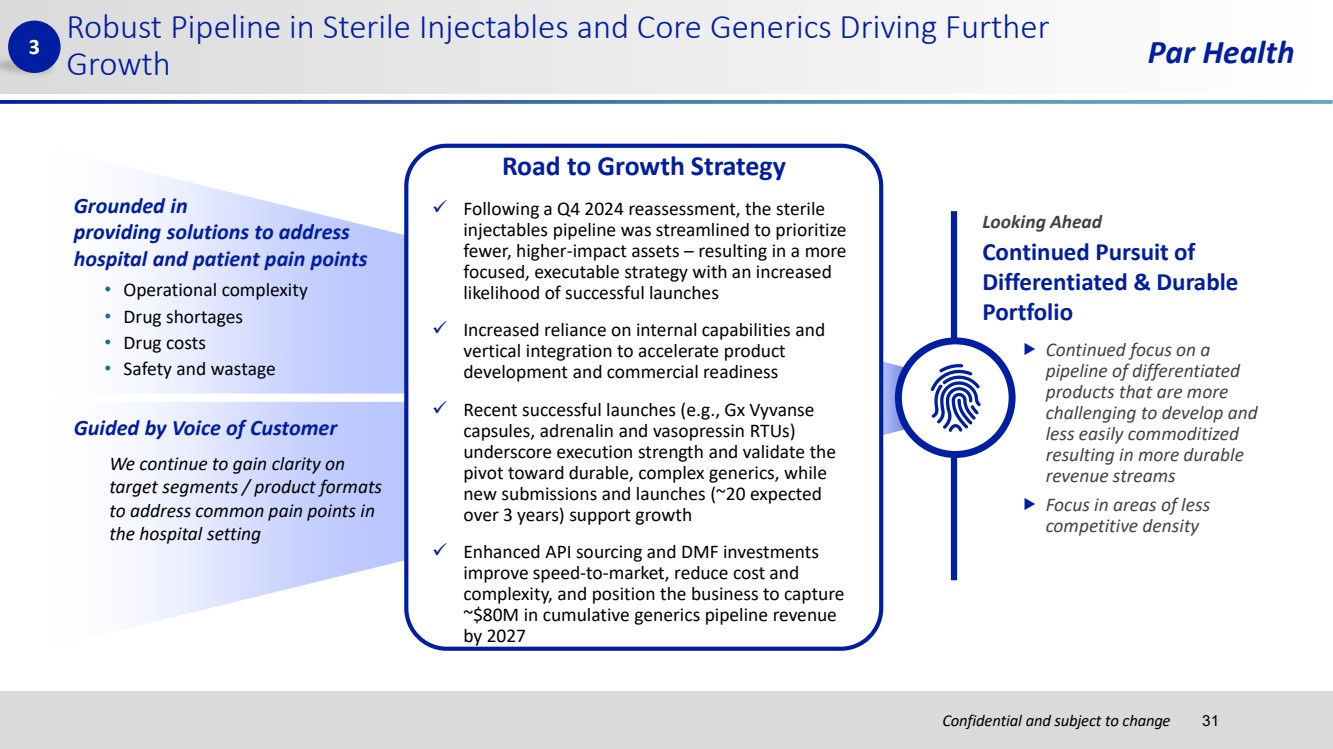
| Confidential and subject to change Par Health Robust Pipeline in Sterile Injectables and Core Generics Driving Further Growth Road to Growth Strategy ✓ Following a Q4 2024 reassessment, the sterile injectables pipeline was streamlined to prioritize fewer, higher-impact assets – resulting in a more focused, executable strategy with an increased likelihood of successful launches ✓ Increased reliance on internal capabilities and vertical integration to accelerate product development and commercial readiness ✓ Recent successful launches (e.g., Gx Vyvanse capsules, adrenalin and vasopressin RTUs) underscore execution strength and validate the pivot toward durable, complex generics, while new submissions and launches (~20 expected over 3 years) support growth ✓ Enhanced API sourcing and DMF investments improve speed-to-market, reduce cost and complexity, and position the business to capture ~$80M in cumulative generics pipeline revenue by 2027 • Operational complexity • Drug shortages • Drug costs • Safety and wastage Grounded in providing solutions to address hospital and patient pain points Guided by Voice of Customer We continue to gain clarity on target segments / product formats to address common pain points in the hospital setting Continued focus on a pipeline of differentiated products that are more challenging to develop and less easily commoditized resulting in more durable revenue streams Focus in areas of less competitive density Looking Ahead Continued Pursuit of Differentiated & Durable Portfolio 3 31 |
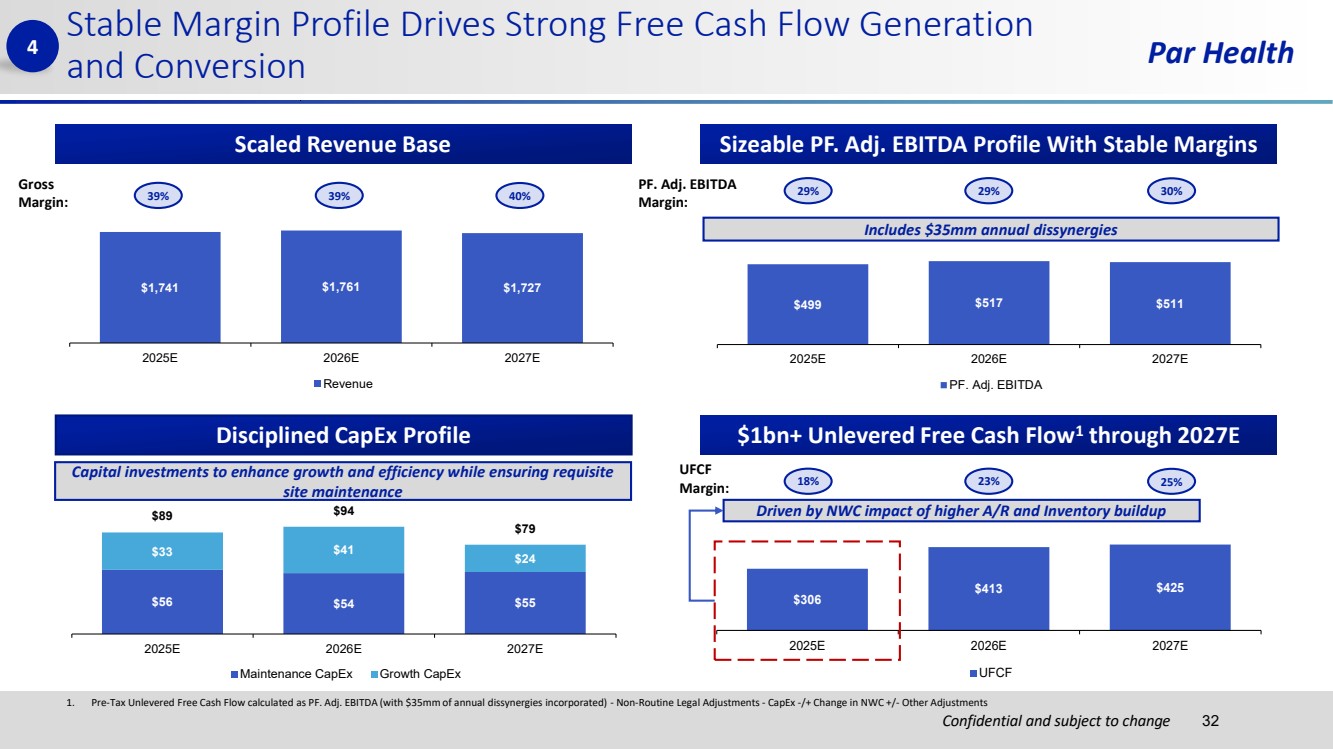
| Confidential and subject to change Par Health $306 $413 $425 2025E 2026E 2027E UFCF $56 $54 $55 $33 $41 $24 $89 $94 $79 2025E 2026E 2027E Maintenance CapEx Growth CapEx $499 $517 $511 2025E 2026E 2027E PF. Adj. EBITDA 1. Pre-Tax Unlevered Free Cash Flow calculated as PF. Adj. EBITDA (with $35mm of annual dissynergies incorporated) - Non-Routine Legal Adjustments - CapEx -/+ Change in NWC +/- Other Adjustments Stable Margin Profile Drives Strong Free Cash Flow Generation and Conversion 32 Scaled Revenue Base Disciplined CapEx Profile $1bn+ Unlevered Free Cash Flow1 through 2027E 4 Includes $35mm annual dissynergies Capital investments to enhance growth and efficiency while ensuring requisite site maintenance 39% 39% 40% 29% 29% 30% 18% 23% 25% Gross Margin: UFCF Margin: PF. Adj. EBITDA Margin: Driven by NWC impact of higher A/R and Inventory buildup $1,741 $1,761 $1,727 2025E 2026E 2027E Revenue Sizeable PF. Adj. EBITDA Profile With Stable Margins |
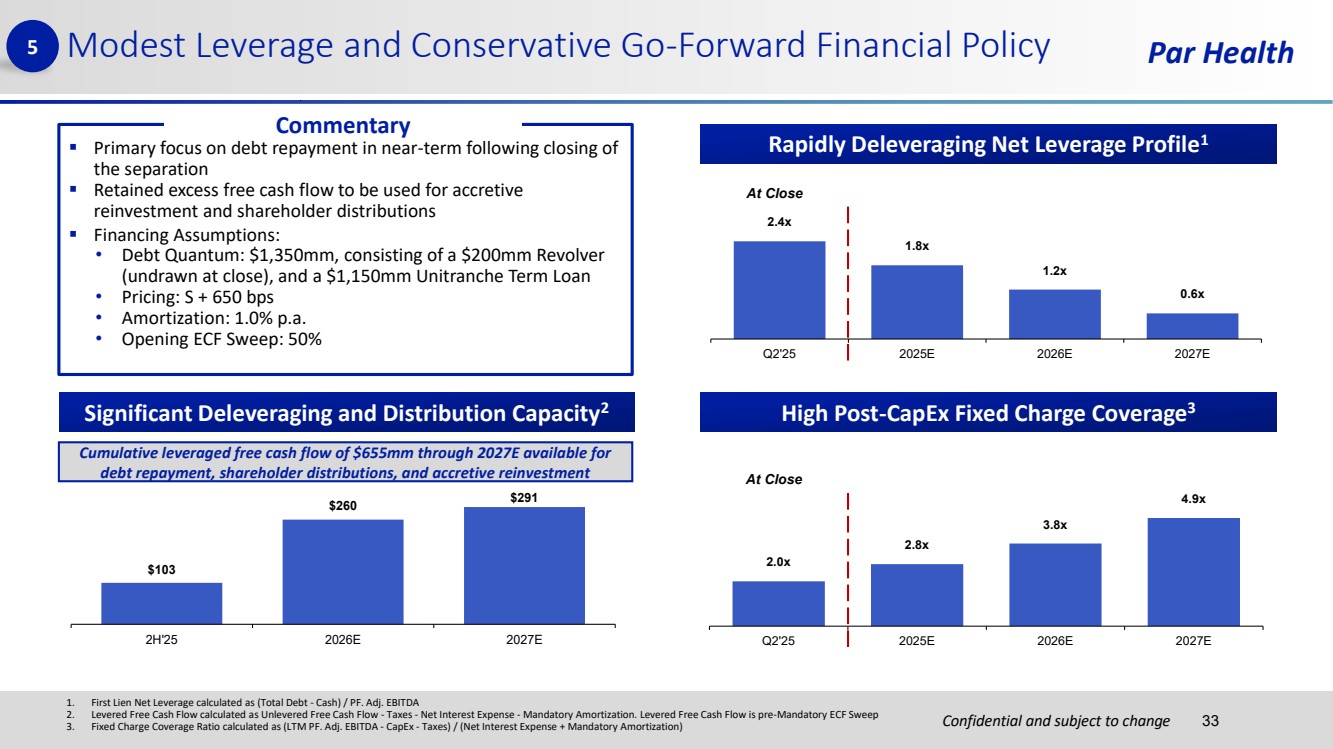
| Confidential and subject to change Par Health ▪ Primary focus on debt repayment in near-term following closing of the separation ▪ Retained excess free cash flow to be used for accretive reinvestment and shareholder distributions ▪ Financing Assumptions: • Debt Quantum: $1,350mm, consisting of a $200mm Revolver (undrawn at close), and a $1,150mm Unitranche Term Loan • Pricing: S + 650 bps • Amortization: 1.0% p.a. • Opening ECF Sweep: 50% 2.4x 1.8x 1.2x 0.6x Q2'25 2025E 2026E 2027E Modest Leverage and Conservative Go-Forward Financial Policy 33 Rapidly Deleveraging Net Leverage Profile1 Significant Deleveraging and Distribution Capacity2 5 High Post-CapEx Fixed Charge Coverage3 2.0x 2.8x 3.8x 4.9x Q2'25 2025E 2026E 2027E Commentary At Close At Close $103 $260 $291 2H'25 2026E 2027E Cumulative leveraged free cash flow of $655mm through 2027E available for debt repayment, shareholder distributions, and accretive reinvestment 1. First Lien Net Leverage calculated as (Total Debt - Cash) / PF. Adj. EBITDA 2. Levered Free Cash Flow calculated as Unlevered Free Cash Flow - Taxes - Net Interest Expense - Mandatory Amortization. Levered Free Cash Flow is pre-Mandatory ECF Sweep 3. Fixed Charge Coverage Ratio calculated as (LTM PF. Adj. EBITDA - CapEx - Taxes) / (Net Interest Expense + Mandatory Amortization) |
| Confidential and subject to change Par Health Confidential and subject to change Financial Overview |

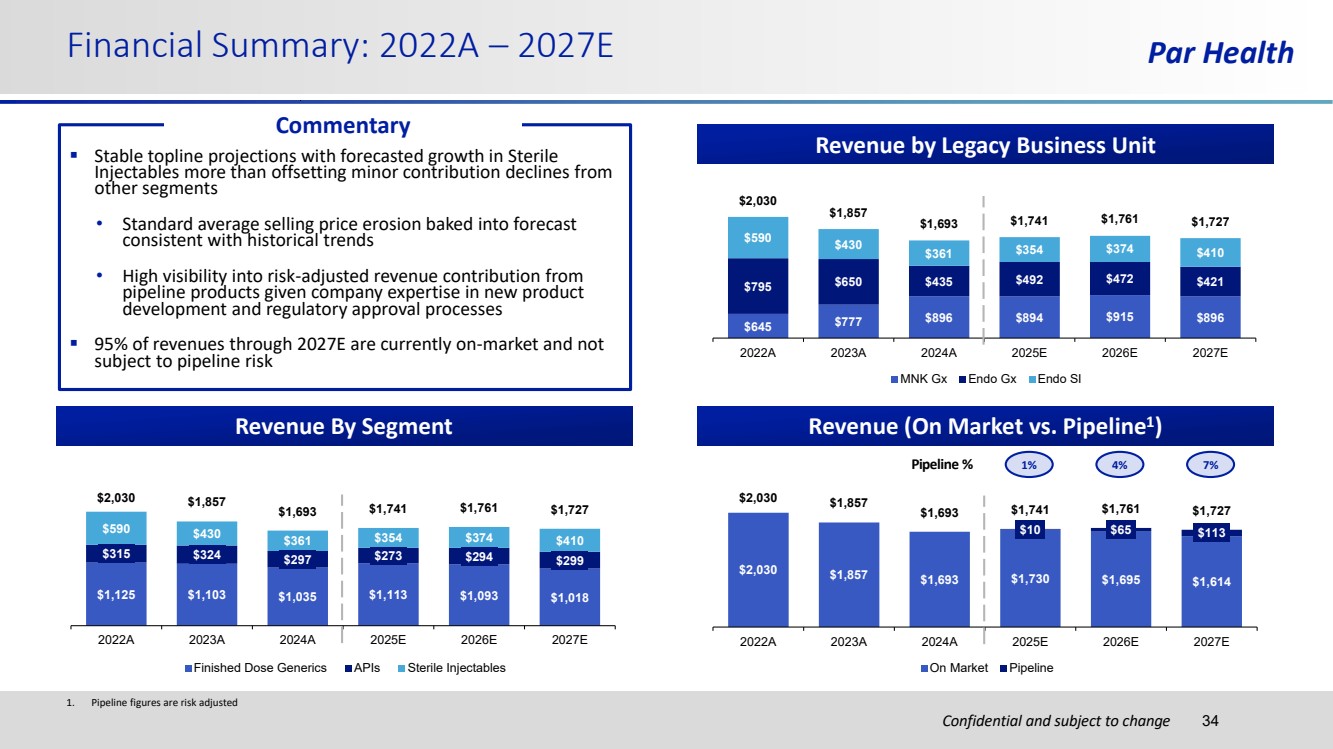
| Confidential and subject to change Financial Summary: 2022A – 2027E Par Health 34 Revenue by Legacy Business Unit Revenue By Segment 1. Pipeline figures are risk adjusted Revenue (On Market vs. Pipeline1 ) Pipeline % $2,030 $1,857 $1,693 $1,730 $1,695 $1,614 $10 $65 $113 $2,030 $1,857 $1,693 $1,741 $1,761 $1,727 2022A 2023A 2024A 2025E 2026E 2027E On Market Pipeline 1% 4% 7% ▪ Stable topline projections with forecasted growth in Sterile Injectables more than offsetting minor contribution declines from other segments • Standard average selling price erosion baked into forecast consistent with historical trends • High visibility into risk-adjusted revenue contribution from pipeline products given company expertise in new product development and regulatory approval processes ▪ 95% of revenues through 2027E are currently on-market and not subject to pipeline risk $645 $777 $896 $894 $915 $896 $795 $650 $435 $492 $472 $421 $590 $430 $361 $354 $374 $410 $2,030 $1,857 $1,693 $1,741 $1,761 $1,727 2022A 2023A 2024A 2025E 2026E 2027E MNK Gx Endo Gx Endo SI $1,125 $1,103 $1,035 $1,113 $1,093 $1,018 $315 $324 $297 $273 $294 $299 $590 $430 $361 $354 $374 $410 $2,030 $1,857 $1,693 $1,741 $1,761 $1,727 2022A 2023A 2024A 2025E 2026E 2027E Finished Dose Generics APIs Sterile Injectables Commentary |
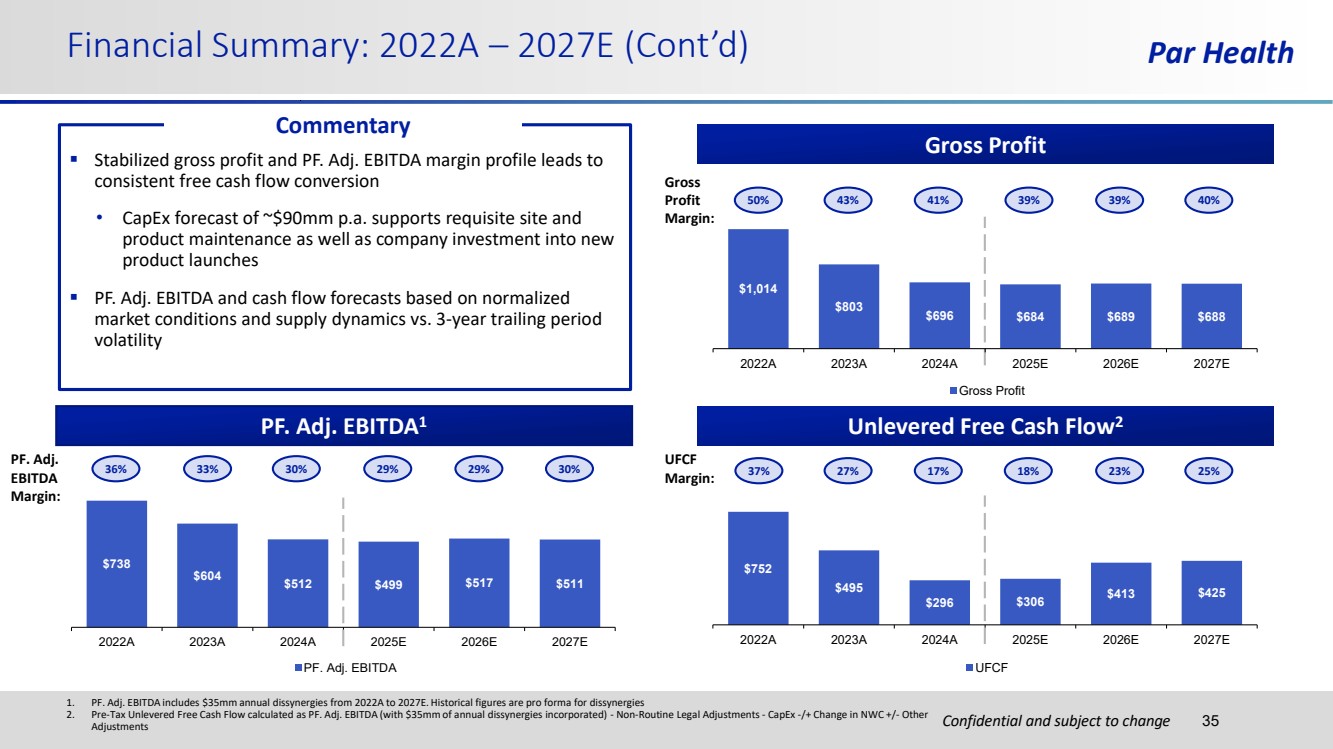
| Confidential and subject to change Par Health $752 $495 $296 $306 $413 $425 2022A 2023A 2024A 2025E 2026E 2027E UFCF $1,014 $803 $696 $684 $689 $688 2022A 2023A 2024A 2025E 2026E 2027E Gross Profit Financial Summary: 2022A – 2027E (Cont’d) 35 Gross Profit PF. Adj. EBITDA1 Unlevered Free Cash Flow2 $738 $604 $512 $499 $517 $511 2022A 2023A 2024A 2025E 2026E 2027E PF. Adj. EBITDA 1. PF. Adj. EBITDA includes $35mm annual dissynergies from 2022A to 2027E. Historical figures are pro forma for dissynergies 2. Pre-Tax Unlevered Free Cash Flow calculated as PF. Adj. EBITDA (with $35mm of annual dissynergies incorporated) - Non-Routine Legal Adjustments - CapEx -/+ Change in NWC +/- Other Adjustments ▪ Stabilized gross profit and PF. Adj. EBITDA margin profile leads to consistent free cash flow conversion • CapEx forecast of ~$90mm p.a. supports requisite site and product maintenance as well as company investment into new product launches ▪ PF. Adj. EBITDA and cash flow forecasts based on normalized market conditions and supply dynamics vs. 3-year trailing period volatility Commentary 36% 33% 30% 29% 29% 30% 37% 27% 17% 18% 23% 25% UFCF Margin: PF. Adj. EBITDA Margin: Gross Profit Margin: 50% 43% 41% 39% 39% 40% |
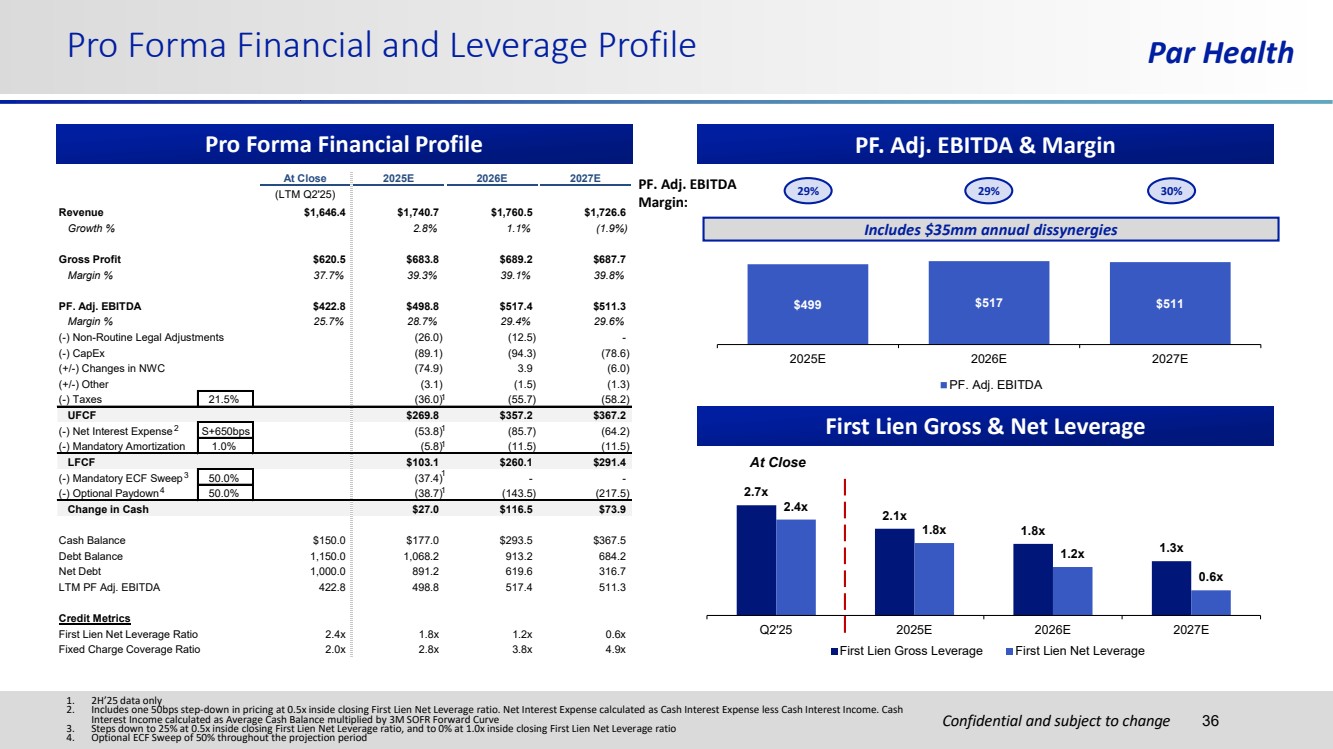
| Confidential and subject to change Par Health At Close 2025E 2026E 2027E (LTM Q2'25) Revenue $1,646.4 $1,740.7 $1,760.5 $1,726.6 Growth % 2.8% 1.1% (1.9%) Gross Profit $620.5 $683.8 $689.2 $687.7 Margin % 37.7% 39.3% 39.1% 39.8% PF. Adj. EBITDA $422.8 $498.8 $517.4 $511.3 Margin % 25.7% 28.7% 29.4% 29.6% (-) Non-Routine Legal Adjustments (26.0) (12.5) - (-) CapEx (89.1) (94.3) (78.6) (+/-) Changes in NWC (74.9) 3.9 (6.0) (+/-) Other (3.1) (1.5) (1.3) (-) Taxes 21.5% (36.0) (55.7) (58.2) UFCF $269.8 $357.2 $367.2 (-) Net Interest Expense S+650bps (53.8) (85.7) (64.2) (-) Mandatory Amortization 1.0% (5.8) (11.5) (11.5) LFCF $103.1 $260.1 $291.4 (-) Mandatory ECF Sweep 50.0% (37.4) - - (-) Optional Paydown 50.0% (38.7) (143.5) (217.5) Change in Cash $27.0 $116.5 $73.9 Cash Balance $150.0 $177.0 $293.5 $367.5 Debt Balance 1,150.0 1,068.2 913.2 684.2 Net Debt 1,000.0 891.2 619.6 316.7 LTM PF Adj. EBITDA 422.8 498.8 517.4 511.3 Credit Metrics First Lien Net Leverage Ratio 2.4x 1.8x 1.2x 0.6x Fixed Charge Coverage Ratio 2.0x 2.8x 3.8x 4.9x Pro Forma Financial and Leverage Profile 36 Pro Forma Financial Profile PF. Adj. EBITDA & Margin 2.7x 2.1x 1.8x 1.3x 2.4x 1.8x 1.2x 0.6x Q2'25 2025E 2026E 2027E First Lien Gross Leverage First Lien Net Leverage At Close 1 3 2 4 1 1 1 1 $499 $517 $511 2025E 2026E 2027E PF. Adj. EBITDA Includes $35mm annual dissynergies 29% 29% 30% PF. Adj. EBITDA Margin: 1. 2H’25 data only 2. Includes one 50bps step-down in pricing at 0.5x inside closing First Lien Net Leverage ratio. Net Interest Expense calculated as Cash Interest Expense less Cash Interest Income. Cash Interest Income calculated as Average Cash Balance multiplied by 3M SOFR Forward Curve 3. Steps down to 25% at 0.5x inside closing First Lien Net Leverage ratio, and to 0% at 1.0x inside closing First Lien Net Leverage ratio 4. Optional ECF Sweep of 50% throughout the projection period First Lien Gross & Net Leverage |
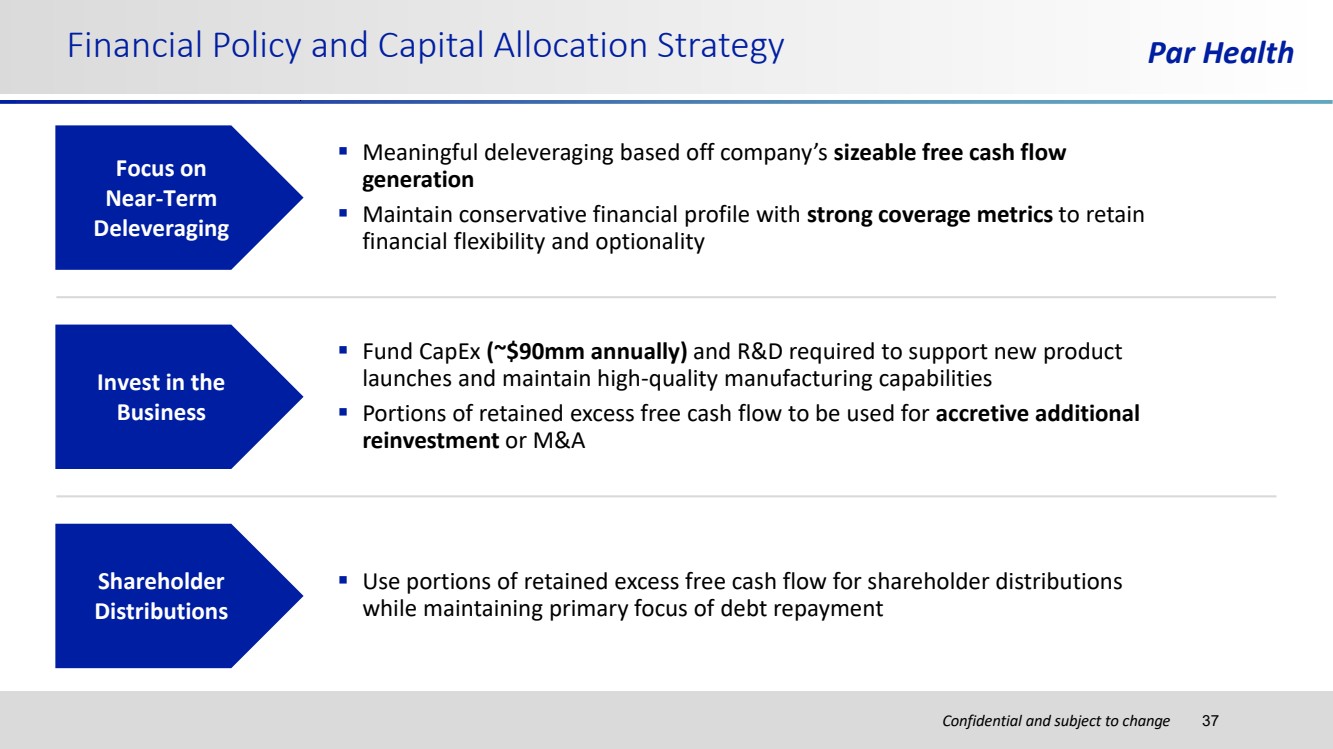
| Confidential and subject to change Financial Policy and Capital Allocation Strategy Par Health 37 Focus on Near-Term Deleveraging Shareholder Distributions Invest in the Business ▪ Meaningful deleveraging based off company’s sizeable free cash flow generation ▪ Maintain conservative financial profile with strong coverage metrics to retain financial flexibility and optionality ▪ Use portions of retained excess free cash flow for shareholder distributions while maintaining primary focus of debt repayment ▪ Fund CapEx (~$90mm annually) and R&D required to support new product launches and maintain high-quality manufacturing capabilities ▪ Portions of retained excess free cash flow to be used for accretive additional reinvestment or M&A |
| Confidential and subject to change Disclaimer Par Health 38 This Investor Presentation (“presentation”) contains confidential information regarding the businesses of Endo, Inc. and its subsidiaries (collectively, “Endo”) and Mallinckrodt plc and its subsidiaries (collectively, “Mallinckrodt” and together with Endo, the “Companies”). By accepting this presentation, the recipient agrees that it will cause its directors, officers, employees and representatives to maintain the confidentiality of the information contained herein. The recipient understands and acknowledges that neither the Companies nor their advisors nor any of their representatives have made or are making, and the recipient and the recipient’s representatives are not relying on, any representation or warranty, expressed or implied, as to the timeliness, accuracy or completeness of this presentation. Neither the Companies nor their advisors shall have any responsibility whatsoever in respect of the accuracy or completeness of, or omissions from, this presentation or any other document or information, written or oral, supplied at any time to any recipient of this presentation or its subsidiaries, affiliates, agents or advisors in the course of its evaluation of the Companies or in respect of any opinions, projections or other forward-looking statements expressed therein or omitted therefrom. The Companies and their affiliates and representatives expressly disclaim any and all liability based, in whole or in part, on the presentation or any such documents or information, or any errors or omissions therefrom. In addition, no such party is under any obligation to update this presentation or correct any inaccuracies or omissions in it that may exist or become apparent or to provide the recipient with access to any additional information. Further, the Companies’ capital structures are subject to change, and there can be no assurance that they will not differ from the information contained in this presentation. This presentation includes certain statements, claims, estimates, predictions and other information with respect to the anticipated future performance of the Companies. Such statements include or are based on “forward looking statements” within the meaning of Section 27A of the Securities Act of 1933 as amended and Section 21E of the Securities Exchange Act of 1934 as amended. Such statements have been based on assumptions and subjective judgments and analysis by the Companies or others, and there can be no assurance that any such statements are attainable or will be realized and have been included solely for illustrative purposes. These forward-looking statements involve risks and uncertainties, many of which are outside of the Companies’ control, and could, individually or in the aggregate, have a material adverse effect on the Companies’ business, financial condition, results of operations and cash flows. No representations are made as to the accuracy of such statements. Actual results may vary from the projected results contained or referred to herein and such projections are subject to certain risk factors including, without limitation, those discussed under the heading "Risk Factors" in each Company’s most recent Annual Report on Form 10-K and any subsequent Quarterly Reports on Form 10-Q or other filings with the U.S. Securities and Exchange Commission. The Companies undertake no obligation to update any forward-looking statements after the date of this document for any reason. Neither this presentation nor any additional information which may subsequently be provided to the recipient of this presentation shall constitute or form part of any offer to sell or invitation to purchase securities of the Companies, nor shall it constitute the basis of any definitive agreement. This presentation does not purport to contain all of the information that may be required to evaluate a transaction or investment. Potential investors are responsible for conducting their own investigations and analyses of the Companies. Non-GAAP financial measures including adjusted earnings before interest, taxes, depreciation and amortization (“Adjusted EBITDA”), free cash flow and gross profit are included in this presentation because they are used by management and certain investors to measure the Companies’ financial performance. Non-GAAP financial measures should not be considered a substitute for financial measures prepared in accordance with accounting principles generally accepted in the United States (“GAAP”) and may not be comparable to similarly titled measures reported by other companies. |