The following performance information provides some indication of the risks of investing in the Hodges Fund. The bar chart below illustrates how Retail Class shares of the Hodges Fund’s total returns have varied from year to year for the past 10 calendar years. The table below illustrates how the Hodges Fund’s average annual total returns for the 1-year, 5-year and 10-year periods compare with that of a broad-based securities index. The Hodges Fund’s past performance (before and after taxes) is not necessarily an indication of how it will perform in the future. Updated performance information is available on the Fund’s website at www.hodgescapital.com/mutual-funds.
Prior performance shown below is for the Predecessor Hodges Fund (the Hodges Fund, a former series of Professionally Managed Portfolios) for dates prior to September 25, 2023. The Hodges Fund has adopted the performance of the Predecessor Hodges Fund as a result of a reorganization in which the Hodges Fund has acquired all the assets and liabilities of the Predecessor Hodges Fund (the “Reorganization”). Prior to the Reorganization, the Hodges Fund was a newly formed “shell” fund with no assets and had not commenced operations.
The Hodges Fund’s portfolio management team served as the portfolio management team of the Predecessor Hodges Fund and has been the Hodges Fund’s portfolio management team since inception.
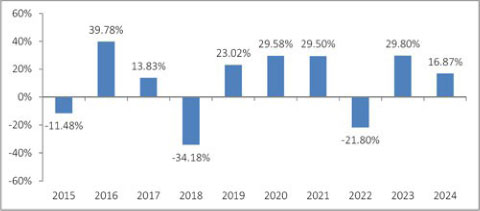
The Hodges Fund’s year-to-date return for Retail Class shares as of the most recent calendar quarter ended June 30, 2025, was 9.47%.
| Highest Quarterly Return: | 2Q, 2020 | 54.30% |
| Lowest Quarterly Return: | 1Q, 2020 | -44.27% |
| One Year |
Five Years |
Ten Years | |
| Hodges Fund | |||
| Retail Class Shares | |||
| Return Before Taxes | 16.87% | 14.76% | 8.54% |
| Return After Taxes on Distributions | 15.58% | 14.44% | 7.80% |
| Return After Taxes on Distributions and Sale of Fund Shares | 11.06% | 11.91% | 6.67% |
| S&P 500® Index (reflects no deduction for fees, expenses or taxes) | 25.02% | 14.53% | 13.10% |
After tax returns depend on an investor’s tax situation and may differ from those shown. After tax returns are calculated using the historical highest individual federal marginal income tax rates in effect and do not reflect the effect of state and local taxes. The after-tax returns shown may not be relevant to those investors who hold their shares through tax-deferred arrangements such as 401(k) plans or individual retirement accounts (“IRAs”). “Return After Taxes on Distributions” shows the effect of taxable distributions (dividends and capital gains distributions) but assumes that Fund shares are still held at the end of the period.
The S&P 500 Index is an unmanaged market capitalization weighted index of 500 of the largest capitalized U.S. domiciled companies. Investors may not invest in the indexes directly; unlike the Fund’s returns, the indexes do not reflect any fees or expenses.
The following performance information provides some indication of the risks of investing in the Small Cap Growth Fund. The bar chart below illustrates how Retail Class shares of the Small Cap Growth Fund’s total returns have varied from year to year for the past 10 calendar years. The table below illustrates how the Small Cap Growth Fund’s average annual total returns for 1-year, 5-year and 10-year periods compare with that of:
| ● | a broad-based securities market index that represents the overall domestic equity market (the “Regulatory Benchmark”) which the Fund has added to comply with new regulatory requirements and thus may not necessarily represent the Fund’s principal investment strategies; and |
| ● | a small-capitalization domestic equity market index that the Adviser considers to be representative of the small-capitalization domestic equity markets and the Fund’s principal investment strategies. The Adviser considers the small-capitalization domestic equity markets index to continue to be the appropriate benchmark index for the Fund for performance comparison. |
The Small Cap Growth Fund’s past performance (before and after taxes) is not necessarily an indication of how it will perform in the future. Updated performance information is available on the Fund’s website at www.hodgescapital.com/mutual-funds.
Prior performance shown below is for the Predecessor Small Cap Fund (the Hodges Small Cap Fund, a former series of Professionally Managed Portfolios), for dates prior to September 25, 2023. The Hodges Small Cap Growth Fund has adopted the performance of the Predecessor Small Cap Fund as a result of a reorganization in which the Small Cap Growth Fund has acquired all the assets and liabilities of the Predecessor Small Cap Fund (the “Reorganization”). Prior to the Reorganization, the Small Cap Growth Fund was a newly formed “shell” fund with no assets and had not commenced operations.
The Small Cap Growth Fund’s portfolio management team served as the portfolio management team of the Predecessor Small Cap Growth Fund and has been the Small Cap Growth Fund’s portfolio management team since inception.
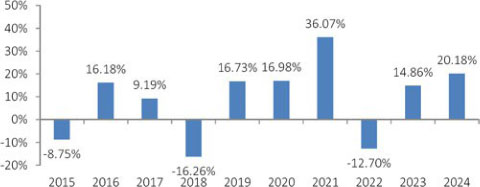
| 1 | The returns shown in the bar chart are for Retail Class shares. The performance of Institutional Class shares and Class A shares will differ due to differences in expenses. |
The Small Cap Growth Fund’s year-to-date return for Retail Class shares as of the most recent calendar quarter ended June 30, 2025, was (7.49)%.
| Highest Quarterly Return: | 2Q, 2020 | 40.59% |
| Lowest Quarterly Return: | 1Q, 2020 | -39.63% |
| One Year |
Five Years |
Ten Years | |
| Small Cap Growth Fund | |||
| Retail Class Shares | |||
| Return Before Taxes | 20.18% | 13.91% | 8.06% |
| Return After Taxes on Distributions | 16.60% | 11.52% | 6.23% |
| Return After Taxes on Distributions and Sale of Fund Shares | 14.72% | 10.74% | 6.07% |
| Institutional Class Shares | |||
| Return Before Taxes | 20.47% | 14.20% | 8.34% |
| S&P 500 Total Return Index (reflects no deduction for fees, expenses or taxes) (Regulatory Benchmark) | 25.02% | 14.53% | 13.10% |
| Russell 2000® Total Return Index (reflects no deduction for fees, expenses or taxes) | 11.54% | 7.40% | 7.82% |
| (1) | Class A shares have not commenced operations as of the date of this Prospectus. Class A shares will have substantially similar annual returns to Retail Class shares because the shares are invested in the same portfolio of securities and the annual returns would differ only to the extent that the Classes do not have the same expenses |
After tax returns depend on an investor’s tax situation and may differ from those shown. After tax returns are calculated using the historical highest individual federal marginal income tax rates in effect and do not reflect the effect of state and local taxes. The after-tax returns shown may not be relevant to those investors who hold their shares through tax-deferred arrangements such as 401(k) plans or individual retirement accounts (“IRAs”). “Return After Taxes on Distributions” shows the effect of taxable distributions (dividends and capital gains distributions) but assumes that Fund shares are still held at the end of the period.
The S&P 500 Total Return Index is an unmanaged index of 500 common stocks that is generally considered representative of the U.S. stock market. It tracks both the capital gains of a group of stocks over time and assumes that any cash distributions, such as dividends, are reinvested back into the index.
The Russell 2000 Total Return is a stock index that tracks 2,000 small cap companies in the United States. A small cap stock is a company with a market capitalization less than $2 billion. It tracks both the capital gains of a group of stocks over time and assumes that any cash distributions, such as dividends, are reinvested back into the index.
Investors may not invest in the indexes directly; unlike the Fund’s returns, the indexes do not reflect any fees or expenses.
The following performance information provides some indication of the risks of investing in the Small Intrinsic Value Fund. The bar chart below illustrates how Retail Class shares of the Small Intrinsic Value Fund’s total returns have varied from year to year. The table below illustrates how the Small Intrinsic Value Fund’s average annual total returns for the 1-year, 5-year and since inception periods compare with:
| ● | a broad-based securities market index that represents the overall domestic equity market (the “Regulatory Benchmark”) which the Fund has added to comply with new regulatory requirements and thus may not necessarily represent the Fund’s principal investment strategies; and |
| ● | a small-capitalization value domestic equity market index that the Adviser considers to be representative of the small-capitalization value domestic equity markets and the Fund’s principal investment strategies. The Adviser considers the small-capitalization domestic equity markets index to continue to be the appropriate benchmark index for the Fund for performance comparison. |
Because Institutional Class shares commenced operations on July 30, 2024 and do not have a full calendar year of performance, the table only shows the average annual returns for Retail Class shares.
The Small Intrinsic Value Fund’s past performance (before and after taxes) is not necessarily an indication of how it will perform in the future. Updated performance information is available on the Fund’s website at www.hodgescapital.com/mutual-funds.
Prior performance shown below is for the Predecessor Small Intrinsic Value Fund (the Hodges Small Intrinsic Value Fund, a former series of Professionally Managed Portfolios) for dates prior to September 25, 2023. The Small Intrinsic Value Fund has adopted the performance of the Predecessor Small Intrinsic Value Fund as a result of a reorganization in which the Small Intrinsic Value Fund has acquired all the assets and liabilities of the Predecessor Small Intrinsic Value Fund (the “Reorganization”). Prior to the Reorganization, the Small Intrinsic Value Fund was a newly formed “shell” fund with no assets and had not commenced operations.
The Small Intrinsic Value Fund’s portfolio management team served as the portfolio management team of the Predecessor Small Intrinsic Value Fund and has been the Small Intrinsic Value Fund’s portfolio management team since inception.
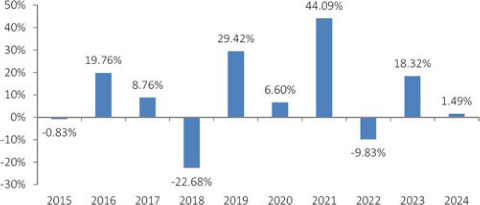
| 1 | The returns shown in the bar chart are for Retail Class shares. The performance of Institutional Class shares will differ due to differences in expenses. |
The Small Intrinsic Value Fund’s year-to-date return for Retail Class shares as of the most recent calendar quarter ended June 30, 2025, was (9.96)%.
| Highest Quarterly Return: | Q2, 2020 | 40.20% |
| Lowest Quarterly Return: | Q1, 2020 | -46.23% |
| One Year |
Five Years |
Ten Years | |
| Retail Class Shares | |||
| Return Before Taxes | 1.49% | 10.71% | 7.96% |
| Return After Taxes on Distributions | 0.80% | 10.08% | 7.33% |
| Return After Taxes on Distributions and Sale of Fund Shares | 1.45% | 8.47% | 6.33% |
| S&P 500 Total Return Index (reflects no deduction for fees, expenses or taxes) (Regulatory Benchmark) | 25.02% | 14.53% | 13.10% |
| Russell 2000® Total Return Index (reflects no deduction for fees, expenses or taxes) | 11.54% | 7.40% | 7.82% |
| Russell 2000® Value Total Return Index (reflects no deduction for fees, expenses or taxes) | 8.05% | 7.29% | 7.14% |
After tax returns depend on an investor’s tax situation and may differ from those shown. After tax returns are calculated using the historical highest individual federal marginal income tax rates in effect and do not reflect the effect of state and local taxes. The after-tax returns shown may not be relevant to those investors who hold their shares through tax-deferred arrangements such as 401(k) plans or individual retirement accounts (“IRAs”). “Return After Taxes on Distributions” shows the effect of taxable distributions (dividends and capital gains distributions) but assumes that Fund shares are still held at the end of the period.
The S&P 500 Total Return Index is an unmanaged index of 500 common stocks that is generally considered representative of the U.S. stock market. It tracks both the capital gains of a group of stocks over time and assumes that any cash distributions, such as dividends, are reinvested back into the index.
The Russell 2000 Total Return Index is a stock index that tracks 2,000 small cap companies in the United States. A small cap stock is a company with a market capitalization less than $2 billion. It tracks both the capital gains of a group of stocks over time and assumes that any cash distributions, such as dividends, are reinvested back into the index.
The Russell 2000 Value Total Return Index is a stock index measures the performance of the small-cap value segment of the US equity universe. It includes those Russell 2000 companies with relatively lower price-to-book ratios, lower I/B/E/S forecast medium term growth, and lower sales per share historical growth. It tracks both the capital gains of a group of stocks over time and assumes that any cash distributions, such as dividends, are reinvested back into the index.
Investors may not invest in the indexes directly; unlike the Fund’s returns, the indexes do not reflect any fees or expenses.
The following performance information provides some indication of the risks of investing in the Blue Chip Equity Income Fund. The bar chart below illustrates how shares of the Blue Chip Equity Income Fund’s total returns have varied from year to year. The table below illustrates how the Blue Chip Equity Income Fund’s average annual total returns for the 1-year, 5-year and 10-year periods compare with that of a broad-based securities index. The Blue Chip Equity Income Fund’s past performance (before and after taxes) is not necessarily an indication of how it will perform in the future. Updated performance information is available on the Fund’s website at www.hodgescapital.com/mutual-funds. Note that the Fund changed its investment strategy to mandate an 80% investment in large capitalization income producing equity securities, effective March 28, 2016. Prior thereto, the Fund’s strategy did not mandate that level of investment in large capitalization income producing securities, and the Fund’s portfolio did not always maintain that level of investment in large capitalization income producing securities. The performance shown below for periods prior to the change in the Fund’s investment strategy was achieved under the Fund’s former investment strategy.
Prior performance shown below is for the Predecessor Blue Chip Equity Income Fund (the Hodges Blue Chip Equity Income Fund, a former series of Professionally Managed Portfolios), for dates prior to September 25, 2023. The Blue Chip Equity Income Fund has adopted the performance of the Predecessor Blue Chip Equity Income Fund as a result of a reorganization in which the Blue Chip Equity Income Fund has acquired all the assets and liabilities of the Predecessor Blue Chip Equity Income Fund (the “Reorganization”). Prior to the Reorganization, the Blue Chip Equity Income Fund was a newly formed “shell” fund with no assets and had not commenced operations.
The Blue Chip Equity Income Fund’s portfolio management team served as the portfolio management team of the Predecessor Blue Chip Equity Income Fund and has been the Blue Chip Equity Income Fund’s portfolio management team since inception.
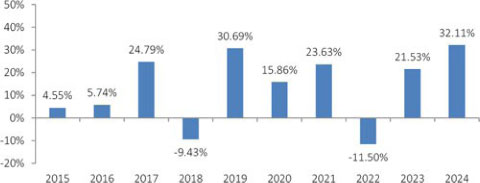
The Blue Chip Equity Income Fund’s year-to-date return as of the most recent calendar quarter ended June 30, 2025, was 9.40%.
| Highest Quarterly Return: | 2Q, 2020 | 25.34% |
| Lowest Quarterly Return: | 1Q, 2020 | -22.67% |
| One Year |
Five Years |
Ten Years | |
| Retail Class Shares | |||
| Return Before Taxes | 32.11% | 15.27% | 12.76% |
| Return After Taxes on Distributions | 28.14% | 13.16% | 10.83% |
| Return After Taxes on Distributions and Sale of Fund Shares | 21.66% | 11.83% | 9.99% |
| Russell 1000® Total Return Index (reflects no deduction for fees, expenses or taxes) | 24.51% | 14.28% | 12.87% |
| S&P 500 Total Return Index (reflects no deduction for fees, expenses or taxes | 25.02% | 14.53% | 13.10% |
After tax returns depend on an investor’s tax situation and may differ from those shown. After tax returns are calculated using the historical highest individual federal marginal income tax rates in effect and do not reflect the effect of state and local taxes. The after-tax returns shown may not be relevant to those investors who hold their shares through tax-deferred arrangements such as 401(k) plans or individual retirement accounts (“IRAs”). “Return After Taxes on Distributions” shows the effect of taxable distributions (dividends and capital gains distributions) but assumes that Fund shares are still held at the end of the period.
The Russell 1000 Total Return Index is a subset of the Russell 3000 Index that includes approximately 1,000 of the largest companies in the US equity universe. It tracks both the capital gains of a group of stocks over time and assumes that any cash distributions, such as dividends, are reinvested back into the index.
The S&P 500 Total Return Index is an unmanaged index of 500 common stocks that is generally considered representative of the U.S. stock market. It tracks both the capital gains of a group of stocks over time and assumes that any cash distributions, such as dividends, are reinvested back into the index.
Investors may not invest in the indexes directly; unlike the Fund’s returns, the indexes do not reflect any fees or expenses.