Exhibit 99.1
Quarter ended June 3 0 , 2025 Results Lafayette Square USA, Inc.
2 Important Information [1] Forward - looking statements can be identified by the use of forward - looking terminology such as "may," "will," "should," "expect," "anticipate," "project," "estimate," "intend," "continue" or "believe" or the negatives thereof or other variations thereon or comparable terminology. This presentation is for informational purposes only and includes proprietary information of Lafayette Square Holding Company, LLC and its affiliates (collectively herein "Lafayette Square") . This document may not be copied, reproduced or disclosed (in whole or in part) to anyone without Lafayette Square's express written permission . This presentation does not constitute an offer to sell or the solicitation of an offer to purchase any securities of any fund managed by Lafayette Square . Any such offer or solicitation may be made only by means of the delivery of a confidential private placement memorandum for Lafayette Square USA, Inc . (the "BDC"), which is managed by LS BDC Adviser, LLC ("LS Adviser") . This presentation should not be used as the sole basis for making a decision as to whether or not to invest in any fund or account managed by Lafayette Square . In making an investment decision, an investor must rely on their own examination of any such fund and the terms of the offering relating thereto . Contents of this presentation should not be construed as legal, tax, investment or other advice, or a recommendation to purchase or sell any particular security . There is no assurance that the BDC will achieve its investment objectives . An investor could lose all or substantially all of his, her or its investment . Statements included herein may constitute "forward - looking statements" 1 , which may relate to future events or our future performance or financial condition of Lafayette Square . These statements are not guarantees of future results or financial condition and involve a number of risks and uncertainties, including statements as to : our future operating results ; our business prospects and the prospects of our portfolio companies ; the effect of investments that we expect to make and the competition for those investments ; our contractual arrangements and relationships with third parties ; actual and potential conflicts of interest with LS Adviser, our investment adviser, and other affiliates of the BDC ; the dependence of our future success on the general economy and its effect on the industries in which we invest ; the ability of our portfolio companies to achieve their objectives ; the use of borrowed money to finance a portion of our investments ; the adequacy of our financing sources and working capital ; and the timing of cash flows, if any, from the operations of our portfolio companies . Due to various risks and uncertainties, actual events or results or actual performance results may differ materially from those reflected or contemplated in such forward - looking statements . As a result, you should not place undue reliance on such forward - looking statements . Other factors that could cause actual results to differ materially including : changes in the economy ; risks associated with possible disruption in our operations or the economy generally due to terrorism or natural disasters ; changes in political, economic or industry conditions, the interest rate environment or conditions affecting the financial and capital markets, including future changes in laws or regulations and conditions in our operating areas ; the ability of LS Adviser to locate suitable investments for us and to monitor and administer our investments ; the ability of LS Adviser or its affiliates to attract and retain highly talented professionals ; our ability to qualify and maintain our qualification as a regulated investment company and as a business development company ; general price and volume fluctuations in the stock market ; the impact on our business of the Consumer Protection Act and the rules and regulations issued thereunder and any actions toward repeal thereof ; and the effect of changes to tax legislation and our tax position . Additional factors may be included from time to time in the filings of Lafayette Square with the Securities and Exchange Commission, including annual reports on Form 10 - K, quarterly reports on Form 10 - Q and current reports on Form 8 - K . Additionally, certain statements reflect estimates, predictions or opinions of Lafayette Square, which may change . There is no guarantee that these estimates, predictions or opinions will be realized . The information included in this presentation is based on information reasonably available to Lafayette Square as of the date hereof and does not purport to be complete . Lafayette Square does not undertake any duty to update the information set forth in this presentation, whether as a result of new information, future events or otherwise . Furthermore, the information included in this presentation has been obtained from sources that Lafayette Square believes to be reliable . However, these sources cannot be guaranteed as to their accuracy or completeness . No representation, warranty or undertaking, express or implied, is given as to the accuracy or completeness of the information contained herein by Lafayette Square, and no liability is accepted for the accuracy or completeness of any such information . In evaluation of prior performance information in this presentation, you should remember that past performance is not a guarantee, prediction, or projection of future results, and there can be no assurance that similar results will be achieve in the future . Lafayette Square seeks to improve the retention, well - being, and productivity of employees by connecting portfolio companies with third - party service providers that deliver workplace benefits and/or advisory support ("Third - Party Solution Providers") through Lafayette Square’s affiliated Worker Solutions, LLC (“Worker Solutions®”) platform . Lafayette Square’s enhanced managerial assistance platform provided through access to our affiliated Worker Solutions® platform .

Highlights 3
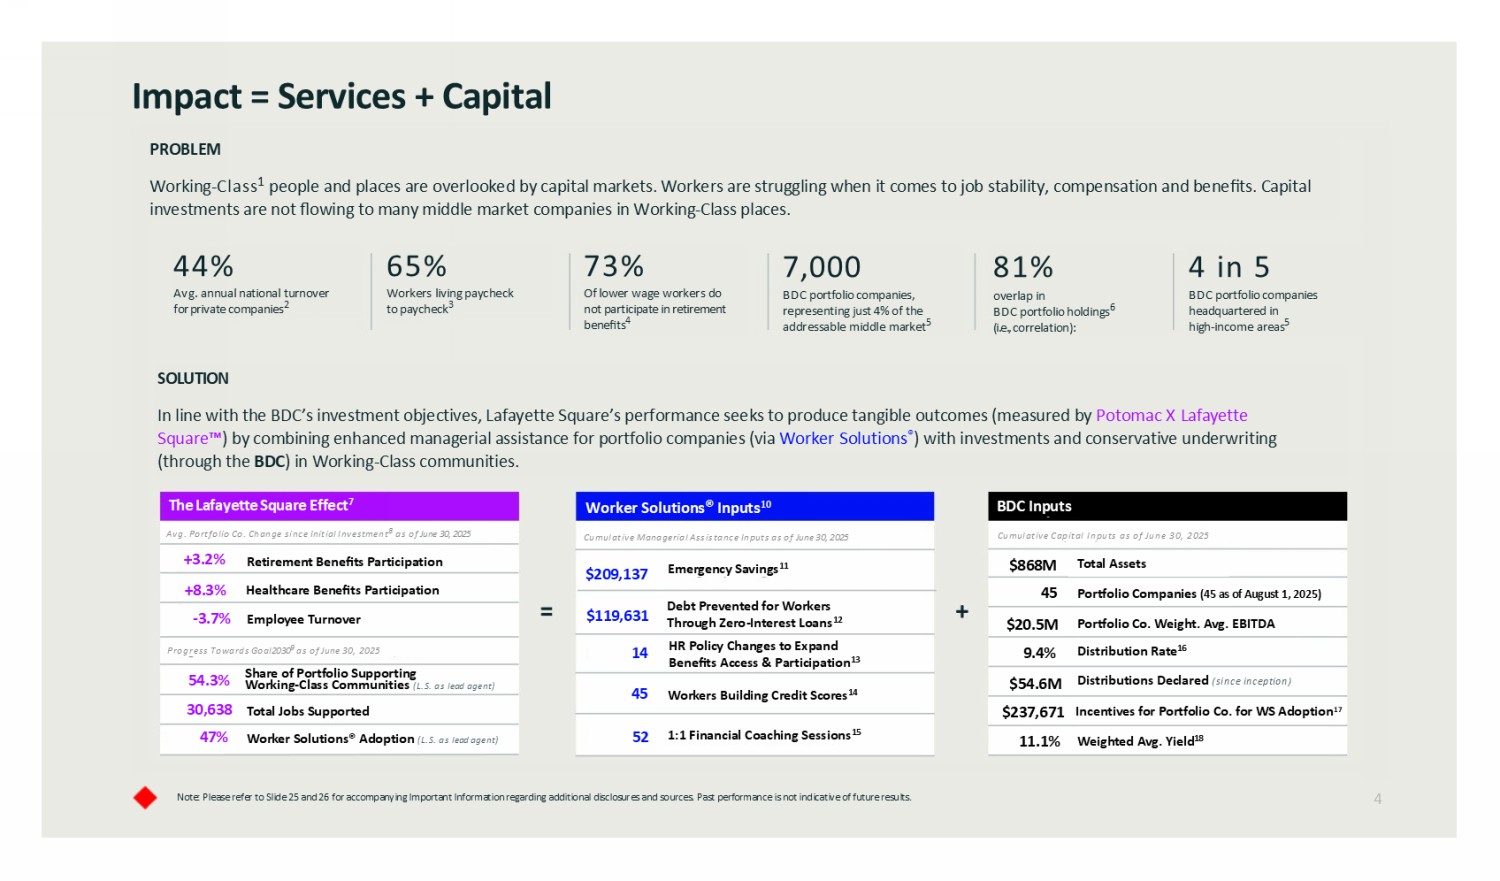
4 Impact = Services + Capital Note: Please refer to Slide 2 5 and 2 6 for accompanying I mportant I nformation regarding additional disclosures and sources. Past performance is not indicative of future results. Emergency Savings 11 Portfolio Co. Weight. Avg . EBITDA Distribution Rate 16 Distributions Declared (since inception) In centives for Portfolio Co. for WS Adoption 17 Weighted Avg. Yield 18 Debt Prevented for Workers Through Zero - Interest Loans 12 HR Policy Changes to Expand Benefits Access & Participation 13 Workers Building Credit Scores 14 1:1 Financial Coaching Sessions 15 Worker Solution s ® Adoption (L.S. as lead agent) Total Jobs Supported Employee Turnover Healthcare Benefits Participatio n Retirement Benefits Participation PROBLEM Working - Class 1 people and places are overlooked by capital markets. Workers are struggling when it comes to job stability, compensation and benefits . C apital investments are not flowing to many middle market companies in Working - Class places. SOLUTION In line with the BDC’s investment objectives, Lafayette Square’s performance seeks to produce tangible outcomes (measured by Potomac X Lafayette Square ) by combining enhanced managerial assistance for portfolio companies (via Worker Solutions ® ) with investments and conservative underwriting (through the BDC ) in Working - Class communities. 44% Avg . annual national turnover for private companies 2 65% Workers living paycheck to paycheck 3 73% Of lower wage workers do not participate in retirement benefits 4 7,000 BDC portfolio companies, representing just 4 % of the addressable middle market 5 81 % overlap in BDC portfolio holdings 6 (i.e., correlation): 4 in 5 BDC portfolio companies headquartered in high - income areas 5 +3.2% +8.3% - 3.7% 54.3% 30,638 47% Progress Towards Goal 2030 9 as of June 30 , 2025 Avg. Portfolio Co. Change since Initial Investment 8 as of June 30 , 2025 Cumulative Managerial Assistance Inputs as of June 30, 2025 Cumulative Capital Inputs as of June 30 , 2025 The Lafayette Square Effect 7 Worker Solution s ® Inputs 10 BDC Inputs $209,137 $119,631 14 45 52 $8 6 8M 45 Portfolio Companies ( 45 as of August 1, 2025) $ 20.5M 9. 4 % $ 54 . 6 M $237,671 11.1% Total Assets Share of Portfolio Supporting Working - Class Communities (L.S. as lead agent)
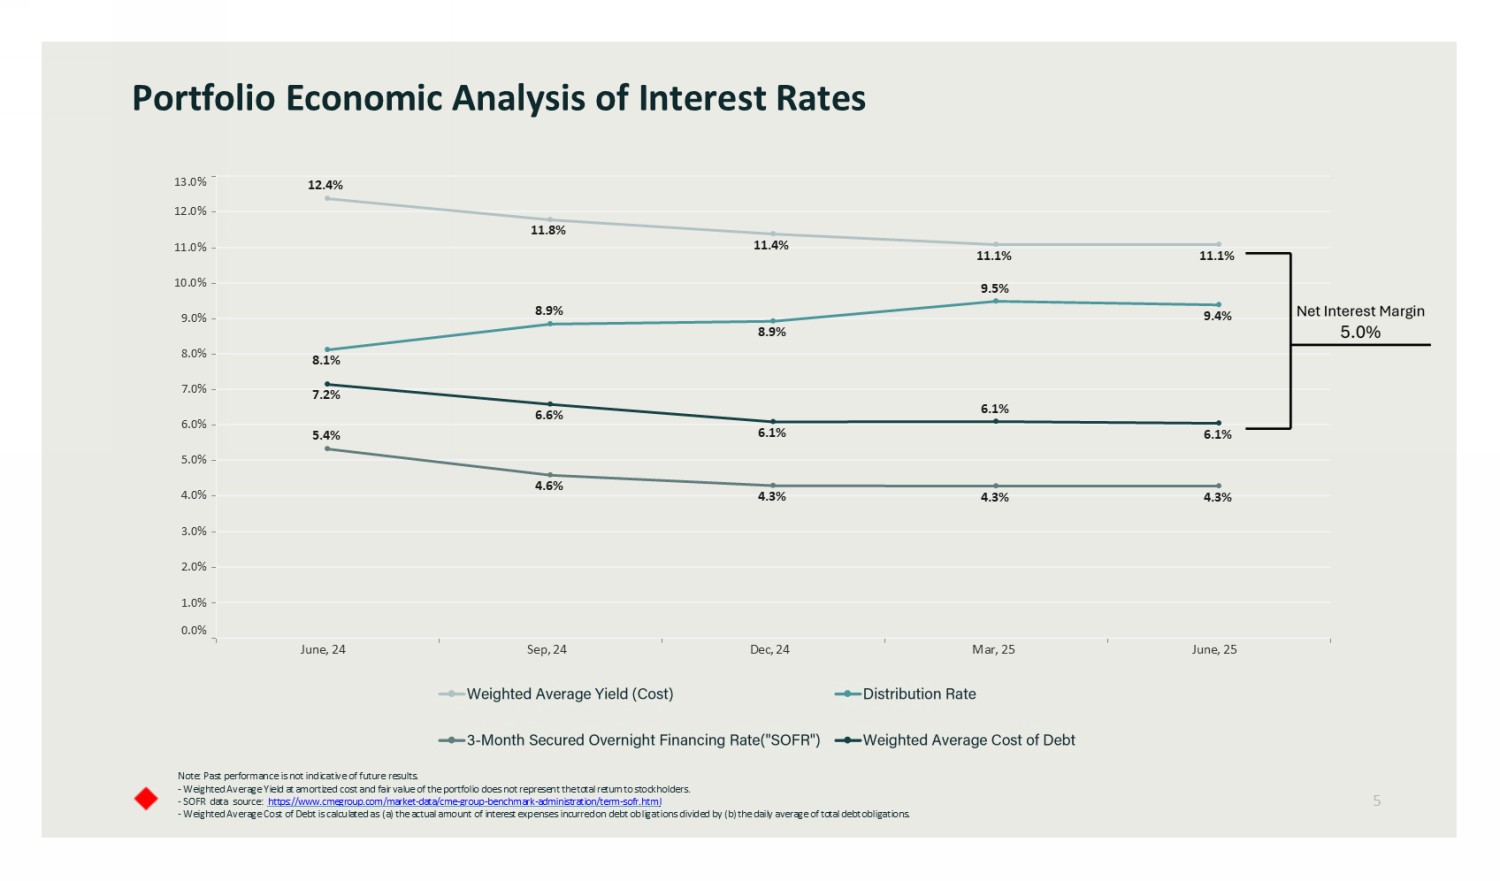
June, 24 Sep, 24 Dec, 24 Mar, 25 June, 25 3.0% 2.0% 1.0% 0.0% 4.0% 5.0% 6.0% 7.0% 8.0% 9.0% 10.0% 11.0% 12.0% 13.0% 8.9% 8.9% 4.6% 11.4% 5.4% 11.8% 12.4% 6.6% 8.1% 7.2% 4.3% 6.1% 4.3% 4.3% 6.1% 6.1% 9.4% 11.1% 11.1% 9.5% Note: Past performance is not indicative of future results. - Weighted Average Yield at amortized cost and fair value of the portfolio d oes not represent the total return to stockholders. - SOFR data source: https:// www.cmegroup.com/market - data/cme - group - benchmark - administration/term - sofr.htm l - Weighted Average Cost of Debt is calculated as (a) the actual amount of interest expenses incurred on debt obligations divided by (b) the daily average of total debt obligations. Portfolio Economic Analysis of Interest Rates 5
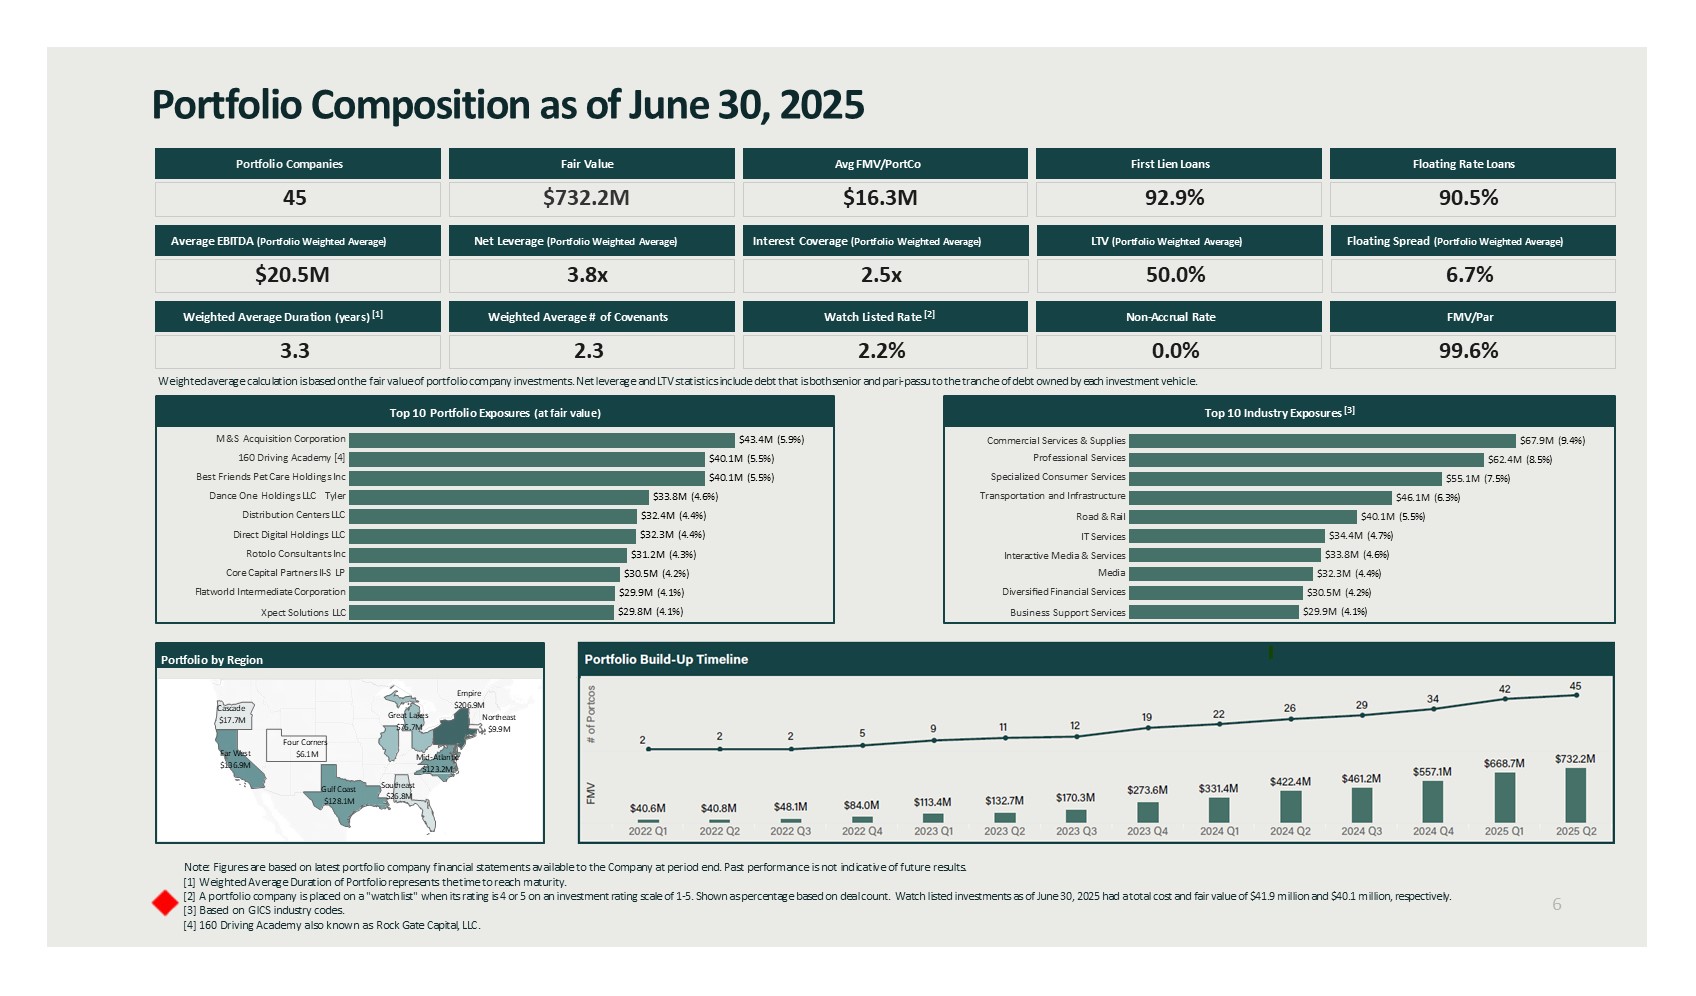
Note: Figures are based on latest portfolio company financial statements available to the Company at period end . Past performance is not indicative of future results. [1] Weighted Average Duration of Portfolio represents the time to reach maturity. [2] A portfolio company is placed on a "watchlist" when its rating is 4 or 5 on an investment rating scale of 1 - 5. Shown as percentage based on deal count. Watch listed investments as of June 30, 2025 had a total cost and fair value of $41.9 million and $40.1 million, respectively . [3] Based on GICS industry codes. [4] 160 Driving Academy also known as Rock Gate Capital, LLC. 6 Portfolio Composition as of June 30, 2025 45 Portfolio Companies $732.2M Fair Value $16.3M Avg FMV/PortCo 92.8% First Lien Loans 90.5% Floating Rate Loans $20.5M Average EBITDA (Portfolio Weighted Average) 3.8x Net Leverage (Portfolio Weighted Average) 2.5x Interest Coverage (Portfolio Weighted Average) 50.0% LTV (Portfolio Weighted Average) 6.7% Floating Spread (Portfolio Weighted Average) Weighted Average Duration (years) [1] Weighted Average # of Covenants Watch Listed Rate [2] Non - Accrual Rate FMV/Par M&S Acquisition Corporation 160 Driving Academy [4] Best Friends Pet Care Holdings Inc Dance One Holdings LLC Tyler Distribution Centers LLC Direct Digital Holdings LLC Rotolo Consultants Inc Core Capital Partners II - S LP Flatworld Intermediate Corporation Xpect Solutions LLC $29.8M (4.1%) $30.5M (4.2%) $29.9M (4.1%) $31.2M (4.3%) $32.4M (4.4%) $32.3M (4.4%) $33.8M (4.6%) $40.1M (5.5%) $40.1M (5.5%) $43.4M (5.9%) Top 10 Portfolio Exposures (at fair value) Commercial Services & Supplies Professional Services Specialized Consumer Services Transportation and Infrastructure Road & Rail IT Services Interactive Media & Services Media Diversified Financial Services Business Support Services $67.9M ( 9. 4 %) $62.4M ( 8.5%) $55.1M ( 7.5%) $46.1M ( 6.3%) $40.1M ( 5.5%) $34.4M ( 4.7%) $33.8M ( 4.6%) $32.3M ( 4.4%) $30.5M ( 4.2%) $29.9M ( 4.1%) Top 10 Industry Exposures [3] 3.3 2.3 2.2% 0.0% 99.6% Weighted average calculation is based on the fair value of portfolio company investments. Net leverage and LTV statistics include debt that is both senior and pari - passu to the tranche of debt owned by each investment vehicle. Northeast $9.9M Empire $206.9M Mid - Atlantic $123.2M Southeast $26.8M Gulf Coast $128.1M Great Lakes $76.7M Four Corners $6.1M Far West $136.9M Cascade $17.7M © Mapbox © OSM Portfolio by Region # of Portcos FMV Portfolio Build - Up Timeline 45 42 34 29 26 22 19 12 11 9 5 2 2 2 $732.2M $668.7M $557.1M $461.2M $422.4M $331.4M $273.6M $170.3M $132.7M $113.4M $84.0M $48.1M $40.8M $40.6M 2025 Q2 2025 Q1 2024 Q4 2024 Q3 2024 Q2 2024 Q1 2023 Q4 2023 Q3 2023 Q2 2023 Q1 2022 Q4 2022 Q3 2022 Q2 2022 Q1
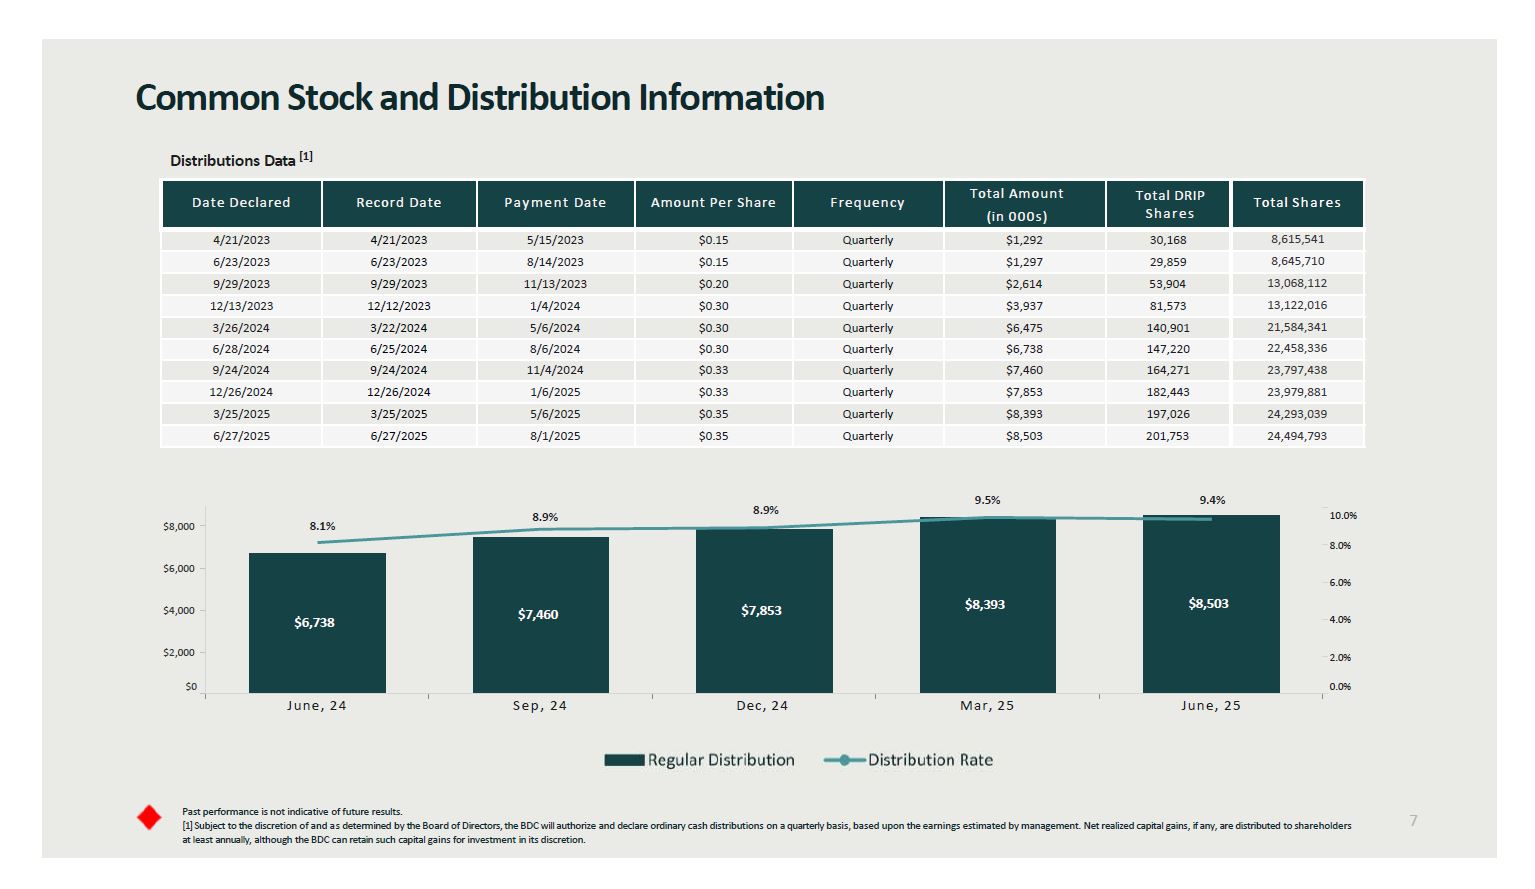
Date Declared RecordDate Payment Date Amount Per Share Frequency Total Amount (in 000s) TotalShares 4/21/2023 4/21/2023 5/15/2023 $0.15 Quarterly $1,292 30,168 8,615,541 6/23/2023 6/23/2023 8/14/2023 $0.15 Quarterly $1,297 29,859 8,645,710 9/29/2023 9/29/2023 11/13/2023 $0.20 Quarterly $2,614 53,904 13,068,112 12/13/2023 12/12/2023 1/4/2024 $0.30 Quarterly $3,937 81,573 13,122,016 3/26/2024 3/22/2024 5/6/2024 $0.30 Quarterly $6,475 140,901 21,584,341 6/28/2024 6/25/2024 8/6/2024 $0.30 Quarterly $6,738 147,220 22,458,336 9/24/2024 9/24/2024 11/4/2024 $0.33 Quarterly $7,460 164,271 23,797,438 12/26/2024 12/26/2024 1/6/2025 $0.33 Quarterly $7,853 182,443 23,979,881 3/25/2025 3/25/2025 5/6/2025 $0.35 Quarterly $8,393 197,026 24,293,039 6/27/2025 6/27/2025 8/1/2025 $0.35 Quarterly $8,503 201,753 24,494,793 Distributions Data [1] June, 24 Sep, 24 Dec, 24 Mar, 25 June, 25 $0 $2,000 $4,000 $6,000 $8,000 0.0% 2.0% 4.0% 6.0% 8.0% 10.0% $6,738 $7,460 $7,853 $8,393 $8,503 Past performance is not indicative of future results. [1] Subject to the discretion of and as determined by the Board of Directors, the BDC will authorize and declare ordinary cash distributions on a quarterly basis, based upon the earnings estimated by management. Net realized capital gains, if any, are distributed to shareholders at least annually, although the BDC can retain such capital gains for investment in its discretion. Common Stock and Distribution Information 7 8.1% 8.9% 8.9% 9.5% 9.4% TotalDRIPShares
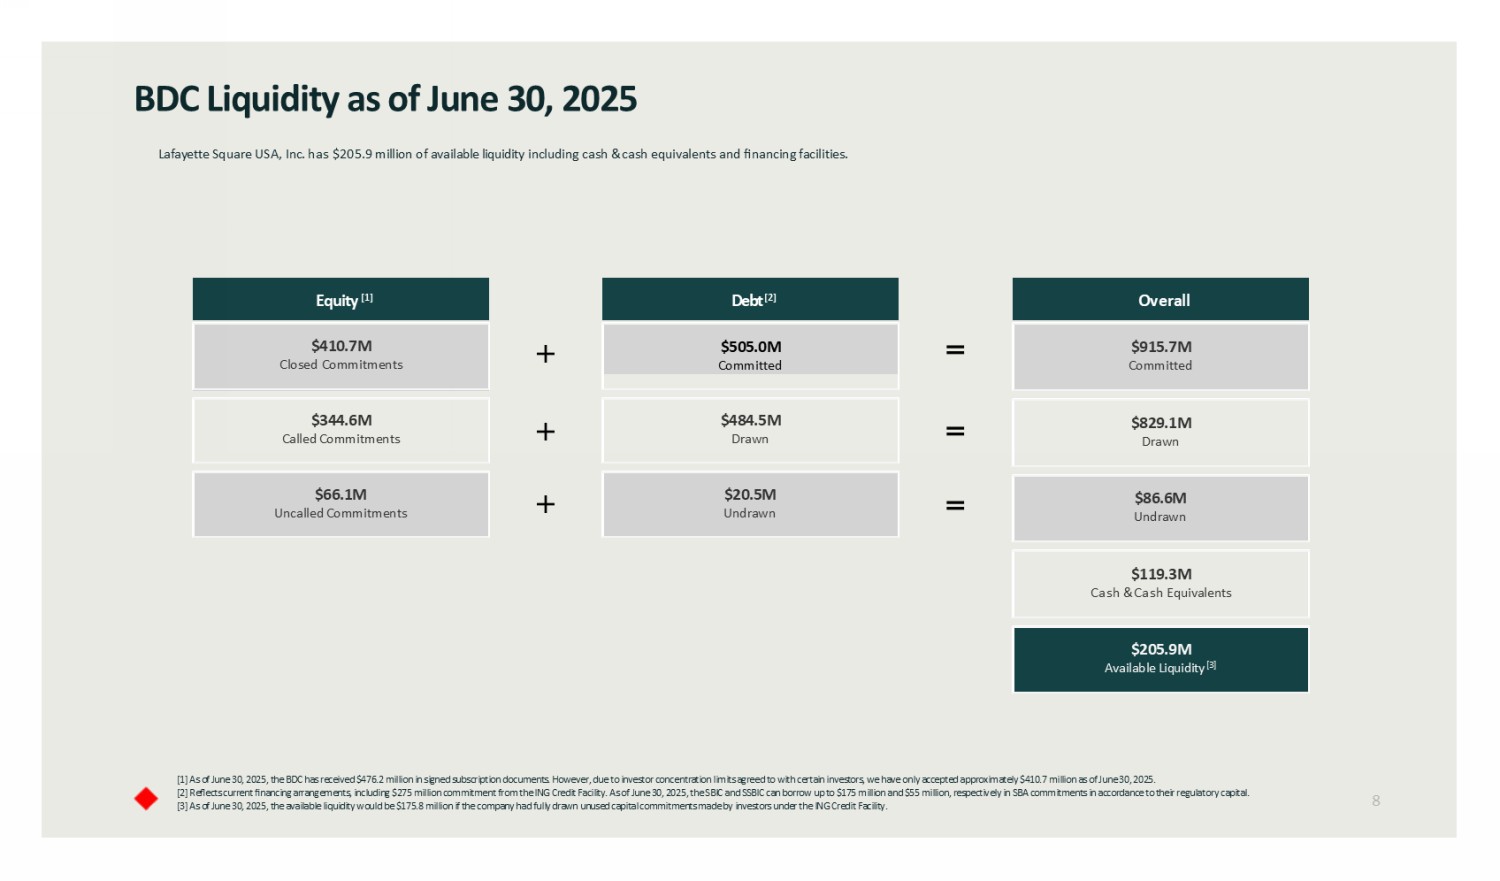
BDC Liquidity as of June 30, 2025 [1] As of June 30, 2025, the BDC has received $476.2 million in signed subscription documents. However, due to investor conce ntr ation limits agreed to with certain investors, we have only accepted approximately $410.7 million as of June 30, 2025. [2] Reflects current financing arrangements, including $275 million commitment from the ING Credit Facility. As of June 30, 202 5, the SBIC and SSBIC can borrow up to $175 million and $55 million, respectively in SBA commitments in accordance to their regu lat ory capital. [3] As of June 30, 2025, the available liquidity would be $175.8 million if the company had fully drawn unused capital commit men ts made by investors under the ING Credit Facility. 8 $410.7M Closed Commitments Equity [1] $344.6M Called Commitments $66.1M Uncalled Commitments Lafayette Square USA, Inc. has $205.9 million of available liquidity including cash & cash equivalents and financing facilities. $505.0M Committed Debt [2] $484.5M Drawn $20.5M Undrawn $915.7M Committed Overall $829.1M Drawn $86.6M Undrawn $119.3M Cash & Cash Equivalents $205.9M Available Liquidity [3]
9 Enhanced Managerial Assistance Results
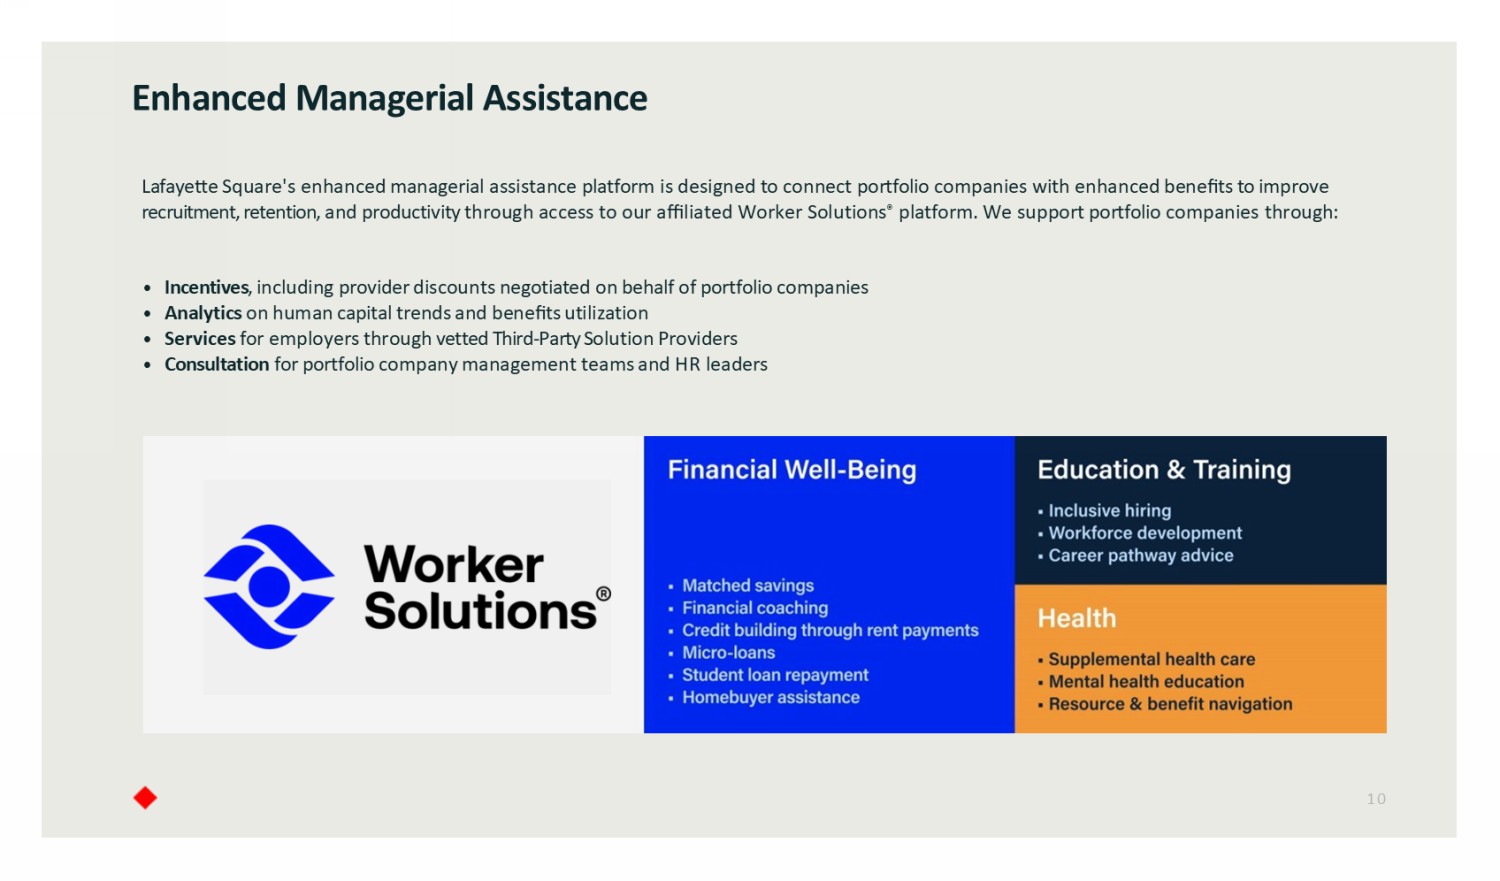
Enhanced Managerial Assistance Lafayette Square's enhanced managerial assistance platform is designed to connect portfolio companies with enhanced benefits to improve recruitment, retention, and productivity through access to our affiliated Worker Solutions ® platform. We support portfolio companies through: • Incentives , including provider discounts negotiated on behalf of portfolio companies • Analytics on human capital trends and benefits utilization • Services for employers through vetted T hird - P arty S olution P roviders • Consultation for portfolio company management teams and HR leaders 10
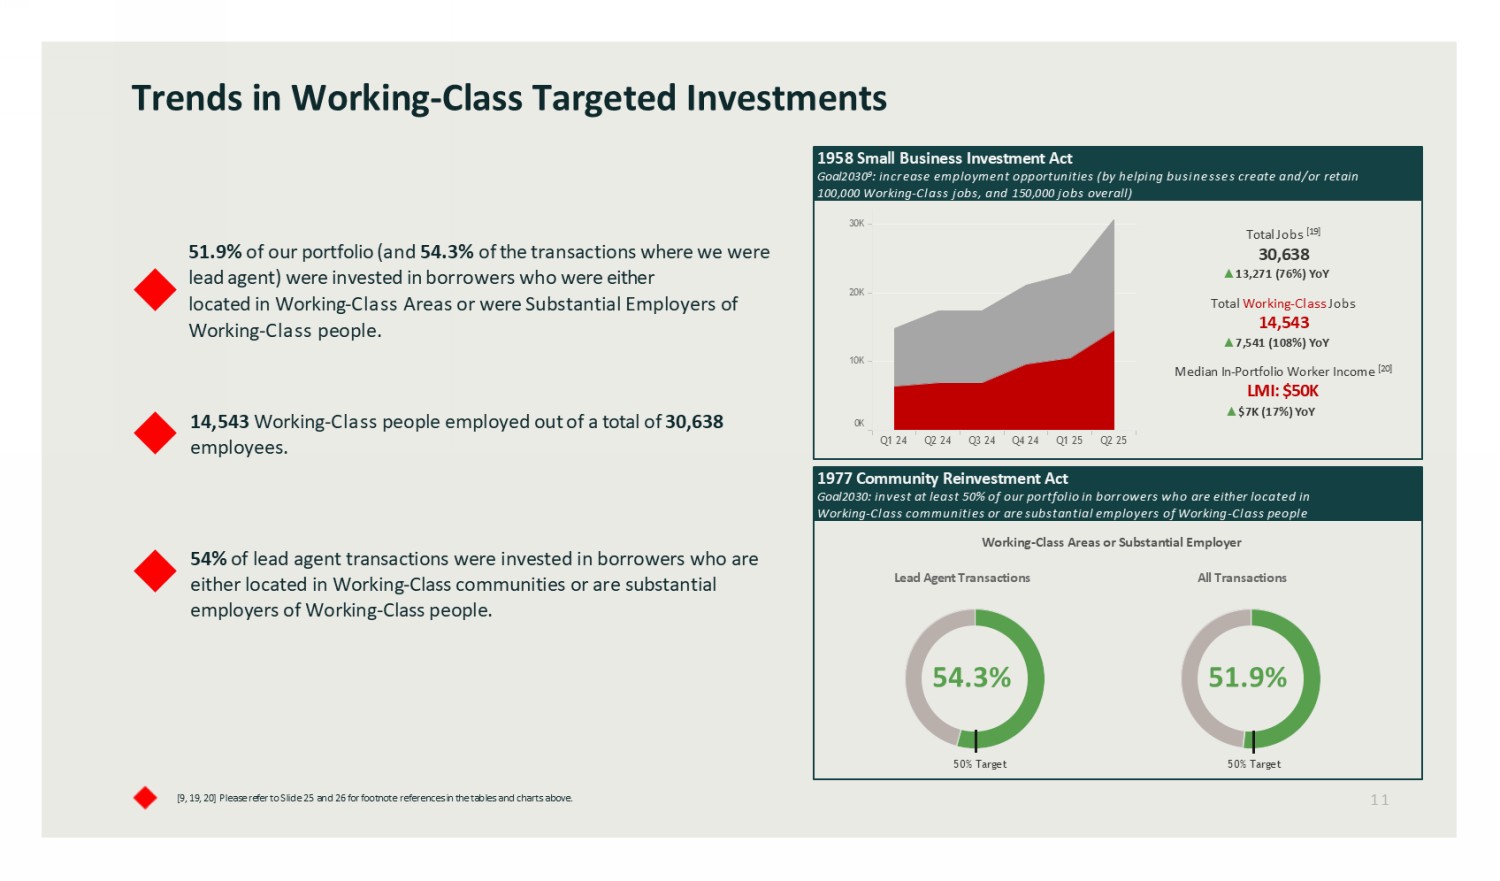
Trends in Working - Class Targeted Investments [ 9, 19 , 20] Please refer to Slide 2 5 and 26 for footnote references in the tables and charts above. 1958 Small Business Investment Act Goal 2030 9 : increase employment opportunities (by helping businesses create and/or retain 100,000 Working - Class jobs, and 150,000 jobs overall) Total Jobs [19] 30,638 Ÿ 13,271 ( 76 %) YoY Total Working - Class Jobs 14,543 Ÿ 7,541 ( 108 %) YoY Median In - Portfolio Worker Income [20] LMI: $ 50K Ÿ $7K ( 17 %) YoY 1977 Community Reinvestment Act Goal2030 : invest at least 50% of our portfolio in borrowers who are either located in Working - Class communities or are substantial employers of Working - Class people Working - Class Areas or Substantial Employer Lead Agent Transactions All Transactions 51.9% of our portfolio (and 54.3 % of the transactions where we were lead agent) were invested in borrowers who were either located in Working - Class Areas or were Substantial Employers of Working - Class people. 14,543 Working - Class people employed out of a total of 30,638 employees. 54% of lead agent transactions were invested in borrowers who are either located in Working - Class communities or are substantial employers of Working - Class people. 11 Q1 24 Q2 24 Q3 24 Q4 24 Q1 25 Q2 25 0K 10K 20K 30K 54.3% 51.9% 50% Target 50% Target
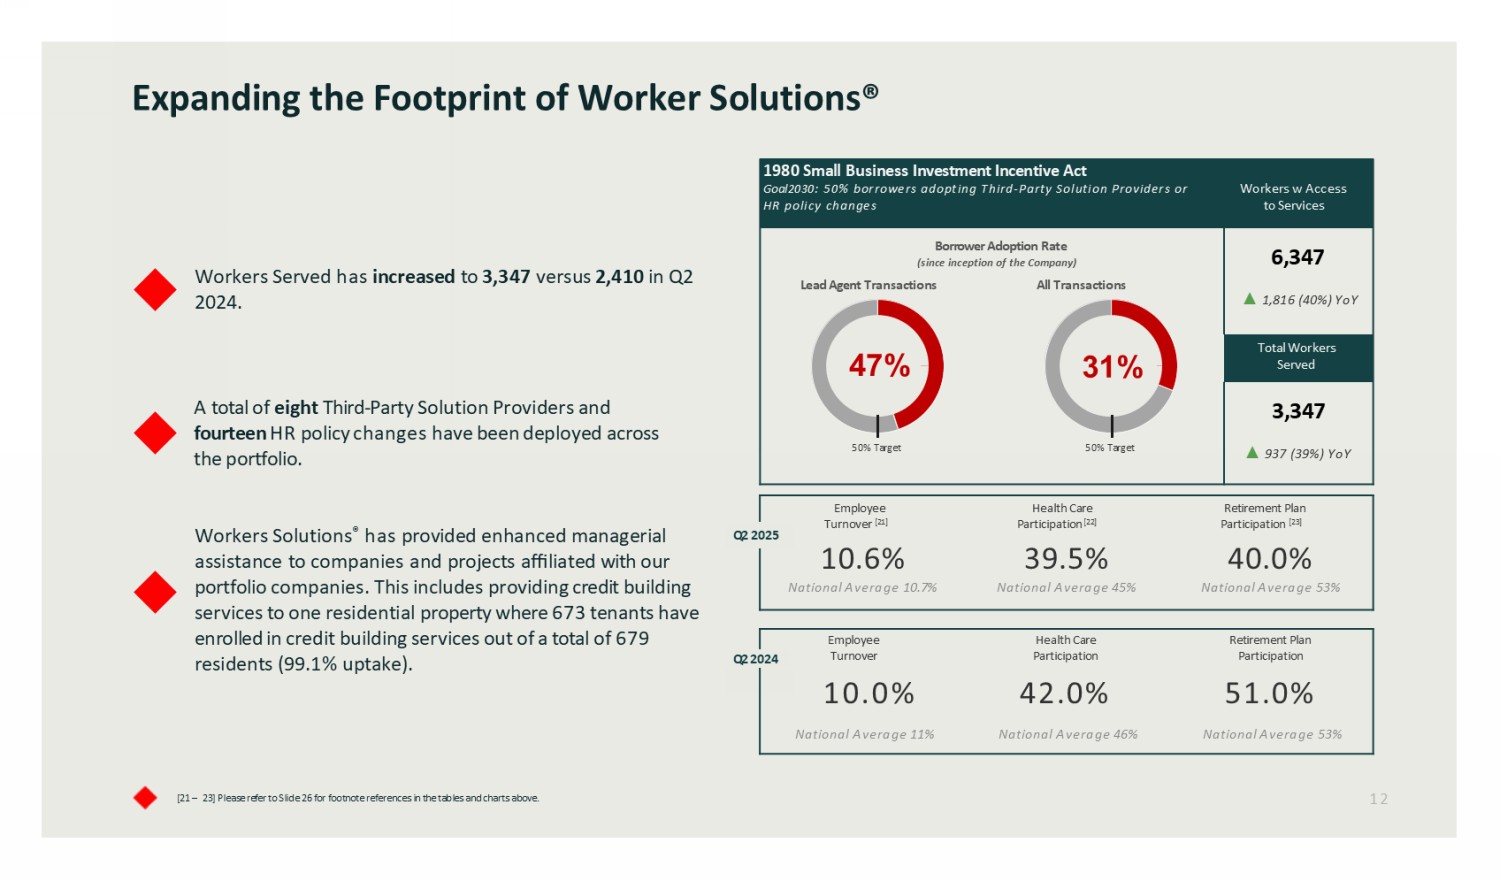
Expanding the Footprint of Worker Solution s ® [21 – 23] Please refer to Slide 2 6 for footnote references in the tables and charts above. Retirement Plan Participation [23] Health Care Participation [22] Employee Turnover [21] 40.0% 39.5% 10.6% National Average 53% National Average 45% National Average 10.7% Q 2 2025 Retirement Plan Participation 51.0% Health Care Participation 42.0% Employee Turnover 10.0% National Average 53% National Average 46% National Average 11% Workers Served has increased to 3,347 versus 2,410 in Q2 2024. A total of eight Third - Party Solution Providers and fourteen HR policy changes have been deployed across the portfolio . Workers Solutions ® has provided enhanced managerial assistance to companies and projects affiliated with our portfolio companies. This includes providing credit building services to one residential property where 673 tenants have enrolled in credit building services out of a total of 679 residents ( 99.1 % uptake). 1 2 Workers w Access to Services 1980 Small Business Investment Incentive Act Goal2030 : 50% borrowers adopting Third - Party Solution Providers or HR policy changes 6,347 Ÿ 1,816 (40%) YoY Total Workers Served 3,347 Ÿ 937 (39%) YoY Borrower Adoption Rate (since inception of the Company) Lead Agent Transactions All Transactions Q2 2024 47% 31% 50% Target 50% Target
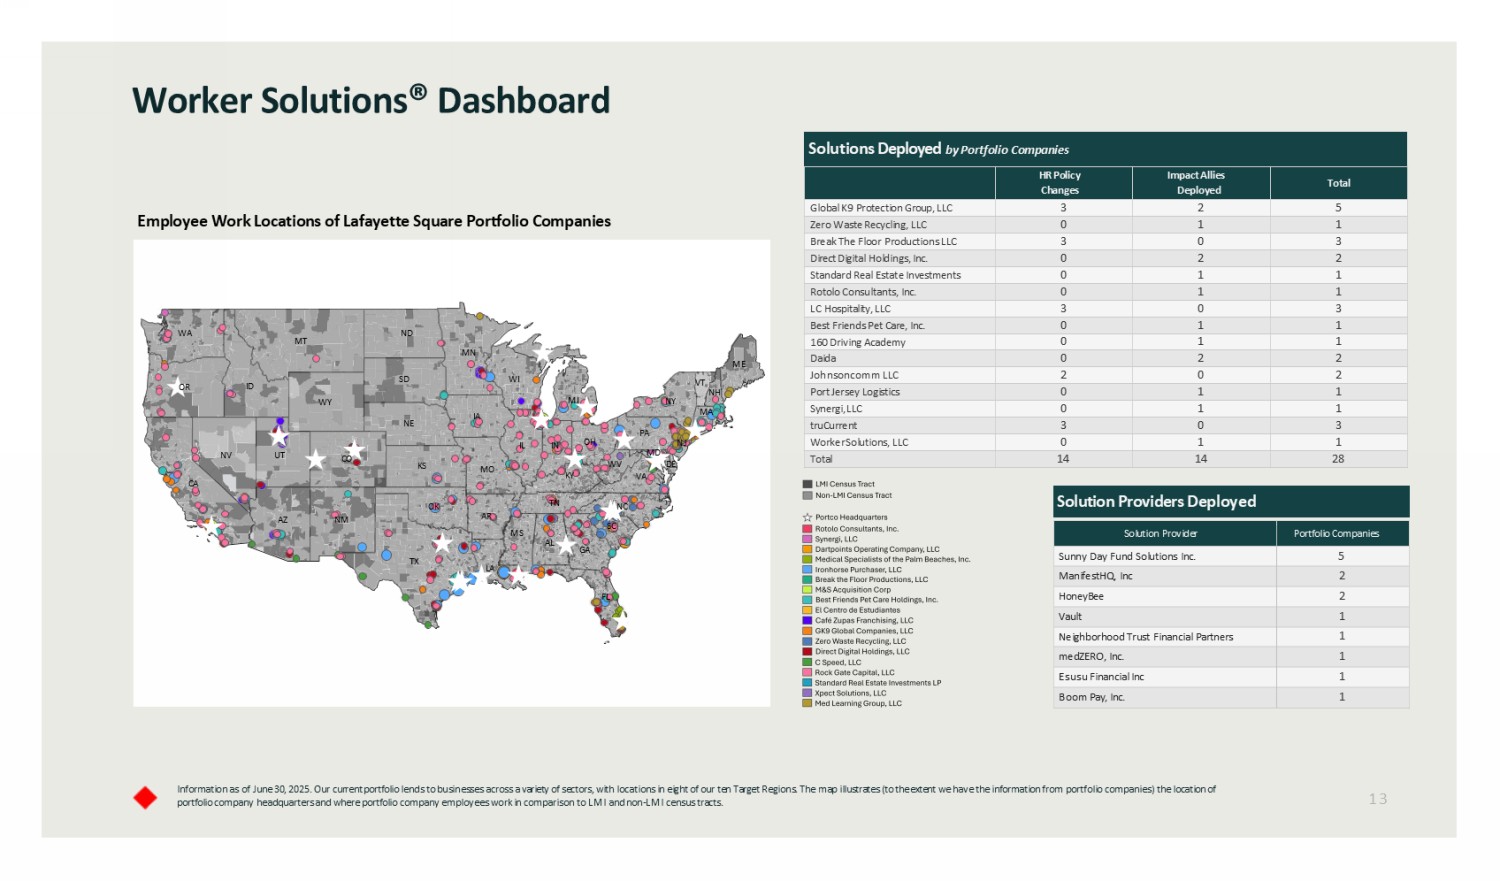
Information as of June 30, 2025. Our current portfolio lends to businesses across a variety of sectors, with locations in eight of our ten Target Regions. The map illustrates (to the extent we have the information from portfolio companies) the location of portfolio company headquarters and where portfolio company employees work in comparison to LMI and non - LMI census tracts. Worker Solution s ® Dashboard 13 NM MN WA WV MO MD WY MT ME MS OR OH ND AR NV GA UT NE NC OK VT NH NY MA VA CO TN WI DE SD PA CA MI AZ KY NJ KS TX SC LA AL IN FL ID IA IL Employee Work Locations of Lafayette Square Portfolio Companies Solutions Deployed by Portfolio Companies Total Impact Allies Deployed HR Policy Changes 5 2 3 Global K9 Protection Group, LLC 1 1 0 Zero Waste Recycling, LLC 3 0 3 Break The Floor Productions LLC 2 2 0 Direct Digital Holdings, Inc. 1 1 0 Standard Real Estate Investments 1 1 0 Rotolo Consultants, Inc. 3 0 3 LC Hospitality, LLC 1 1 0 Best Friends Pet Care, Inc. 1 1 0 160 Driving Academy 2 2 0 Daida 2 0 2 Johnsoncomm LLC 1 1 0 Port Jersey Logistics 1 1 0 Synergi, LLC 3 0 3 truCurrent 1 1 0 Worker Solutions, LLC 28 14 14 Total Solution Providers Deployed Solution Provider Portfolio Companies Sunny Day Fund Solutions Inc. 5 2 ManifestHQ, Inc 2 HoneyBee 1 Vault 1 Neighborhood Trust Financial Partners 1 medZERO, Inc. 1 Esusu Financial Inc 1 Boom Pay, Inc.
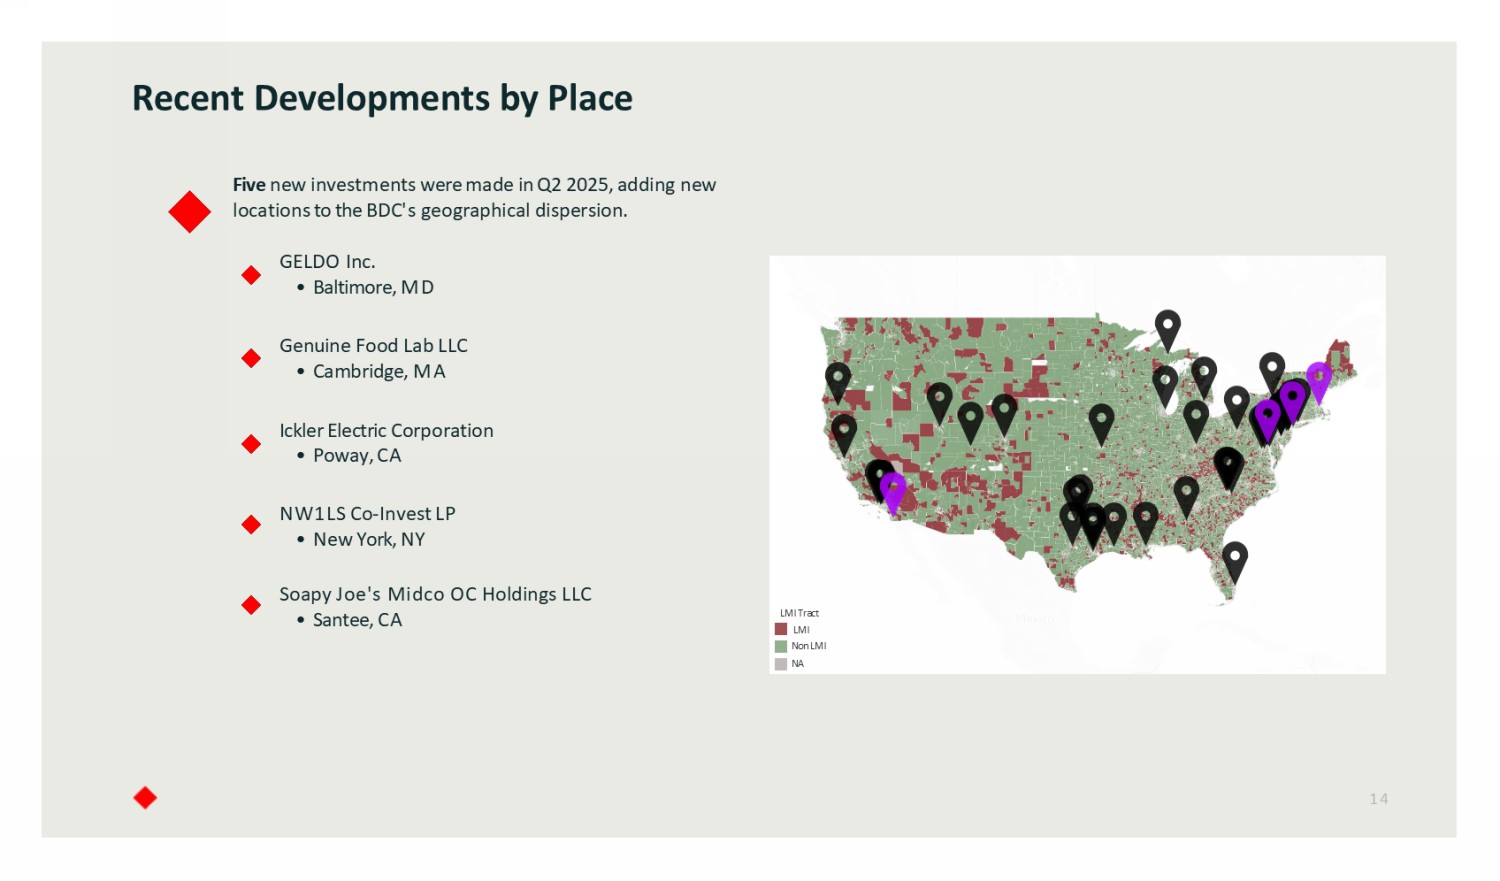
Recent Developments by Place 14 © 2025 Mapbox © OpenStreetMap LMI Tract LMI Non LMI NA Soapy Joe's Midco OC Holdings LLC • Santee, CA Five new investments were made in Q2 2025, adding new locations to the BDC 's geographical dispersion. GELDO Inc. • Baltimore, MD Genuine Food Lab LLC • Cambridge, MA Ickler Electric Corporation • Poway, CA NW1LS Co - Invest LP • New York, NY
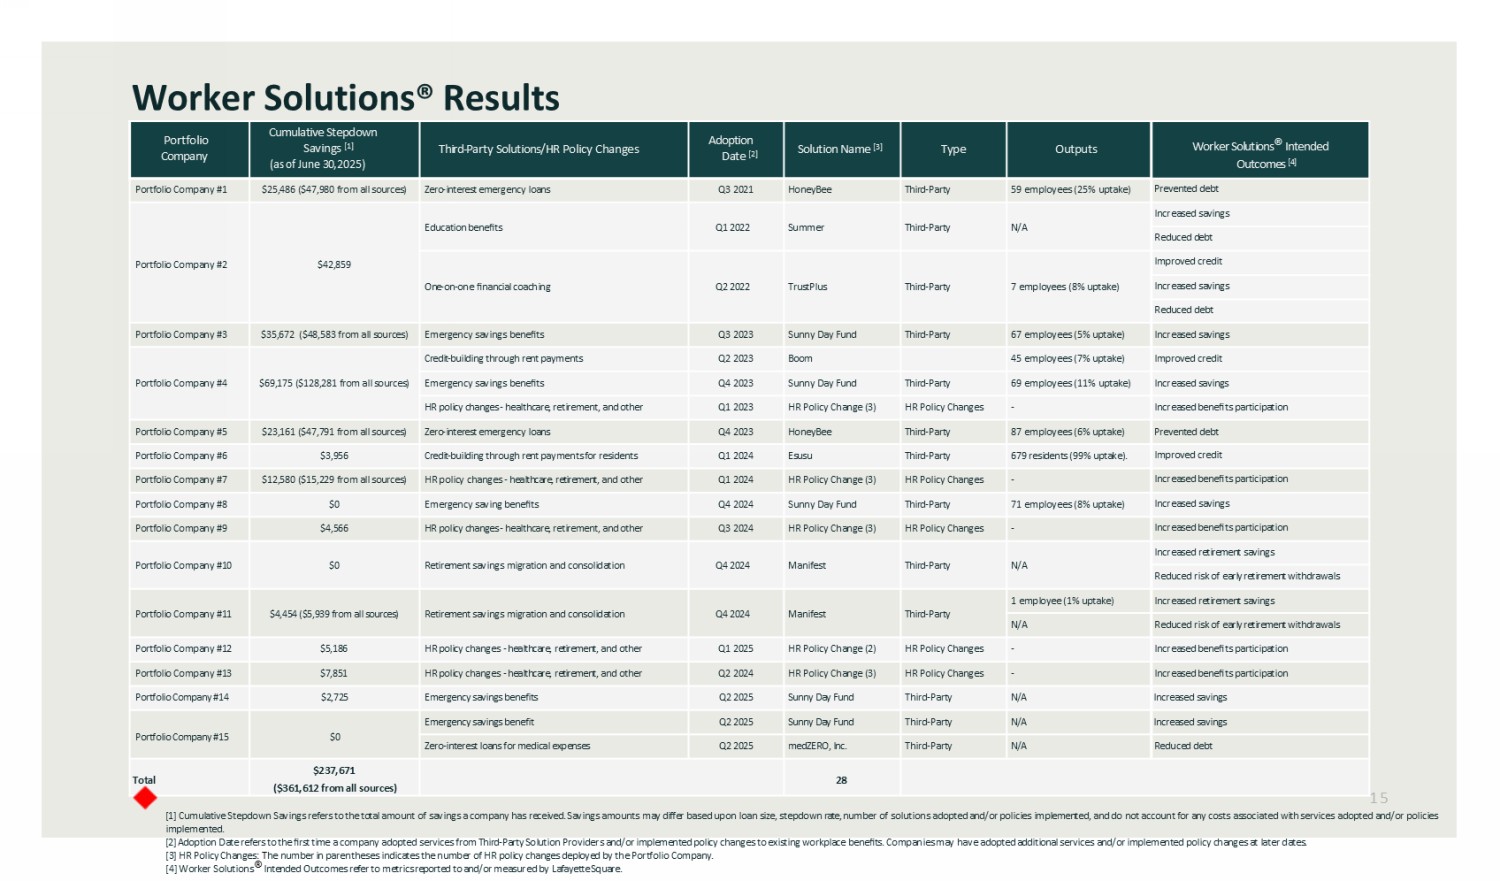
[1] Cumulative Stepdown Savings refers to the total amount of savings a company has received. Savings amounts may differ based upon loan size, stepdown rate, number of solutions adopted and/or policies implemented, and do not account for any costs associated with services adopted and/or policies implemented . [2] A doption D ate refers to the first time a company adopted services from Third - Party Solution Providers and/or implemented policy changes to existing workplace benefits. Companies may have adopted additional services and/or implemented policy changes at later dates. [3] HR Policy Changes: T he number in parentheses indicates the number of HR policy changes d eployed by the Portfolio Company. [4] Worker Solutions ® Intended Outcomes refer to metrics reported to and/or measured by Lafayette Square. Worker Solution s ® Results 15 Worker Solutions ® Intended Outcomes [4] Outputs Type Solution Name [3] Adoption Date [2] Third - Party Solutions/HR Policy Changes Cumulative Stepdown Savings [1] (as of June 30, 2025) Portfolio Company Prevented debt 59 employees (25% uptake) Third - Party HoneyBee Q3 2021 Zero - interest emergency loans $25,486 ($47,980 from all sources) Portfolio Company #1 Increased savings N/A Third - Party Summer Q1 2022 Education benefits $42,859 Portfolio Company #2 Reduced d ebt Improved credit 7 employees (8% uptake) Third - Party TrustPlus Q2 2022 One - on - one financial coaching Increased savings Reduced debt Increased savings 67 employees (5% uptake) Third - Party Sunny Day Fund Q3 2023 Emergency savings benefits $35,672 ($48,583 from all sources) Portfolio Company #3 Improved credit 45 employees (7% uptake) Boom Q2 2023 Credit - building through rent payments $69,175 ($128,281 from all sources) Portfolio Company #4 Increased s avings 69 employees (11% uptake) Third - Party Sunny Day Fund Q4 2023 Emergency savings benefits Increased b enefits p articipation - HR Policy Changes HR Policy Change (3) Q1 2023 HR policy changes - healthcare, retirement, and other Prevented debt 87 employees (6% uptake) Third - Party HoneyBee Q4 2023 Zero - interest emergency loans $23,161 ($47,791 from all sources) Portfolio Company #5 Improved credit 679 residents (99% uptake). Third - Party Esusu Q1 2024 Credit - building through rent payments for residents $3,956 Portfolio Company #6 Increased b enefits p articipation - HR Policy Changes HR Policy Change (3) Q1 2024 HR p olicy c hanges - healthcare, retirement, and other $12,580 ($15,229 from all sources) Portfolio Company #7 Increased savings 71 employees (8% uptake) Third - Party Sunny Day Fund Q4 2024 Emergency saving benefits $0 Portfolio Company #8 Increased b enefits p articipation - HR Policy Changes HR Policy Change (3) Q3 2024 HR policy changes - healthcare, retirement, and other $4,566 Portfolio Company #9 Increased retirement savings N/A Third - Party Manifest Q4 2024 Retirement savings migration and consolidation $0 Portfolio Company #10 Reduced risk of early retirement withdrawals Increased retirement savings 1 employee (1% uptake) Third - Party Manifest Q4 2024 Retirement savings migration and consolidation $4,454 ($5,939 from all sources) Portfolio Company #11 Reduced risk of early retirement withdrawals N/A Increased b enefits p articipation - HR Policy Changes HR Policy Change (2) Q1 2025 HR policy changes - healthcare, retirement, and other $5,186 Portfolio Company #12 Increased b enefits p articipation - HR Policy Changes HR Policy Change (3) Q2 2024 HR policy changes - healthcare, retirement, and other $7,851 Portfolio Company #13 Increased savings N/A Third - Party Sunny Day Fund Q2 2025 Emergency savings benefits $2,725 Portfolio Company #14 Increased savings N/A Third - Party Sunny Day Fund Q2 2025 Emergency savings benefit $0 Portfolio Company #15 Reduced debt N/A Third - Party medZERO, Inc. Q2 2025 Zero - interest loans for medical expenses 28 $237,671 ($361,612 from all sources) Total
Worker Solutions ® : Third - Party Liquidity Solution Providers Engagement Snapshot [1] Lafayette Square currently does not receive any compensation for the recommendation to use Third - Party Solution Providers . However, we may offer portfolio companies a small stepdown on financing costs if they engage a Third - Party Solution Provider and/or adopt certain other designations (such as B - Corporation status) or human capital advice, and in some cases, will negotiate discounts for them on the services provided by Third - Party Solution Providers . [ 1 ] Data as of June 30 , 2025 , provided by Third - Party Solution Providers and not part of the data Lafayette Square receives directly from its portfolio companies . This data reflects cumulative, all - time results from Third - Party Solution Providers for Lafayette Square portfolio companies through March 31 , 2025 . [ 2 ] Savings relative to high - cost lending products calculated by using the average payday loan APR (~ 400 % ), average portfolio company worker loan amount of $ 215 , and an assumed 5 - mouth repayment period (the average time it takes to repay payday loans . ) Cumulative savings through Third - Party Solution Provider Sunny Day Fund for 195 workers across three portfolio companies . https : //www . incharge . org/debt - relief/how - payday - loans - work/ 16 Emergency Savings: $209,137 in emergency savings for portfolio company workers to address unexpected expenses and protect their retirement savings as of June 30 , 2025. - $549 is the average savings balance per employee - $95 is the average contribution to emergency savings per paycheck among employees Zero Interest Loans: $67,588 in zero - interest loans to portfolio company workers to manage their cash flow and avoid taking on high - interest debt as of June 30, 2025. - $215 is the average loan amount. - Estimated $119,631 in debt prevented by providing workers with an alternative to high - cost lending products. [2] The top three purposes cited by portfolio company workers for using no - cost assistance were: - Emergency cash - Car r epairs - Other expenses

17 Financial Results
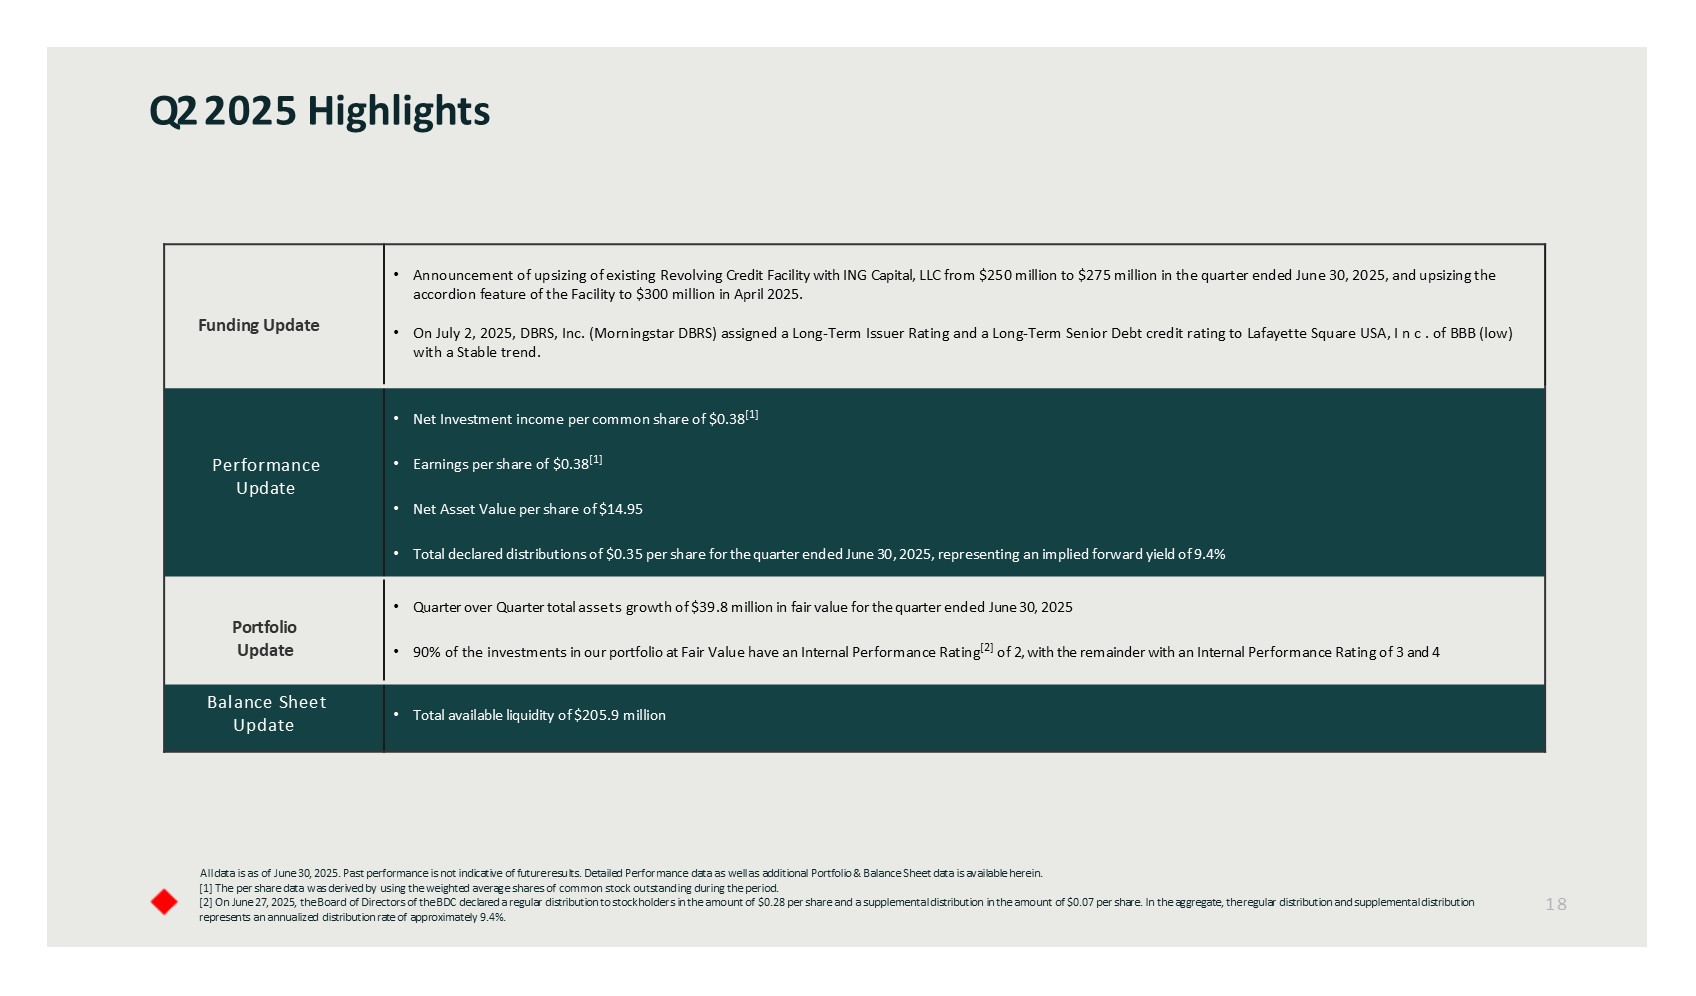
All data is as of June 30 , 2025. Past performance is not indicative of future results. Detailed Performance data as well as additional Portfolio & Balance Sheet data is available herein. [1] The per share data was derived by using the weighted average shares of common stock outstanding during the period. [2] On June 27, 2025, the Board of Directors of the BDC declared a regular distribution to stockholders in the amount of $0.28 per share and a supplemental distribution in the amount of $0.07 per share. In the aggregate, the regular distribution and supplemental distribution represents an annualized distribution rate of approximately 9.4%. Q 2 2025 Highlights 18 Funding Update Portfolio Update • Announcement of upsizing of existing Revolving Credit Facility with ING Capital, LLC from $250 million to $275 million in the quarter ended June 30, 2025, and upsizing the accordion feature of the Facility to $300 million in April 2025. • On July 2, 2025, DBRS, Inc. (Morningstar DBRS) assigned a Long - Term Issuer Rating and a Long - Term Senior Debt credit rating to L afayette Square USA, Inc. of BBB (low) with a Stable trend. Funding Update • Net Investment income per common share of $0.38 [1] • Earnings per share of $0.38 [1] • Net Asset Value per share of $14.95 • Total declared distributions of $0.35 per share for the quarter ended June 30 , 2025, representing an implied forward yield of 9.4% Performance Update • Quarter over Quarter total assets growth of $39.8 million in fair value for the quarter ended June 30, 2025 • 90% of the investments in our portfolio at Fair Value have an Internal Performance Rating [2] of 2, with the remainder with an Internal Performance Rating of 3 and 4 Portfolio Update • Total available liquidity of $205.9 million Balance Sheet Update
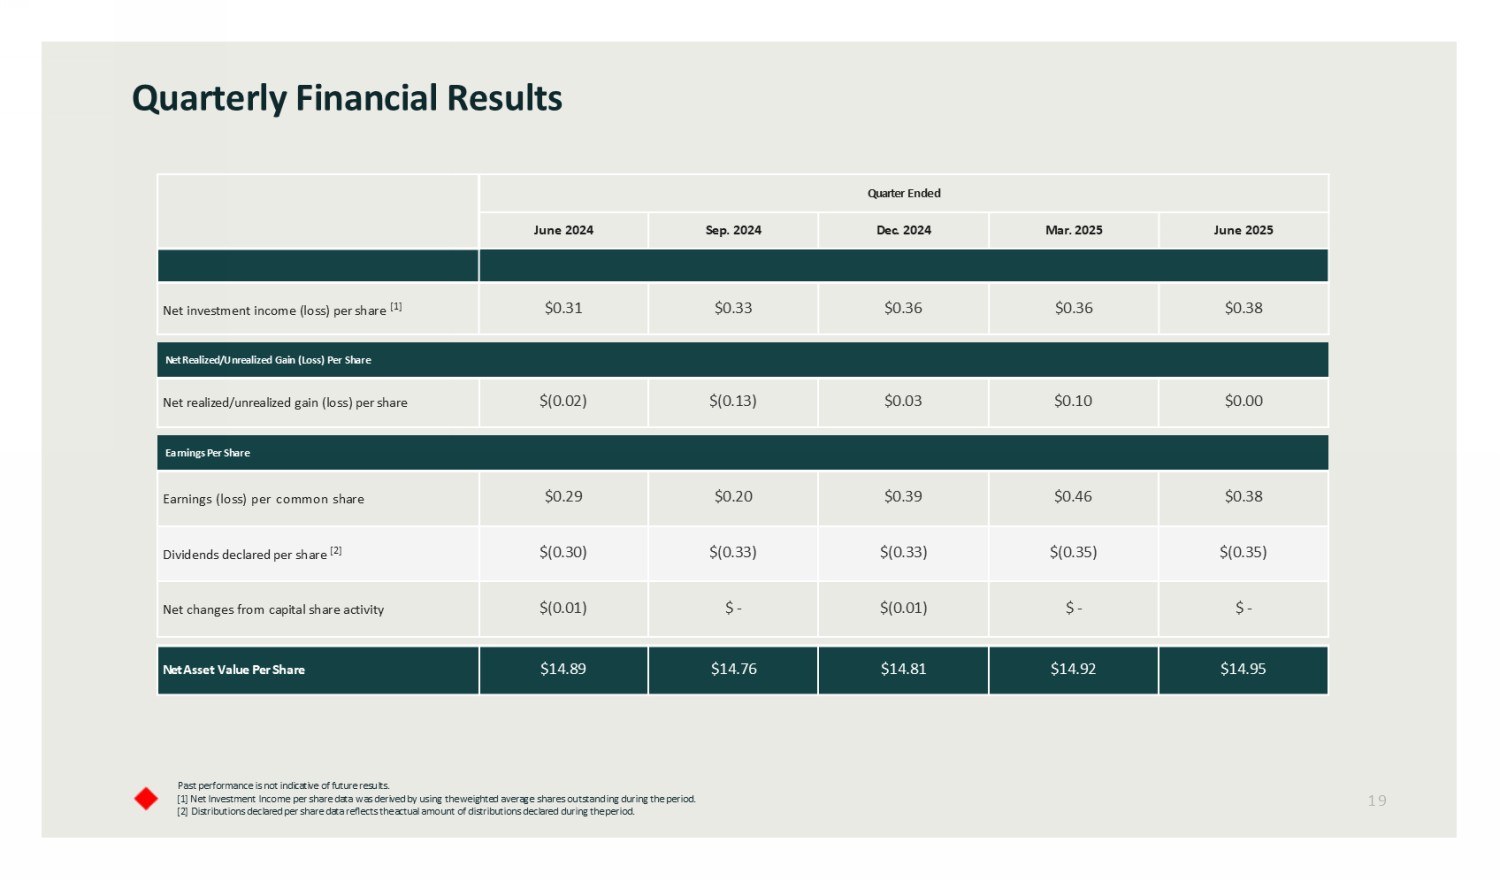
Quarter Ended June 2025 Mar. 2025 Dec. 2024 Sep. 2024 June 2024 $0.38 $0.36 $0.36 $0.33 $0.31 Net investment income ( l oss) per share [1] Net Realized/Unrealized Gain (Loss) Per Share $0.00 $0.10 $0.03 $(0.13) $(0.02) Net realized/unrealized gain (loss) per share Earnings Per Share $0.38 $0.46 $0.39 $0.20 $0.29 Earnings ( l oss) p er c ommon s hare $(0.35) $(0.35) $(0.33) $(0.33) $(0.30) Dividends declared per share [2] $ - $ - $(0.01) $ - $(0.01) Net c hanges from capital share activity $14.95 $14.92 $14.81 $14.76 $14.89 Net Asset Value Per Share Past performance is not indicative of future results. [1] N et Investment Income per share data was derived by using the weighted average shares outstanding during the period. [2] Distributions declared per share data reflects the actual amount of distributions declared during the period. Quarterly Financial Results 19
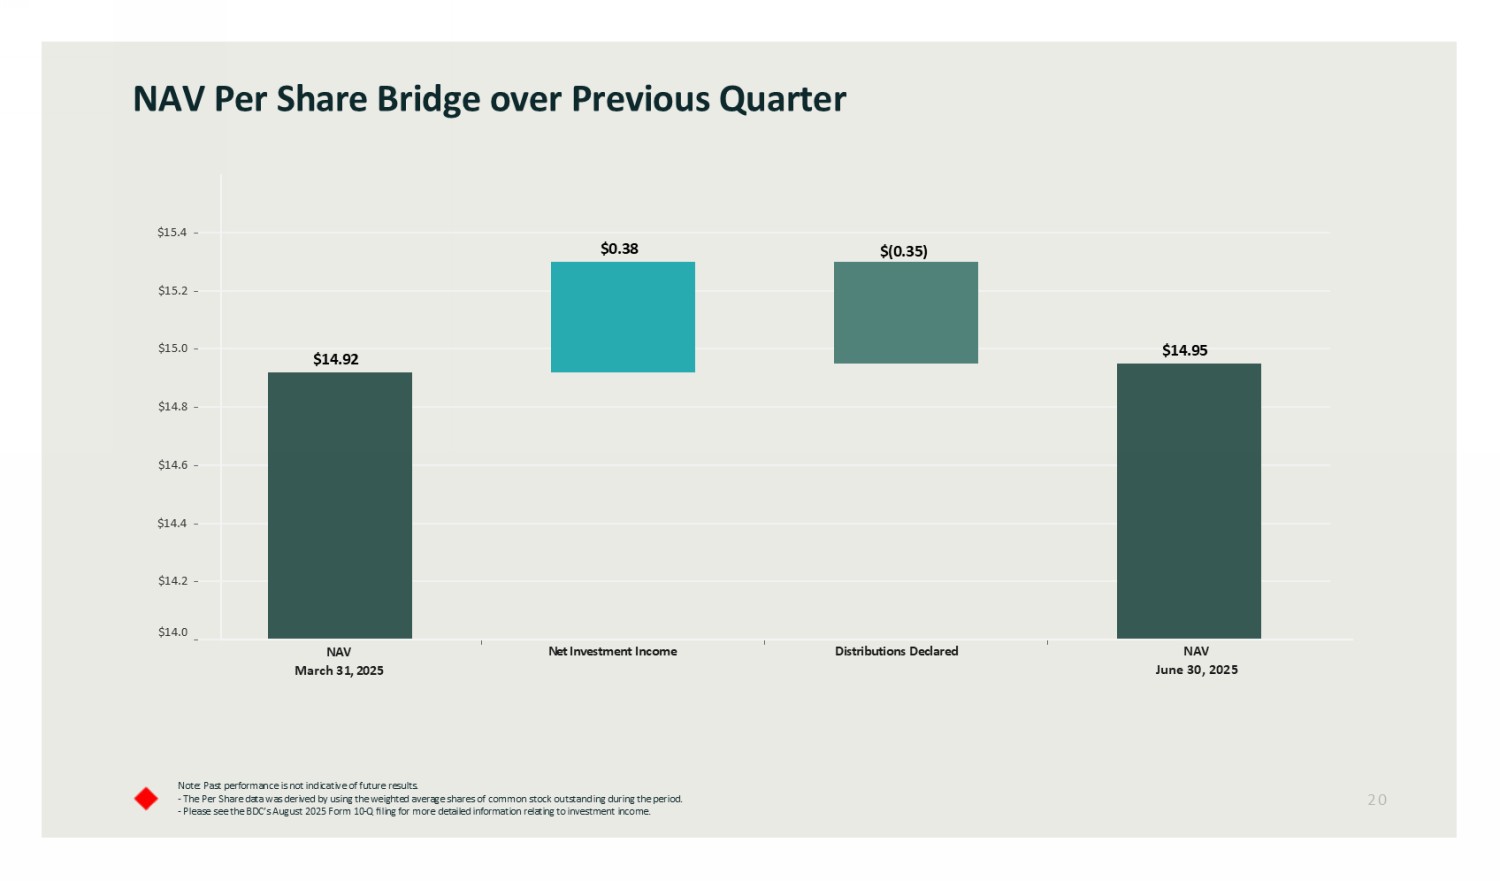
Note: Past performance is not indicative of future results. - The Per Share data was derived by using the weighted average shares of common stock outstanding during the period. - Please see the BDC’s August 2025 Form 10 - Q filing for more detailed information relating to investment income. NAV Per Share Bridge over Previous Quarter 20 PREVIOUS_NAV_VALUE Net Investment Income Distributions Declared CURRENT_NAV_VALUE $14.2 $14.0 $14.4 $14.6 $14.8 $15.0 $15.2 $15.4 $(0.35) $14.95 $0.38 $14.92 NAV June 30, 2025 NAV March 31 , 2025
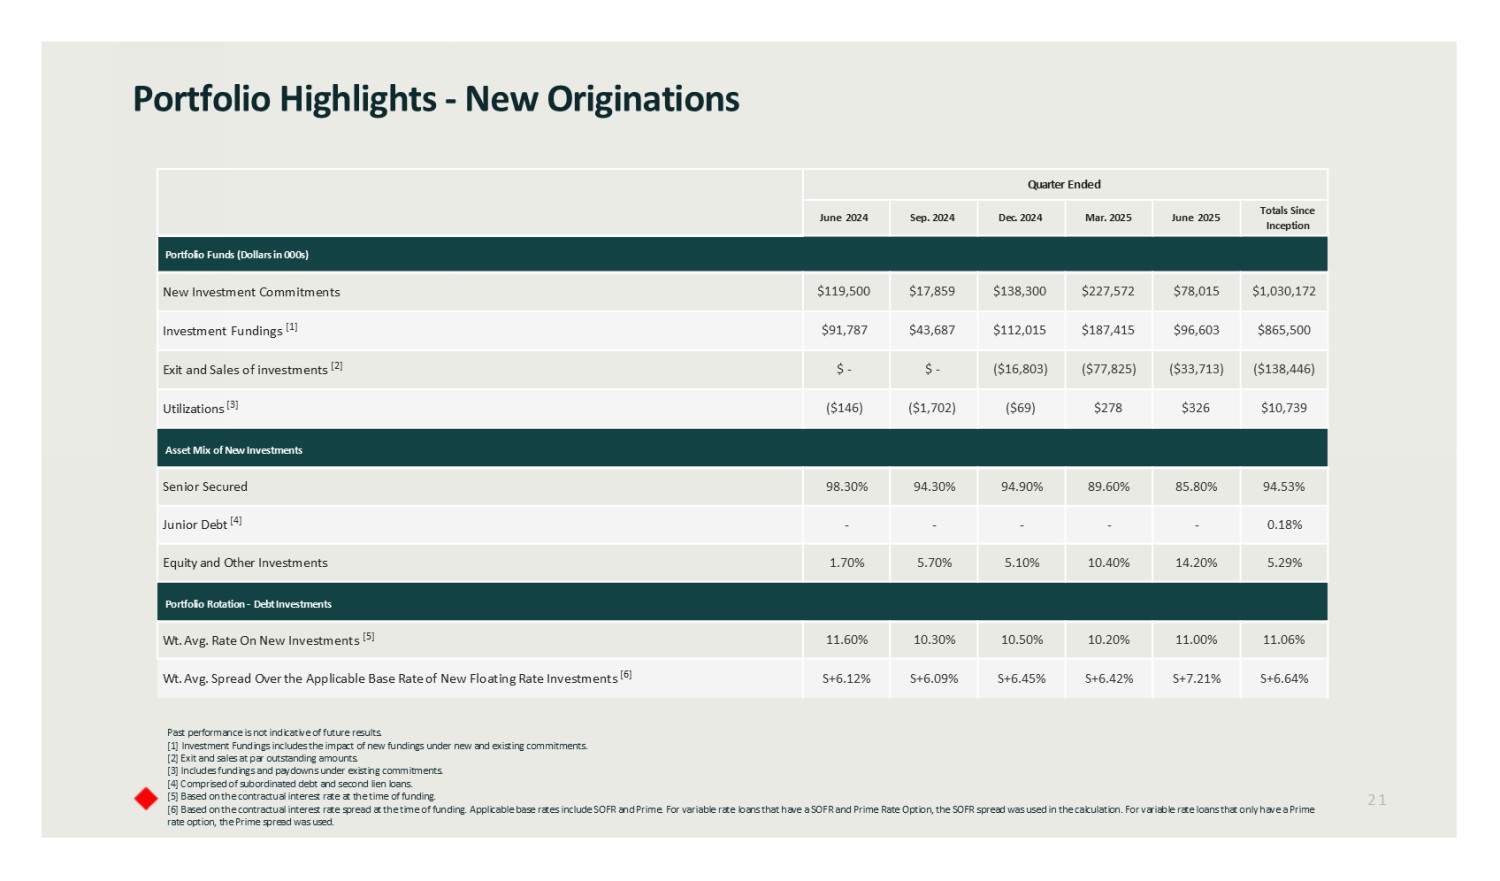
Past performance is not indicative of future results. [1] Investment Fundings includes the impact of new fundings under new and existing commitments. [2] Exit and sales at par outstanding amounts. [3] Includes fundings and paydowns under existing commitments. [4] Comprised of subordinated debt and second lien loans. [5] Based on the contractual interest rate at the time of funding. [6] Based on the contractual interest rate spread at the time of funding. Applicable base rates include SOFR and Prime. For v ari able rate loans that have a SOFR and Prime Rate Option, the SOFR spread was used in the calculation. For variable rate loans tha t only have a Prime rate option, the Prime spread was used. Portfolio Highlights - New Originations 21 Jan, 9999 Quarter Ended Totals Since Inception June 2025 Mar. 2025 Dec. 2024 Sep. 2024 June 2024 Portfolio Funds (Dollars in 000s) $1,030,172 $78,015 $227,572 $138,300 $17,859 $119,500 New Investment Commitments $865,500 $96,603 $187,415 $11 2 , 015 $43,687 $91,787 Investment Fundings [1] ($138,446) ($33,713) ($77,825) ($16,803) $ - $ - Exit and Sales of investments [2] $10,739 $326 $278 ($69) ($1,702) ($146) Utilizations [3] Asset Mix of New Investments 94.53% 85.80% 89.60% 94.90% 94.30% 98.30% Senior Secured 0.18% - - - - - Junior Debt [4] 5.29% 14.20% 10.40% 5.10% 5.70% 1.70% Equity a nd Other Investments Portfolio Rotation - Debt Investments 11.06% 1 1 . 00 % 10. 20 % 10. 50 % 10. 30 % 11.60% Wt. Avg. Rate On New Investments [5] S+6.64% S+7.21% S+6.42% S+6.45% S+6.09% S+6.12% Wt. Avg. Spread Over t he Applicable Base Rate o f New Floating Rate Investments [6]
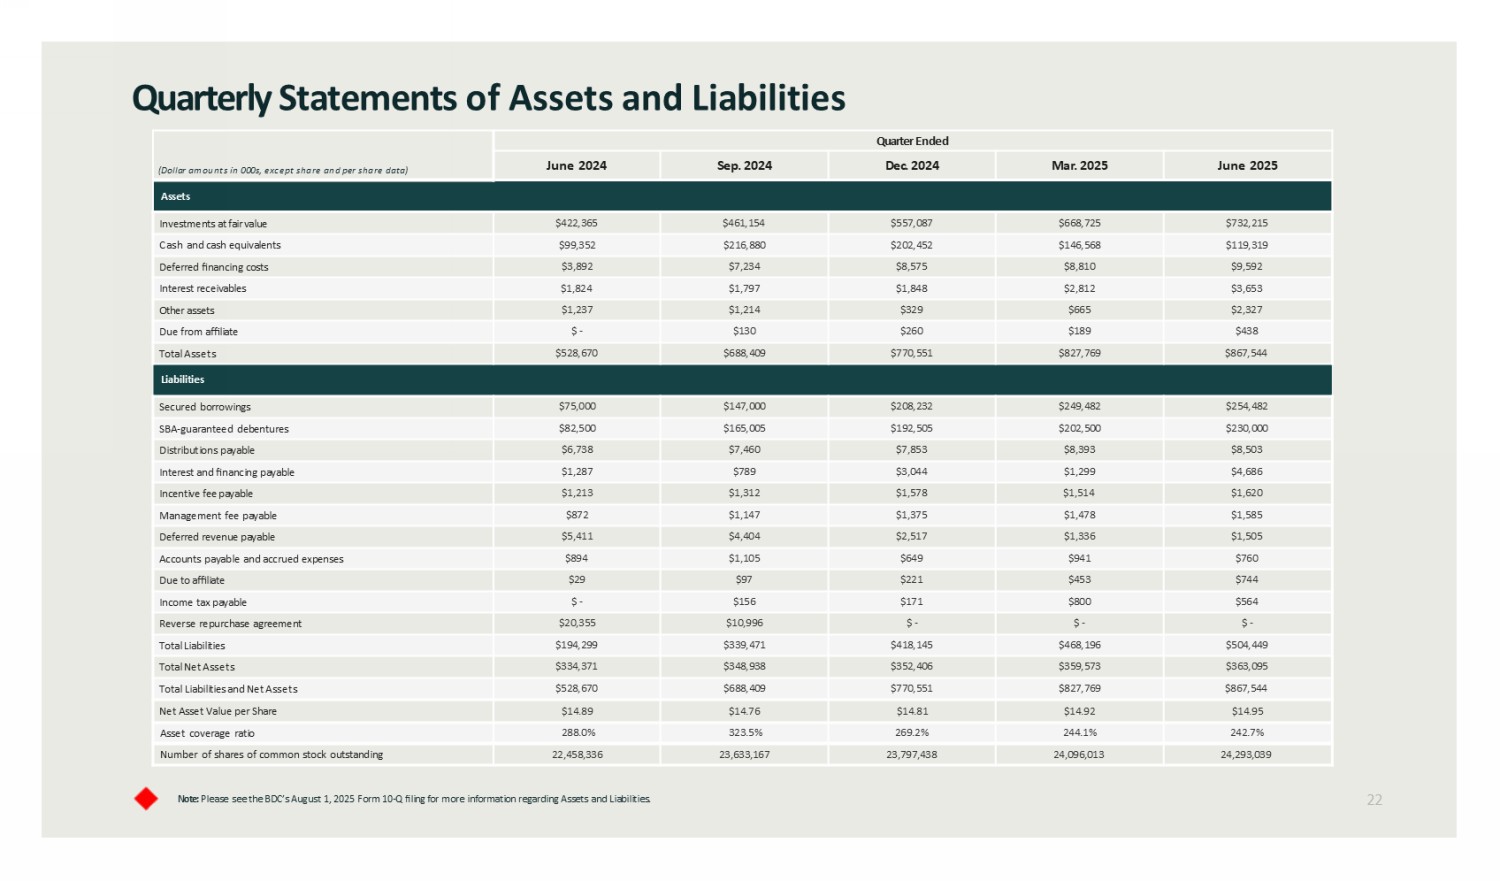
Note: Please see the BDC’s August 1 , 2025 Form 10 - Q filing for more information regarding Assets and Liabilities. Quarterly Statements of Assets and Liabilities 22 (unaudited) (unaudited) (unaudited) (unaudited) (unaudited) Quarter Ended (Dollar amounts in 000s, except share and per share data) June 2025 Mar . 2025 Dec . 2024 Sep . 2024 June 2024 Assets $732,215 $668,725 $557,087 $461,154 $422,365 Investments at fair value $119,319 $146,568 $202,452 $216,880 $99,352 Cash and cash equivalents $9,592 $8,810 $8,575 $7,234 $3,892 Deferred financing costs $3,653 $2,812 $1,848 $1,797 $1,824 Interest receivables $2,327 $665 $329 $1,214 $1,237 Other assets $438 $189 $260 $130 $ - Due from affiliate $867,544 $827,769 $770,551 $688,409 $528,670 Total Assets Liabilities $254,482 $249,482 $208,232 $147,000 $75,000 Secured borrowings $230,000 $202,500 $192,505 $165,005 $82,500 SBA - guaranteed debentures $8,503 $8,393 $7,853 $7,460 $6,738 Distributions payable $4,686 $1,299 $3,044 $789 $1,287 Interest and financing payable $1,620 $1,514 $1,578 $1,312 $1,213 Incentive fee payable $1,585 $1,478 $1,375 $1,147 $872 Management fee payable $1,505 $1,336 $2,517 $4,404 $5,411 Deferred revenue payable $760 $941 $649 $1,105 $894 Accounts payable and accrued expenses $744 $453 $221 $97 $29 Due to affiliate $564 $800 $171 $156 $ - Income tax payable $ - $ - $ - $10,996 $20,355 Reverse repurchase agreement $504,449 $468,196 $418,145 $339,471 $194,299 Total Liabilities $363,095 $359,573 $352,406 $348,938 $334,371 Total Net Assets $867,544 $827,769 $770,551 $688,409 $528,670 Total Liabilities and Net Assets $14.95 $14.92 $14.81 $14.76 $14.89 Net Asset Value per Share 242.7% 244.1% 269.2% 323.5% 288.0% Asset coverage ratio 24,293,039 24,096,013 23,797,438 23,633,167 22,458,336 Number of shares of common stock outstanding
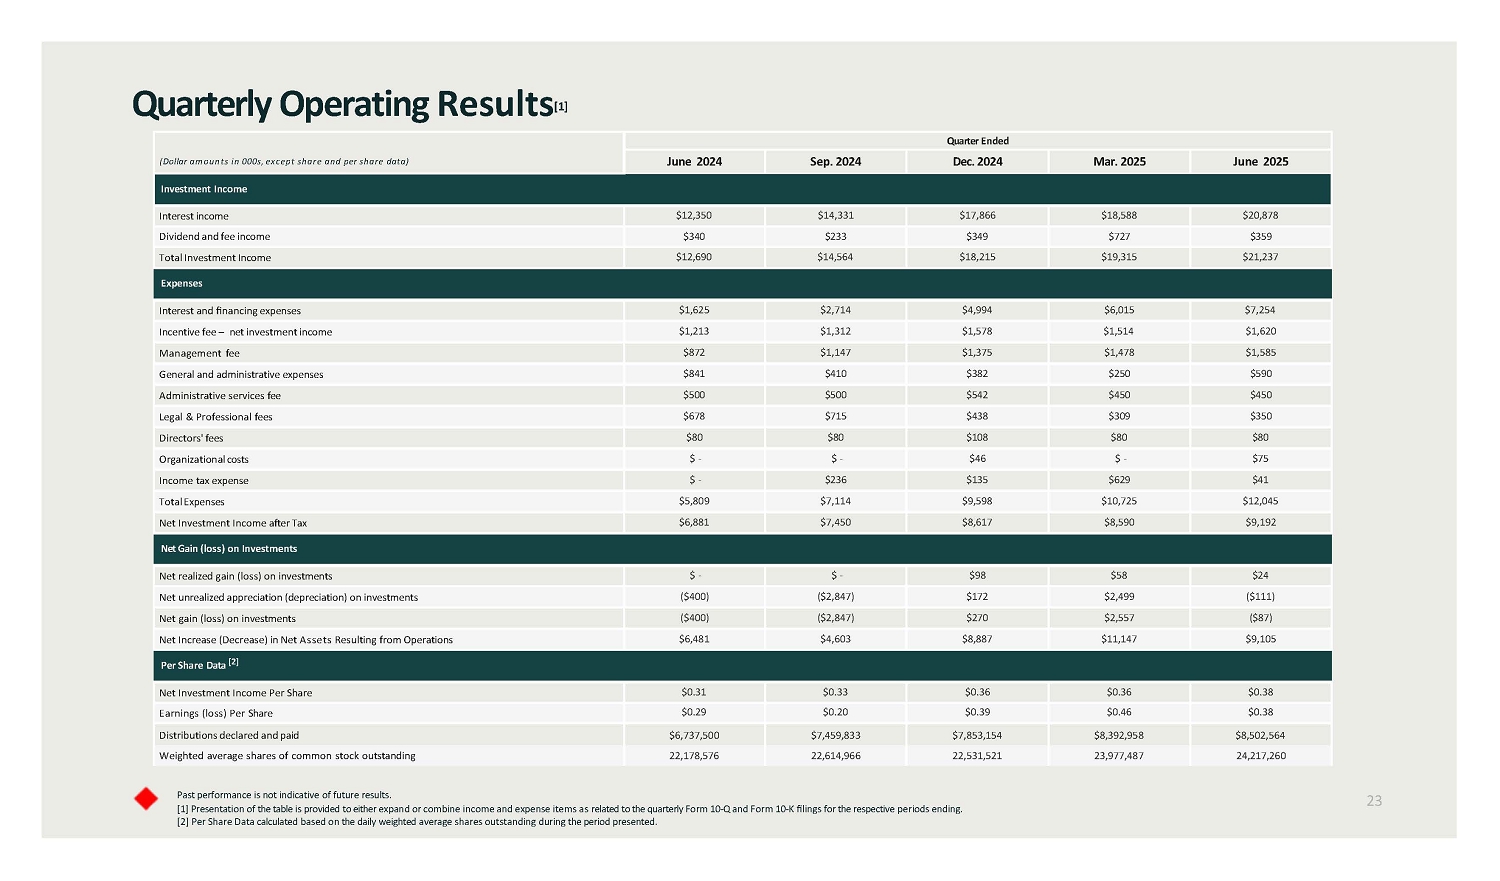
Past performance is not indicative of future results. [1] Presentation of the table is provided to either expand or combine income and expense items as related to the quarterly Form 10 - Q and Form 10 - K filings for the respective periods ending. [2] Per Share Data calculated based on the daily weighted average shares outstanding during the period presented. Quarterly Operating Result s [1] 23 (unaudited) (unaudited) (unaudited) (unaudited) (unaudited) Quarter Ended (Dollar amounts in 000s, except share and per share data) June 2025 Mar. 2025 Dec. 2024 Sep. 2024 June 2024 Investment Income $20,878 $18,588 $17,866 $14,331 $12,350 Interest income $359 $727 $349 $233 $340 Dividend and fee income $21,237 $19,315 $18,215 $14,564 $12,690 Total Investment Income Expenses $7,254 $6,015 $4,994 $2,714 $1,625 Interest and financing expenses $1,620 $1,514 $1,578 $1,312 $1,213 Incentive fee – net investment income $1,585 $1,478 $1,375 $1,147 $872 Management fee $590 $250 $382 $410 $841 General and administrative expenses $450 $450 $542 $500 $500 Administrative services fee $350 $309 $438 $715 $678 Legal & Professional fees $80 $80 $108 $80 $80 Directors' fees $75 $ - $46 $ - $ - Organizational costs $41 $629 $135 $236 $ - Income tax expense $12,045 $10,725 $9,598 $7,114 $5,809 Total Expenses $9,192 $8,590 $8,617 $7,450 $6,881 Net Investment Income after Tax Net Gain ( l oss) on Investments $24 $58 $98 $ - $ - Net realized gain (loss) on investments ($111) $2,499 $172 ($2,847) ($400) Net unrealized appreciation (depreciation) on investments ($87) $2,557 $270 ($2,847) ($400) Net gain (loss) on investments $9,105 $11,147 $8,887 $4,603 $6,481 Net Increase (Decrease) in Net Assets Resulting from Operations Per Share Data [2] $0.38 $0.36 $0.36 $0.33 $0.31 Net Investment Income Per Share $0.38 $0.46 $0.39 $0.20 $0.29 Earnings ( l oss) Per Share $8,502,564 $8,392,958 $7,853,154 $7,459,833 $6,737,500 Distributions declared and paid 24,217,260 23,977,487 22,531,521 22,614,966 22,178,576 Weighted average shares of common stock outstanding
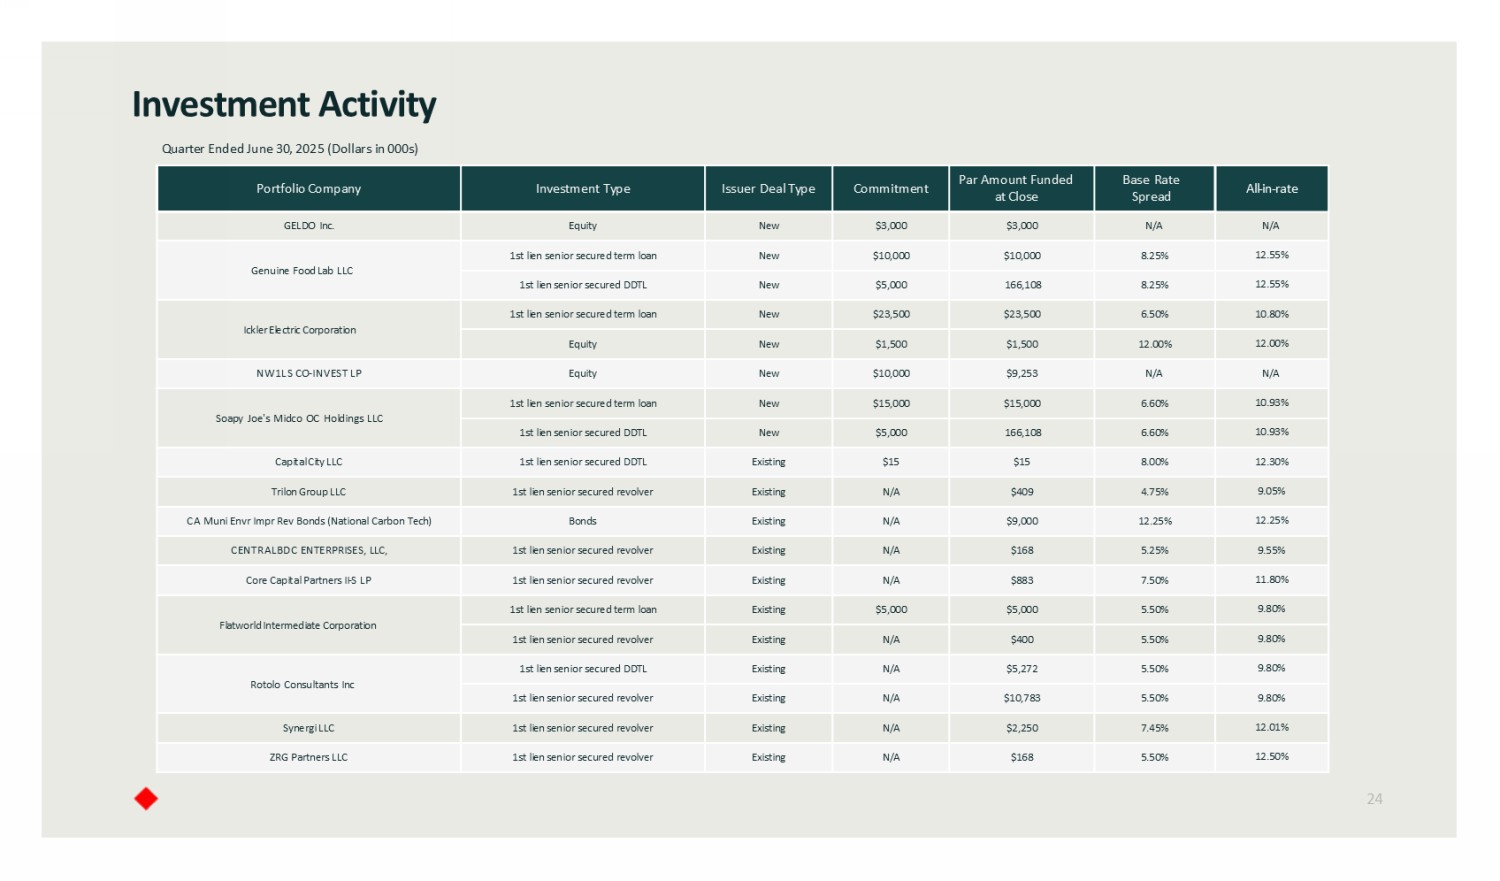
All - in - rate Base Rate Spread Par Amount Funded a t Close Commitment Issuer Deal Type Investment Type Portfolio Company N/A N/A $3,000 $3,000 New Equity GELDO Inc. 12.55% 8.25% $10,000 $10,000 New 1st lien senior secured term loan Genuine Food Lab LLC 12.55% 8.25% 166,108 $5,000 New 1st lien senior secured DDTL 10.80% 6.50% $23,500 $23,500 New 1st lien senior secured term loan Ickler Electric Corporation 12.00% 12.00% $1,500 $1,500 New Equity N/A N/A $9,253 $10,000 New Equity NW1LS CO - INVEST LP 10.93% 6.60% $15,000 $15,000 New 1st lien senior secured term loan Soapy Joe's Midco OC Holdings LLC 10.93% 6.60% 166,108 $5,000 New 1st lien senior secured DDTL 12.30% 8.00% $15 $15 Existing 1st lien senior secured DDTL Capital City LLC 9.05% 4.75% $409 N/A Existing 1st lien senior secured revolver Trilon Group LLC 12.25% 12.25% $9,000 N/A Existing Bonds CA Muni Envr Impr Rev Bonds (National Carbon Tech) 9.55% 5.25% $168 N/A Existing 1st lien senior secured revolver CENTRALBDC ENTERPRISES, LLC, 11.80% 7.50% $883 N/A Existing 1st lien senior secured revolver Core Capital Partners II - S LP 9.80% 5.50% $5,000 $5,000 Existing 1st lien senior secured term loan Flatworld Intermediate Corporation 9.80% 5.50% $400 N/A Existing 1st lien senior secured revolver 9.80% 5.50% $5,272 N/A Existing 1st lien senior secured DDTL Rotolo Consultants Inc 9.80% 5.50% $10,783 N/A Existing 1st lien senior secured revolver 12.01% 7.45% $2,250 N/A Existing 1st lien senior secured revolver Synergi LLC 12.50% 5.50% $168 N/A Existing 1st lien senior secured revolver ZRG Partners LLC Quarter Ended June 30, 2025 (Dollars in 000s) Investment Activity 24
25 Important Information This presentation should be read in conjunction with the BDC's Form 10 - Q which was filed with the U . S . Securities and Exchange Commission (“SEC”) on August 1 , 2025 , which summarizes certain financial and performance information for the quarter ended June 30 , 2025 . Past performance is not indicative of future results . [ 1 ] “Working - Class Areas” refers to : i ) “Empowerment Zones”, as defined in the Empowerment Zones and Enterprise Communities Act of 1993 , as amended ; ii) “Opportunity Zones”, as defined in the U . S . Tax Cut and Jobs Act of 2017 , and/or areas targeted by a government entity for redevelopment or to revitalize or stabilize designated disaster areas ; and iii) low - and moderate - income (“LMI”) areas, as defined under applicable Community Reinvestment Act (“CRA”) regulation as an individual income that is less than 80 % of the area median income (“AMI”) or a median family income that is less than 80 % in a census tract . AMI is defined as the median family income for the metropolitan statistical area or metropolitan division, if applicable, or if the person or census tract is located outside of a metropolitan statistical area, the statewide non - metropolitan median family income . We may use the terms "LMI", "underserved" and “Working - Class" interchangeably . [ 2 ] National turnover includes private employee data from the U . S . Bureau of Labor Statistics (“BLS”) - Job Openings and Labor Turnover Survey for calendar year 2024 . Data is dated as of July 29 , 2025 . [ 3 ] PYMNTS & Lending Club, February 2025 . [ 4 ] National private sector retirement benefits participation data is sourced from the BLS March 2024 National Compensation Survey . “Lower wage workers” refers to those earning less than 25 % of average wages . [ 5 ] Lafayette Square analysis of the SEC’s Electronic Data Gathering, Analysis, and Retrieval (“EDGAR”) database of BDC portfolio companies and Dun & Bradstreet data as of March 31 , 2025 . The Federal Financial Institutions Examination Council’s (“FFIEC”) defines middle to upper income as median family incomes making greater than 80 % of the area median income . “Middle market" is defined as firms with revenue between $ 10 million and $ 1 billion . [ 6 ] Lafayette Square analysis of BDC portfolio companies in the EDGAR database, as of March 31 , 2025 . Cross investments includes all public and private BDCs ; fair value has been considered to calculate overlap in assets . [ 7 ] Portfolio company employment metrics shown are comprised of ( 1 ) KPI quarterly reporting data from 21 of 45 portfolio companies as of June 30 , 2025 ; and ( 2 ) data collected as of the BDC’s initial investment for the remaining portfolio companies who did not agree to provide quarterly census data . Corresponding employee metrics rely on feedback from our portfolio companies, the accuracy of which cannot be guaranteed and may be calculated differently by each company . [ 8 ] “Change Since Initial Investment Average” represents the average of all portfolio companies' change in turnover, medical care participation or retirement participation since the BDC's initial investment, otherwise known as deal close date, with the portfolio company . Where data wasn't available in the same quarter as the initial investment, the next available quarter's data was used . Percentages are based on 21 of 45 portfolio companies’ current human capital data made available to Lafayette Square . [ 9 ] Lafayette Square’s 2030 Goals (“Goal 2030 ”) to ( 1 ) increase employment opportunities (by helping businesses create and/or retain 100 , 000 Working - Class jobs, and 150 , 000 jobs overall), ( 2 ) provide significant managerial assistance to small and middle - market companies (by incentivizing at least 50 % of our borrowers to adopt Worker Solutions®) and ( 3 ) encourage economic growth in Working - Class communities (by investing at least 50 % of our portfolio in borrowers who are either located in Working - Class communities or are substantial employers of Working - Class people . ) [ 10 ] Lafayette Square seeks to improve the retention, well - being, and productivity of employees by connecting portfolio companies with third - party service providers that deliver workplace benefits and/or advisory support ("Third - Party Solution Providers") through Lafayette Square’s affiliated Worker Solutions® platform . Worker Solutions® inputs represent services offered by 4 of 8 Third - Party Solutions Providers adopted by Lafayette Square portfolio companies and HR policy changes implemented by portfolio companies . Please note that metrics regarding the use of the following Third - Party Service Providers have not been included : ( i ) Vault, due to services having not yet been utilized by workers ; (ii) Esusu , as services are currently offered only to an affiliated project of a Lafayette Square portfolio company and not to employees of the portfolio company ; and (iii) medZERO , Inc . services which are set to launch during Q 3 2025 for one portfolio company . [ 11 ] Cumulative savings through Sunny Day Fund Solutions, Inc . , a Third - Party Service Provider, represents 195 workers across three portfolio companies from a total of 2 , 290 workers that have access to the service . Sunny Day Fund was adopted by two additional portfolio companies during Q 2 2025 , with services set to be deployed during Q 3 2025 .
26 Important Information [ 12 ] Cumulative debt was prevented through the use of HoneyBee , a Third - Party Solution Provider, for 146 workers across two portfolio companies from a total of 1 , 790 workers with access to the service . Savings relative to high - cost lending products calculated by using the average payday loan APR (~ 400 % ), average loan amount of $ 215 , and an assumed 5 - month repayment period (the average time it takes to repay payday loans) . https : //www . incharge . org/debt - relief/how - payday - loans - work/ [ 13 ] HR policy changes were implemented by three portfolio companies, resulting in 3 , 055 workers now having access to additional services resulting from those changes . [ 14 ] 45 workers have signed up for credit building services via rent reporting through Boom Pay, Inc . , a Third - Party Solution Provider, with a total of 555 workers having access to these services in one portfolio company . Credit building metrics from Esusu are not included, as services are currently offered only to a portfolio company’s affiliated project and not directly to employees of the portfolio company . [ 15 ] Seven workers of one portfolio company have participated in 52 1 : 1 financial coaching sessions through TrustPlus , a Third - Party Solution Provider . [ 16 ] On June 27 , 2025 , the Board of Directors of the BDC declared a regular distribution to stockholders in the amount of $ 0 . 28 per share and a supplemental distribution in the amount of $ 0 . 07 per share . In the aggregate, the regular distribution and supplemental distribution represents an annualized distribution rate of approximately 9 . 4 % [ 17 ] Lafayette Square rewards portfolio companies with an interest rate stepdown when they adopt services from Third - Party Solution Providers and/or implement policy changes to existing workplace benefits (defined as “Qualifying Human Capital Investments”) that we believe will enhance employee well - being and improve retention . As of June 30 , 2025 , we have rewarded a combined total of $ 237 , 671 through interest rate step down savings . Lafayette Square portfolio companies having adopted Qualifying Human Capital Investments have received a total of $ 361 , 612 in cumulative savings through interest rate step downs from the BDC in addition to other sources, including the Private Fund and other non - Lafayette Square lenders . [ 18 ] Weighed Average Yield is only one component of expected performance and is not, and should not, be viewed as a statement of the future performance of the BDC . Yield of Assets in the portfolio is not indicative of the return or distribution rate received by investors . [ 19 ] Portfolio company employment metrics shown are comprised of 1 ) KPI quarterly reporting data from 21 of 45 portfolio companies as June 30 , 2025 ; and 2 ) data collected as of the BDC’s initial investment for the remaining portfolio companies who did not agree to provide quarterly census data . Corresponding employee metrics rely on feedback from our portfolio companies, the accuracy of which cannot be guaranteed and may be calculated differently by each company . [ 20 ] National median income data is from the U . S . Census Bureau’s 2022 American Community Survey . This is the most recent data available as of July 2025 . Median family income is used to calculate individual LMI per CRA guidelines . The metric is included at the national level to serve as a similar, but not exact, comparison . [ 21 ] Turnover rates are calculated by dividing the total amount of terminations, voluntary and involuntary, for the period by the average number of employees who worked during or received pay for the same period . National turnover includes private employee data from the BLS Job Openings and Labor Turnover Survey for the calendar year of 2025 . Data was extracted as of July 29 , 2025 . [ 22 ] Medical Care Benefits are plans that provide services or payments for services rendered in the hospital or by a qualified medical care provider . Participation is calculated from the unrounded percentage of workers who participate in the plan . 1 , 447 employees from portfolio companies who did not provide medical care benefits data to the Company were not included in this calculation . National private sector medical care and retirement benefits participation data are sourced from the BLS March 2024 National Compensation Survey . [ 23 ] Retirement Benefit plans includes defined benefit pension plans and defined contribution retirement plans . Participation is calculated from the unrounded percentage of workers who participate in the plan . 1 , 591 employees from portfolio companies who did not provide medical care benefits data to the Company were not included in this calculation . National private sector medical care and retirement benefits participation data are sourced from the BLS March 2024 National Compensation Survey .
Contact Us 27 Lafayette Square BDC Website https://www.lafayettesquarebdc.com Informatio n info@lafayettesquare.com