Other Information
Continued
Update on Quebec class action, CCAA and the Proposed Plans in Canada
As previously announced, on 17 October 2024, the court-appointed Mediator’s and Monitor’s plan of compromise and
arrangement was filed in the Ontario Superior Court of Justice. Substantially similar proposed plans were also filed for Rothmans,
Benson & Hedges Inc. (RBH, a subsidiary of Philip Morris International Inc.) and JTI-Macdonald Corp. (JTIM, a subsidiary of Japan
Tobacco International) (collectively, the Proposed Plans).
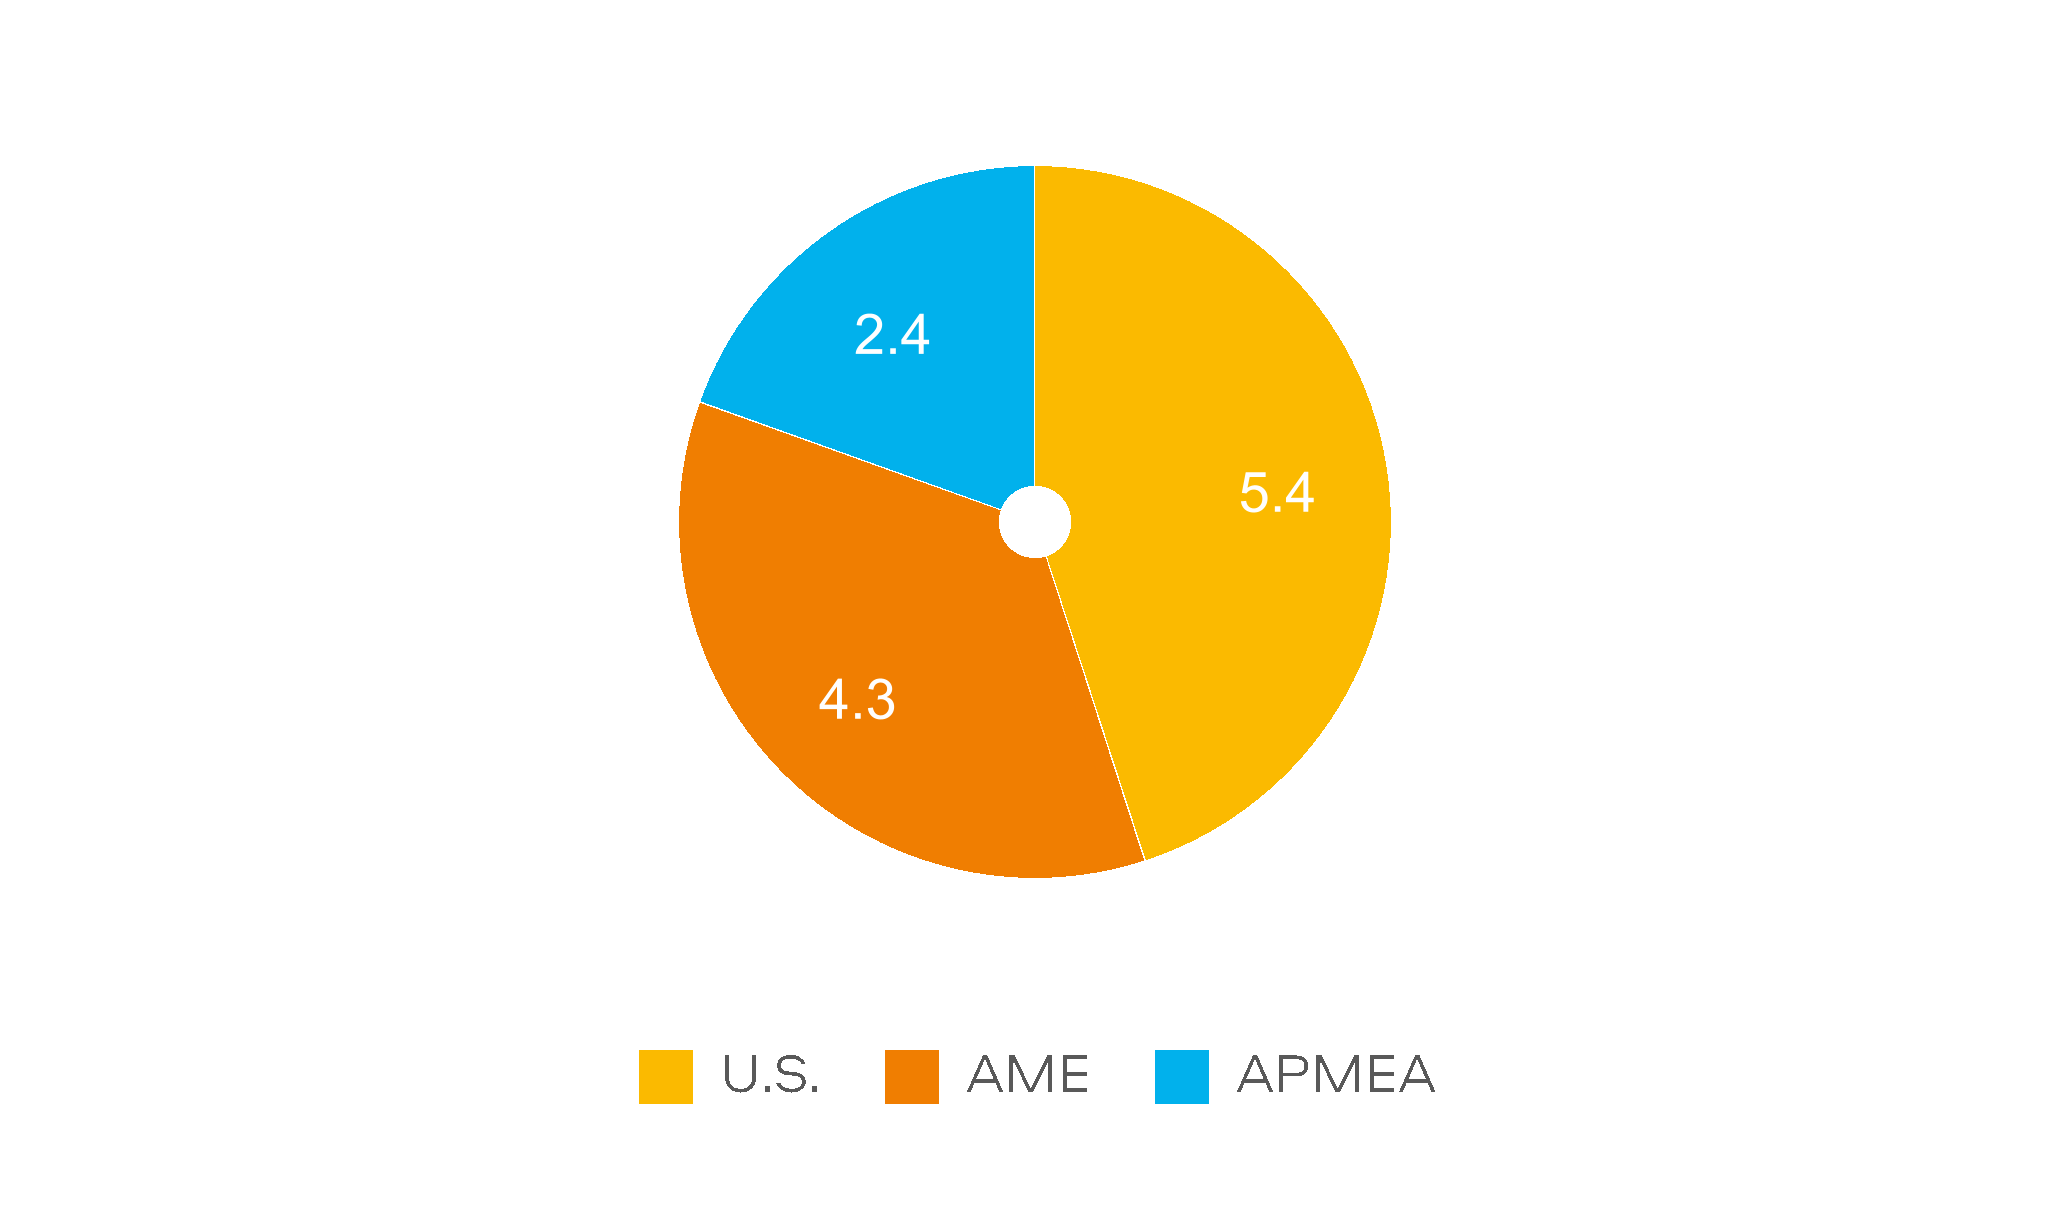
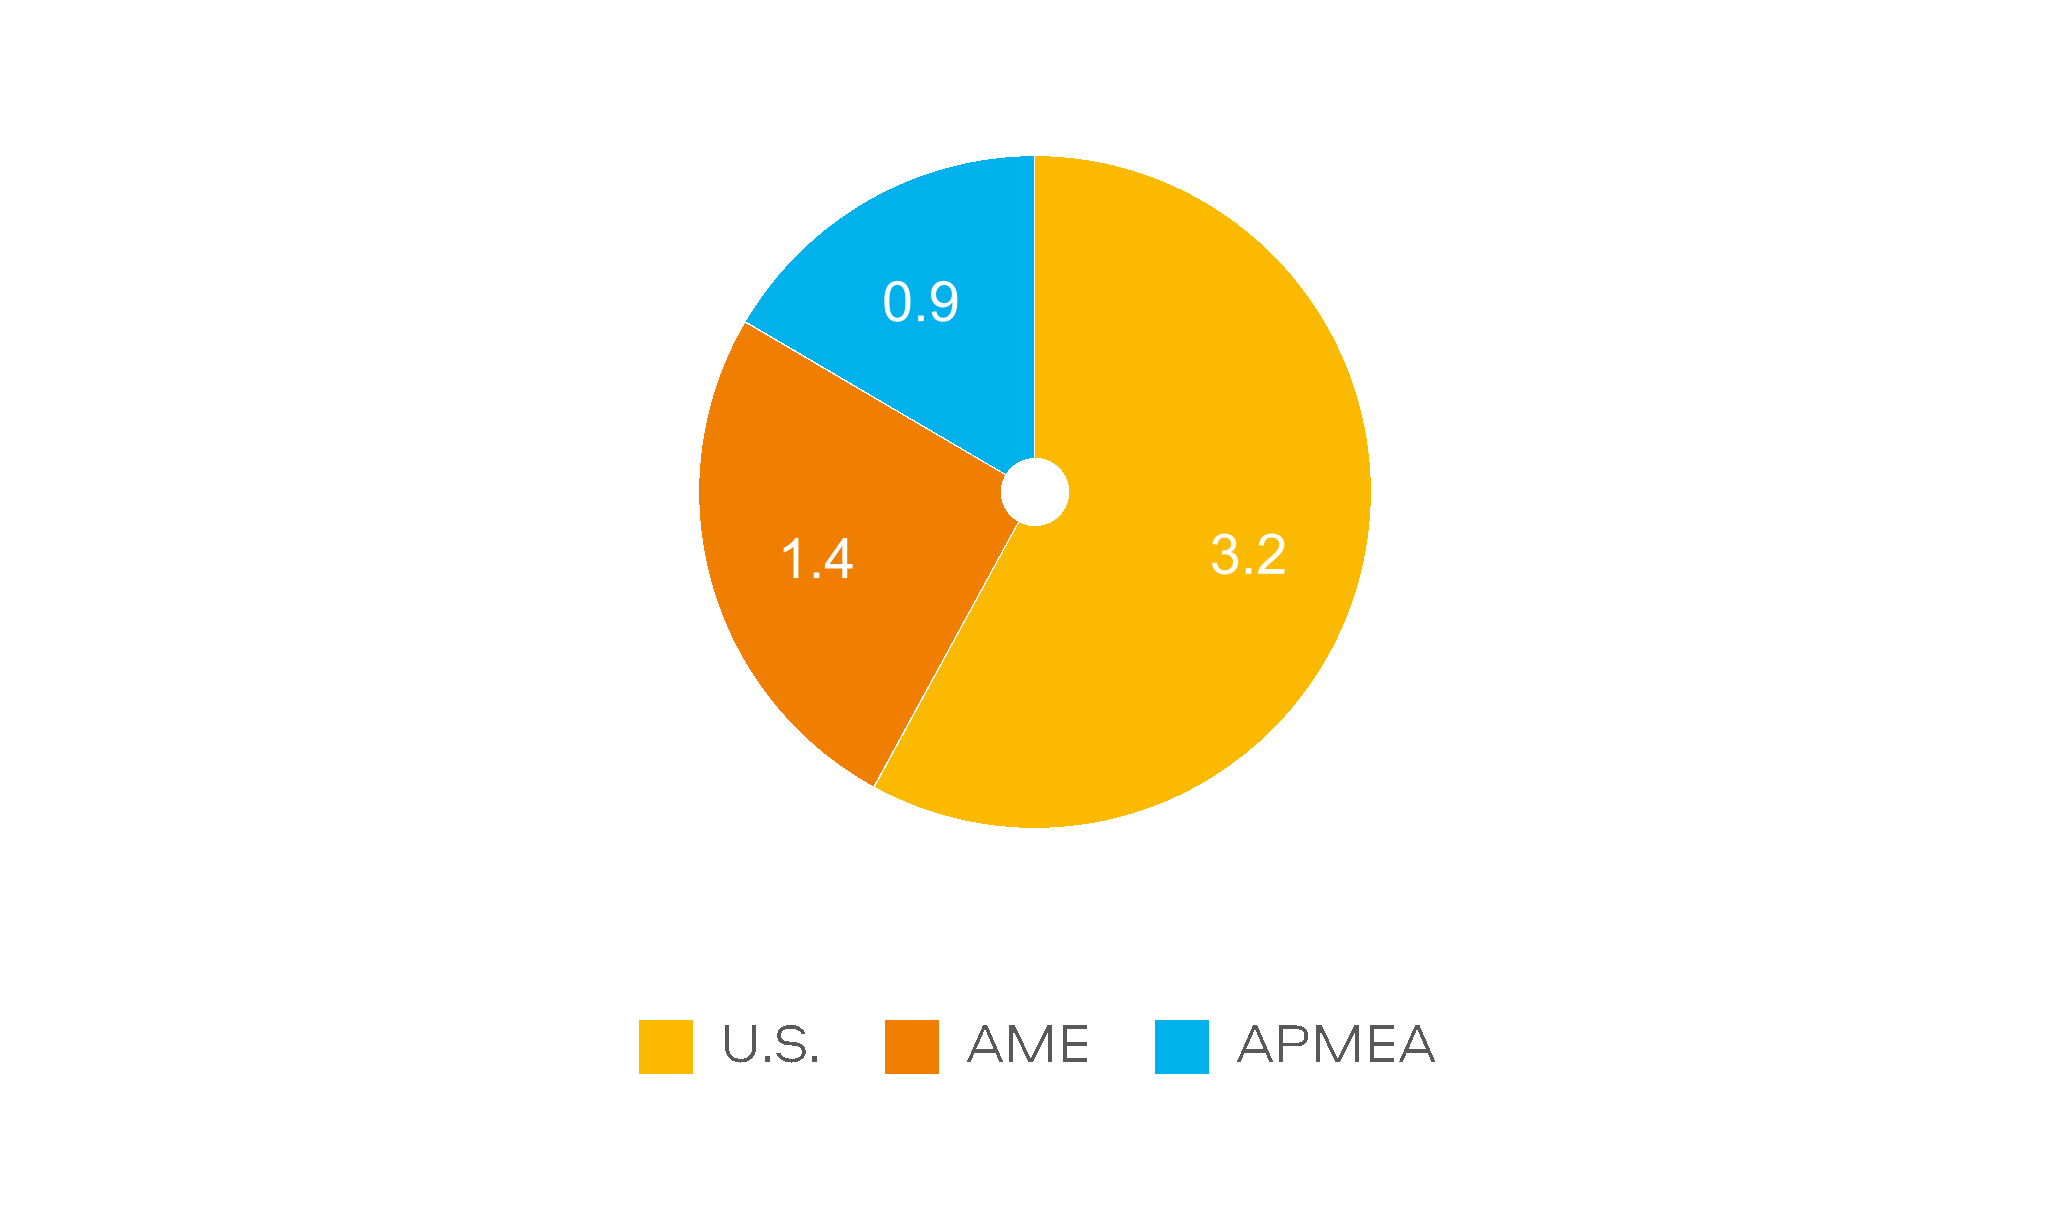
Under the Proposed Plans, ITCAN, RBH and JTIM (the Companies) would pay an aggregate settlement amount of CAD$32.5
billion (approximately £17.4 billion). This amount would be funded by:
– an upfront payment equal to all the Companies’ cash and cash equivalents on hand (including investments held at fair value)
plus certain court deposits (subject to an aggregate industry withholding of CAD$750 million (approximately £401 million)) plus
85% of any cash tax refunds that may be received by the Companies on account of the upfront payments; and
– annual payments based on a percentage (initially 85%, reducing over time) of each of the Companies’ net income after taxes,
based on amounts generated from all sources, excluding New Categories, until the aggregate settlement amount is paid.
On 31 October 2024, the court granted certain orders pursuant to which the Proposed Plans were accepted for filing. On 12
December 2024, the Proposed Plans were approved by the requisite majorities of the creditors. On 6 March 2025, the Court
sanctioned an amended version of the Proposed Plans (hereinafter referred to as the Approved Plans), wherein the aggregate
industry withholding of CAD$750 million was allocated to RBH. In this sanction order, the Court has also extended the stays of
litigation up to the implementation date of the Approved Plans.
The Approved Plans resolve all Canadian tobacco litigation and provide a full and comprehensive release to ITCAN, BAT p.l.c. and
all related companies for all past, present and future tobacco claims in Canada.
In line with IFRS 10 Consolidated Financial Statements, ITCAN is consolidated in the Group’s results.
Under IAS 37 Provisions, Contingent Liabilities and Contingent Assets, when there is an expected future economic outflow,
arising from a past event, the value of which can be reasonably estimated, a provision should be recognised. A provision of £6.2
billion was recognised in 2024.
It is expected that approximately £2.6 billion will be paid in the second half of 2025 in relation to the upfront payment.
In the six months to 30 June 2025, the Group's estimated share of the undiscounted future liability has not materially changed.
However, the Group has recognised a net credit of £575 million as the provision recognised in relation to the Canadian litigation
settlement was updated in line with the latest forecast of the Canadian combustibles industry performance, impacting the
present value of the future liability described on page 25. The update was, in particular, in respect of pricing and volume decline assumptions, The net credit has been treated as an adjusting item.
At 30 June 2025, restricted cash in ITCAN was £2,047 million and restricted investments held at fair value were £427 million, with
goodwill recognised on the balance of the Group at £2,148 million.
Please refer to “Contingent Liabilities and Financial Commitments” below (page 33) and the Group’s Annual Report and Accounts and Form 20-F for the year ended 31 December 2024 (note 12 Intangible Assets and note 31 Contingent Liabilities and Financial
Commitments) for a full discussion of the case and the assessment of goodwill.
There has been no trigger to further reassess goodwill for impairment at 30 June 2025.
Adjusted performance:
As the Chief Operating Decision Maker, the Management Board (from 1 January 2025) assesses the performance of the Group by
reviewing adjusted profit from operations as adjusted for Canada using the prior year translational exchange rate (constant rate)
to evaluate segment performance and allocate resources to the overall business on a regional basis.
This new measure, being adjusted profit from operations as adjusted for Canada, at constant rates, recognises a charge
calculated in line with the Approved Plans – based on a percentage of Imperial Tobacco Canada Limited's and Imperial Tobacco
Company Limited's (together ITCAN) adjusted profit from operations from all sources in Canada, excluding New Categories. This
charge will continue until the aggregate settlement amount is paid. This is reflected in the adjusted performance of the Group
and is referred to as “as adjusted for Canada”. This approach presents the economic delivery from the AME region in a manner
comparable to that of the other regions in the Group.
Due to the uncertain nature of the timing of the implementation of the settlement on the Group’s 2025 results, for the purposes
of 2025 versus 2024 this charge is 100% of the adjusted profit from operations from all sources in Canada, excluding New
Categories.
From 2026 (assuming the Approved Plans as sanctioned by the Court on 6 March 2025 have been implemented in 2025), this
charge will (following the underlying terms of the Approved Plans) be 85% of the adjusted profit from operations earned in
Canada from all sources, excluding New Categories, reducing in future periods in line with the Approved Plans.
Also from 1 January 2025, the Group has recognised an adjusting charge in net finance costs in respect of interest earned on the
restricted cash held in Canada that will be paid as part of the upfront settlement payment. This is adjusted out from the current
year and comparator performance, as the interest income is not representative of the ongoing business.
Update on investigations and other proceedings
The Group investigates, and becomes aware of governmental authorities’ investigations into, allegations of misconduct, including
alleged breaches of sanctions and allegations of corruption at Group companies. Some of these allegations are currently being
investigated. The Group cooperates with the authorities, where appropriate.
In addition, the Group is, and may in the future be, subject to investigations or legal proceedings in relation to, among other
things, its marketing, promotion or distribution activities in respect of its products. As such, the Group or Group companies,
could be subject to liability and costs associated with any damages, fines, or penalties brought in connection with these
allegations.