
EXHIBIT 99.2
Codere Online Q2 2025 Earnings July 31, 2025

Disclaimer This presentation (this “Presentation”), its contents and any information provided during the meeting to present this document are for discussion purposes only, and must not be relied upon for any purpose . This Presentation is not for release, publication or distribution, in whole or in part, in or into any jurisdiction where such distribution would be unlawful . Certain terms used throughout this Presentation are defined in the Defined Terms section included at the end of this Presentation . Forward - Looking Statements Certain statements in this document may constitute “forward - looking statements” within the meaning of the “safe harbor” provisions of the United States Private Securities Litigation Reform Act of 1995 . Forward - looking statements include, but are not limited to, statements regarding Codere Online Luxembourg, S . A . and its subsidiaries (collectively, “Codere Online”) or Codere Online’s or its management team’s expectations, hopes, beliefs, intentions or strategies regarding the future . In addition, any statements that refer to projections, forecasts or other characterizations of future events or circumstances, including any underlying assumptions, are forward - looking statements . The words “anticipate,” “believe,” “continue,” “could,” “estimate,” “expect,” “intends,” “may,” “might,” “plan,” “possible,” “potential,” “predict,” “project,” “should,” “would” and similar expressions may identify forward - looking statements, but the absence of these words does not mean that a statement is not forward - looking . Forward - looking statements in this document may include, for example, statements about Codere Online’s financial performance and, in particular, the potential evolution and distribution of its net gaming revenue ; any prospective and illustrative financial information ; and changes in Codere Online’s strategy, future operations and target addressable market, financial position, estimated revenues and losses, projected costs, prospects and plans . These forward - looking statements are based on information available as of the date of this document and current expectations, forecasts and assumptions, and involve a number of judgments, risks and uncertainties . Accordingly, forward - looking statements should not be relied upon as representing Codere Online’s or its management team’s views as of any subsequent date, and Codere Online does not undertake any obligation to update forward - looking statements to reflect events or circumstances after the date they were made, whether as a result of new information, future events or otherwise, except as may be required under applicable securities laws . As a result of a number of known and unknown risks and uncertainties, Codere Online’s actual results or performance may be materially different from those expressed or implied by these forward - looking statements . There may be additional risks that Codere Online does not presently know or that Codere Online currently believes are immaterial that could also cause actual results to differ from those contained in the forward - looking statements . Some factors that could cause actual results to differ include ( i ) changes in applicable laws or regulations, including online gaming, privacy, data use and data protection rules and regulations as well as consumers’ heightened expectations regarding proper safeguarding of their personal information, (ii) the impacts and ongoing uncertainties created by regulatory restrictions, changes in perceptions of the gaming industry, changes in policies and increased competition, and geopolitical events such as war, (iii) the ability to implement business plans, forecasts, and other expectations and identify and realize additional opportunities, (iv) the risk of downturns and the possibility of rapid change in the highly competitive industry in which Codere Online operates, (v) the risk that Codere Online and its current and future collaborators are unable to successfully develop and commercialize Codere Online’s services, or experience significant delays in doing so, (vi) the risk that Codere Online may never achieve or sustain profitability, (vii) the risk that Codere Online will need to raise additional capital to execute its business plan, which may not be available on acceptable terms or at all, (viii) the risk that Codere Online experiences difficulties in managing its growth and expanding operations, (ix) the risk that third - party providers, including the Codere Group, are not able to fully and timely meet their obligations, (x) the risk that the online gaming operations will not provide the expected benefits due to, among other things, the inability to obtain or maintain online gaming licenses in the anticipated time frame or at all, (xi) the risk that Codere Online is unable to secure or protect its intellectual property, (xii) the risk that Codere Online’s securities may be delisted from Nasdaq and (xiii) the possibility that Codere Online may be adversely affected by other political, economic, business, and/or competitive factors . Additional information concerning certain of these and other risk factors is contained in Codere Online’s filings with the U . S . Securities and Exchange Commission (the “SEC”) . All subsequent forward - looking statements concerning Codere Online or other matters and attributable to Codere Online or any person acting on their behalf are expressly qualified in their entirety by the cautionary statements above . No Offer or Solicitation This Presentation does not constitute an offer to sell or the solicitation of an offer to buy any securities, nor will there be any sale of securities in any states or jurisdictions in which such offer, solicitation or sale would be unlawful prior to registration or qualification under the securities laws of any such jurisdiction . No offering of securities will be made except by means of a prospectus meeting the requirements of section 10 of the Securities Act of 1933 , as amended, or an exemption therefrom . Trademarks This Presentation may contain trademarks, service marks, trade names and copyrights of Codere Online or other companies, which are the property of their respective owners . Solely for convenience, some of the trademarks, service marks, trade names and copyrights referred to in this Presentation may be listed without the TM, SM, © or ® symbols, but Codere Online will assert, to the fullest extent under applicable law, the rights of the applicable owners, if any, to these trademarks, service marks, trade names and copyrights .

Disclaimer (cont.) Financial Information and non - IFRS Financial Measures Codere Online’s financial statements are prepared in accordance with International Financial Reporting Standards as issued by the International Accounting Standards Board (“IFRS”), which can differ in certain significant respects from generally accepted accounting principles in the United States of America (“U . S . GAAP”) . This Presentation includes certain financial measures not presented in accordance with U . S . GAAP or IFRS (“non - IFRS”), such as, without limitation, net gaming revenue, Adj . EBITDA or EBITDA and constant currency figures . These non - IFRS financial measures are not measures of financial performance in accordance with U . S . GAAP or IFRS and may exclude items that are significant in understanding and assessing Codere Online’s financial results . Therefore, these measures should not be considered in isolation or as an alternative to revenue, net income, cash flows from operations or other measures of profitability, liquidity or performance under U . S . GAAP or IFRS . You should be aware that Codere Online’s presentation of these measures may not be comparable to similarly - titled measures used by other companies . In addition, the audit of Codere Online’s financial statements in accordance with PCAOB standards, may impact how Codere Online currently calculates its non - IFRS financial measures, and we cannot assure you that there would not be differences, and such differences could be material . Codere Online believes that the use of these non - IFRS financial measures provides an additional tool for investors to use in evaluating ongoing operating results and trends in comparing Codere Online’s financial measures with other similar companies, many of which present similar non - IFRS financial measures to investors . These non - IFRS financial measures are subject to inherent limitations as they reflect the exercise of judgments by management about which expense and income are excluded or included in determining these non - IFRS financial measures . Reconciliations of non - IFRS financial measures to their most directly comparable measure under IFRS are included herein . This presentation may include certain projections of non - IFRS financial measures . Codere Online is unable to quantify certain amounts that would be required to be included in the most directly comparable U . S . GAAP or IFRS financial measures without unreasonable effort, due to the inherent difficulty and variability of accurately forecasting the occurrence and financial impact of the various adjusting items necessary for such comparable measures or such reconciliation that have not yet occurred, are out of our control, or cannot be reasonably predicted, ascertained or assessed, which could have a material impact on its future IFRS financial results . Consequently, no disclosure or reconciliation of estimated comparable U . S . GAAP or IFRS forward looking statements is included . Use of Projections This Presentation contains financial forecasts with respect to Codere Online’s business and projected financial results, including net gaming revenue and Adjusted EBITDA . Codere Online’s independent auditors have not audited, reviewed, compiled or performed any procedures with respect to the projections for the purpose of their inclusion in this Presentation, and accordingly, they did not express an opinion or provide any other form of assurance with respect thereto for the purpose of this Presentation . These projections should not be relied upon as being necessarily indicative of future results . The assumptions and estimates underlying the prospective financial information are inherently uncertain and are subject to a wide variety of significant business, economic and competitive risks and uncertainties that could cause actual results to differ materially from those contained in the prospective financial information . See “Forward - Looking Statements” above . Accordingly, there can be no assurance that the prospective results are indicative of the future performance of Codere Online or that actual results will not differ materially from those presented in the prospective financial information . Inclusion of the prospective financial information in this Presentation should not be regarded as a representation by any person that the results contained in the prospective financial information will be achieved . For further information on the limitations and assumptions underlying these projections, please refer to Codere Online’s filings with the SEC . Preliminary Information This Presentation contains figures, financial metrics, statistics and other information that is preliminary and subject to change (the “Preliminary Information”) . The Preliminary Information has not been audited, reviewed, or compiled by any independent registered public accounting firm . This Preliminary Information is subject to ongoing review including, where applicable, by Codere Online's independent auditors . Accordingly, no independent registered public accounting firm has expressed an opinion or any other form of assurance with respect to the Preliminary Information . During the course of finalizing such Preliminary Information, adjustments to such Preliminary Information presented herein may be identified, which may be material . Codere Online undertakes no obligation to update or revise the Preliminary Information set forth in this Presentation as a result of new information, future events or otherwise, except as otherwise required by law . The Preliminary Information may differ from actual results . Therefore, you should not place undue reliance upon this Preliminary Information . The Preliminary Information is not a comprehensive statement of financial results, and should not be viewed as a substitute for full financial statements prepared in accordance with IFRS . In addition, the Preliminary Information is not necessarily indicative of the results to be achieved in any future period . Industry and Market Data In this Presentation, Codere Online relies on and refers to certain information and statistics obtained from publicly available information and third - party sources, which it believes to be reliable . Codere Online has not independently verified the accuracy or completeness of any such publicly - available and third - party information, does not make any representation as to the accuracy or completeness of such data and does not undertake any obligation to update such data after the date of this Presentation . You are cautioned not to give undue weight to such industry and market data .

Aviv Sher CEO Today’s Presenters Oscar Iglesias CFO
1 Corporate Overview 2 Financial Results ( Preliminary Unaudited ) 3 2025 Outlook 4 Appendix Table of Contents 7 10 19 22

1 Corporate Overview
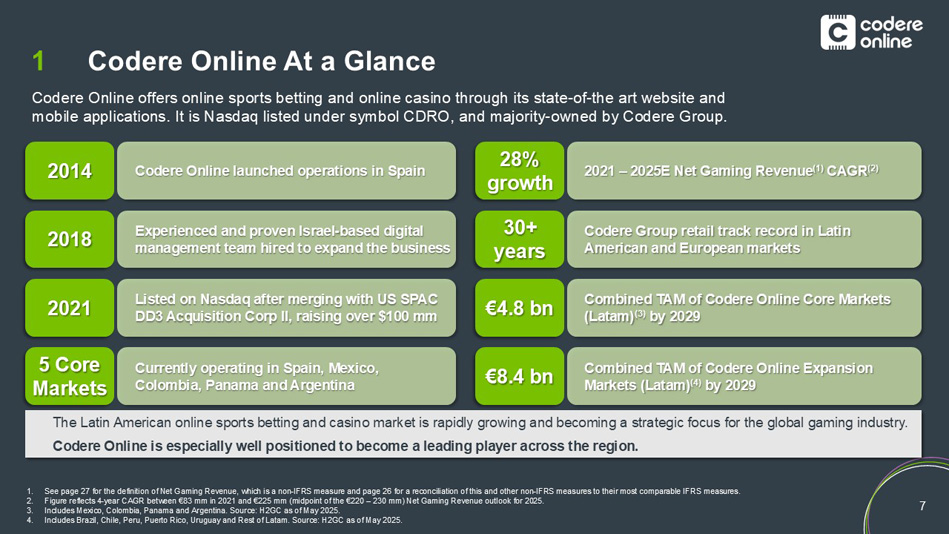
7 Codere Online At a Glance 1 Codere Online offers online sports betting and online casino through its state - of - the art website and mobile applications. It is Nasdaq listed under symbol CDRO, and majority - owned by Codere Group. Codere Online launched operations in Spain Listed on Nasdaq after merging with US SPAC DD3 Acquisition Corp II, raising over $100 mm Currently operating in Spain, Mexico, Colombia, Panama and Argentina Experienced and proven Israel - based digital management team hired to expand the business 2014 2021 5 Core Markets 2018 28% growth €4.8 bn 30+ years €8.4 bn The Latin American online sports betting and casino market is rapidly growing and becoming a strategic focus for the global g ami ng industry. Codere Online is especially well positioned to become a leading player across the region. 1. See page 27 for the definition of Net Gaming Revenue, which is a non - IFRS measure and page 26 for a reconciliation of this and o ther non - IFRS measures to their most comparable IFRS measures. 2. Figure reflects 4 - year CAGR between €83 mm in 2021 and €225 mm (midpoint of the €220 – 230 mm) Net Gaming Revenue outlook for 20 25. 3. Includes Mexico, Colombia, Panama and Argentina. Source: H2GC as of May 2025. 4. Includes Brazil, Chile, Peru, Puerto Rico, Uruguay and Rest of Latam . Source: H2GC as of May 2025. 2021 – 2025E Net Gaming Revenue (1) CAGR (2) Combined TAM of Codere Online Core Markets (Latam) (3) by 2029 Codere Group retail track record in Latin American and European markets Combined TAM of Codere Online Expansion Markets (Latam) (4) by 2029
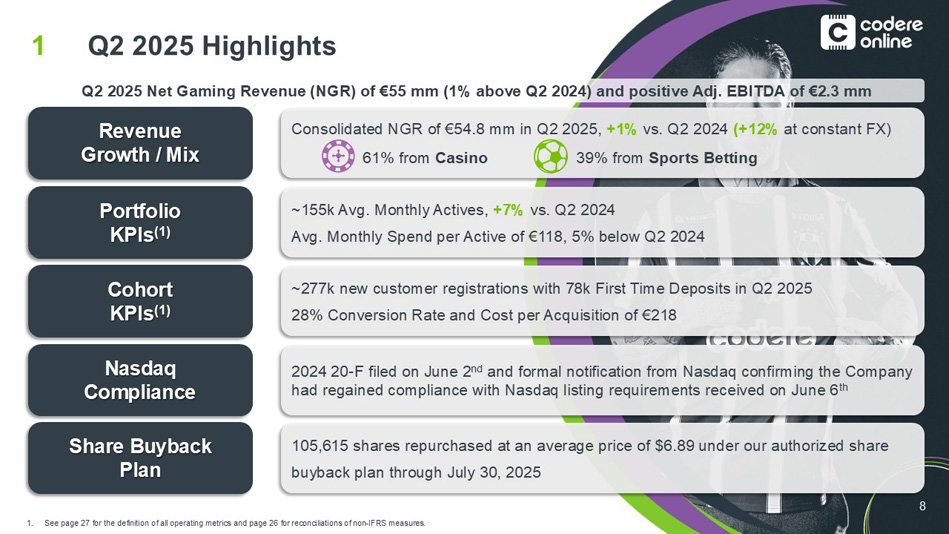
8 Q2 2025 Highlights 1 1. See page 27 for the definition of all operating metrics and page 26 for reconciliations of non - IFRS measures. Revenue Growth / Mix Portfolio KPIs (1) Cohort KPIs (1) Nasdaq Compliance Consolidated NGR of €54.8 mm in Q2 2025, +1% vs. Q2 2024 (+12% at constant FX) 61% from Casino 39% from Sports Betting ~155k Avg. Monthly Actives, +7% vs. Q2 2024 Avg. Monthly Spend per Active of €118, 5% below Q2 2024 ~277k new customer registrations with 78k First Time Deposits in Q2 2025 28% Conversion Rate and Cost per Acquisition of €218 2024 20 - F filed on June 2 nd and formal notification from Nasdaq confirming the Company had regained compliance with Nasdaq listing requirements received on June 6 th Share Buyback Plan 105,615 shares repurchased at an average price of $6.89 under our authorized share buyback plan through July 30, 2025 Q2 2025 Net Gaming Revenue (NGR) of €55 mm (1% above Q2 2024) and positive Adj. EBITDA of €2.3 mm

2 Financial Results ( Preliminary Unaudited 1 ) 1. See "Preliminary Information" disclaimer on slide 3.
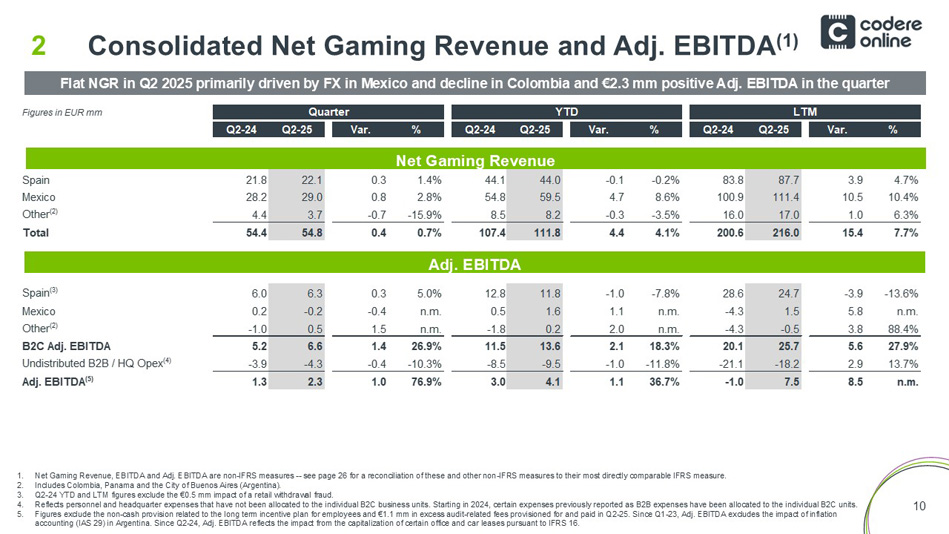
10 Adj. EBITDA Consolidated Net Gaming Revenue and Adj. EBITDA (1) 2 Flat NGR in Q2 2025 primarily driven by FX in Mexico and decline in Colombia and €2.3 mm positive Adj. EBITDA in the quarter Net Gaming Revenue 1. Net Gaming Revenue, EBITDA and Adj. EBITDA are non - IFRS measures -- see page 26 for a reconciliation of these and other non - IFRS measures to their most directly comparable IFRS measure. 2. Includes Colombia, Panama and the City of Buenos Aires (Argentina). 3. Q2 - 24 YTD and LTM figures exclude the €0.5 mm impact of a retail withdrawal fraud. 4. Reflects personnel and headquarter expenses that have not been allocated to the individual B2C business units. Starting in 20 24, certain expenses previously reported as B2B expenses have been allocated to the individual B2C units. 5. Figures exclude the non - cash provision related to the long term incentive plan for employees and €1.1 mm in excess audit - related fees provisioned for and paid in Q2 - 25. Since Q1 - 23, Adj. EBITDA excludes the impact of inflation accounting (IAS 29) in Argentina. Since Q2 - 24, Adj. EBITDA reflects the impact from the capitalization of certain office and car leases pursuant to IFRS 16. Figures in EUR mm Quarter YTD LTM Q2-24 Q2-25 Var. % Q2-24 Q2-25 Var. % Q2-24 Q2-25 Var. % Spain 21.8 22.1 0.3 1.4% 44.1 44.0 -0.1 -0.2% 83.8 87.7 3.9 4.7% Mexico 28.2 29.0 0.8 2.8% 54.8 59.5 4.7 8.6% 100.9 111.4 10.5 10.4% Other (2) 4.4 3.7 -0.7 -15.9% 8.5 8.2 -0.3 -3.5% 16.0 17.0 1.0 6.3% Total 54.4 54.8 0.4 0.7% 107.4 111.8 4.4 4.1% 200.6 216.0 15.4 7.7% Spain (3) 6.0 6.3 0.3 5.0% 12.8 11.8 -1.0 -7.8% 28.6 24.7 -3.9 -13.6% Mexico 0.2 -0.2 -0.4 n.m. 0.5 1.6 1.1 n.m. -4.3 1.5 5.8 n.m. Other (2) -1.0 0.5 1.5 n.m. -1.8 0.2 2.0 n.m. -4.3 -0.5 3.8 88.4% B2C Adj. EBITDA 5.2 6.6 1.4 26.9% 11.5 13.6 2.1 18.3% 20.1 25.7 5.6 27.9% Undistributed B2B / HQ Opex (4) -3.9 -4.3 -0.4 -10.3% -8.5 -9.5 -1.0 -11.8% -21.1 -18.2 2.9 13.7% Adj. EBITDA (5) 1.3 2.3 1.0 76.9% 3.0 4.1 1.1 36.7% -1.0 7.5 8.5 n.m.
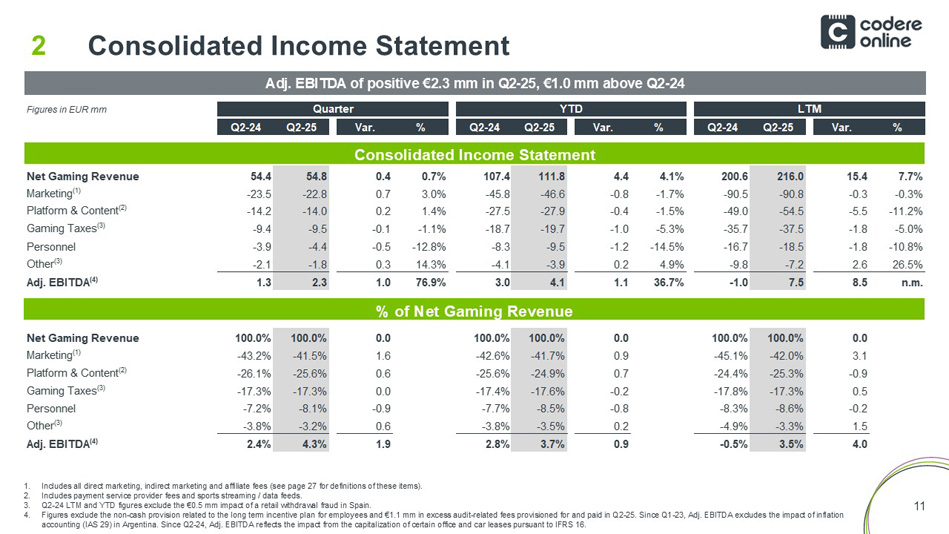
11 Consolidated Income Statement 2 Adj. EBITDA of positive €2.3 mm in Q2 - 25, €1.0 mm above Q2 - 24 Consolidated Income Statement % of Net Gaming Revenue 1. Includes all direct marketing, indirect marketing and affiliate fees (see page 27 for definitions of these items). 2. Includes payment service provider fees and sports streaming / data feeds. 3. Q2 - 24 LTM and YTD figures exclude the €0.5 mm impact of a retail withdrawal fraud in Spain. 4. Figures exclude the non - cash provision related to the long term incentive plan for employees and €1.1 mm in excess audit - related fees provisioned for and paid in Q2 - 25. Since Q1 - 23, Adj. EBITDA excludes the impact of inflation accounting (IAS 29) in Argentina. Since Q2 - 24, Adj. EBITDA reflects the impact from the capitalization of certain office and car leases pursuant to IFRS 16. Figures in EUR mm Quarter YTD LTM Q2-24 Q2-25 Var. % Q2-24 Q2-25 Var. % Q2-24 Q2-25 Var. % Net Gaming Revenue 54.4 54.8 0.4 0.7% 107.4 111.8 4.4 4.1% 200.6 216.0 15.4 7.7% Marketing (1) -23.5 -22.8 0.7 3.0% -45.8 -46.6 -0.8 -1.7% -90.5 -90.8 -0.3 -0.3% Platform & Content (2) -14.2 -14.0 0.2 1.4% -27.5 -27.9 -0.4 -1.5% -49.0 -54.5 -5.5 -11.2% Gaming Taxes (3) -9.4 -9.5 -0.1 -1.1% -18.7 -19.7 -1.0 -5.3% -35.7 -37.5 -1.8 -5.0% Personnel -3.9 -4.4 -0.5 -12.8% -8.3 -9.5 -1.2 -14.5% -16.7 -18.5 -1.8 -10.8% Other (3) -2.1 -1.8 0.3 14.3% -4.1 -3.9 0.2 4.9% -9.8 -7.2 2.6 26.5% Adj. EBITDA (4) 1.3 2.3 1.0 76.9% 3.0 4.1 1.1 36.7% -1.0 7.5 8.5 n.m. Net Gaming Revenue 100.0% 100.0% 0.0 100.0% 100.0% 0.0 100.0% 100.0% 0.0 Marketing (1) -43.2% -41.5% 1.6 -42.6% -41.7% 0.9 -45.1% -42.0% 3.1 Platform & Content (2) -26.1% -25.6% 0.6 -25.6% -24.9% 0.7 -24.4% -25.3% -0.9 Gaming Taxes (3) -17.3% -17.3% 0.0 -17.4% -17.6% -0.2 -17.8% -17.3% 0.5 Personnel -7.2% -8.1% -0.9 -7.7% -8.5% -0.8 -8.3% -8.6% -0.2 Other (3) -3.8% -3.2% 0.6 -3.8% -3.5% 0.2 -4.9% -3.3% 1.5 Adj. EBITDA (4) 2.4% 4.3% 1.9 2.8% 3.7% 0.9 -0.5% 3.5% 4.0
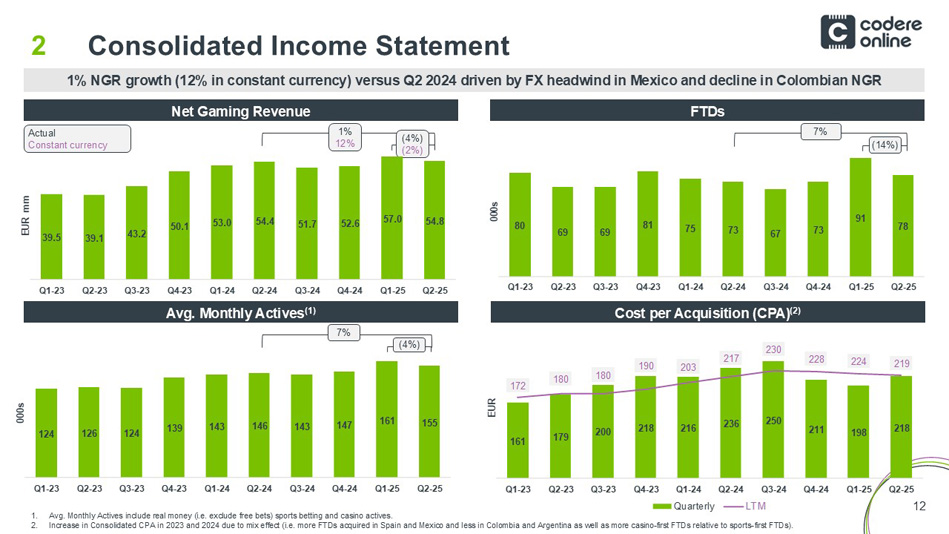
12 80 69 69 81 75 73 67 73 91 78 Q1-23 Q2-23 Q3-23 Q4-23 Q1-24 Q2-24 Q3-24 Q4-24 Q1-25 Q2-25 000s Consolidated Income Statement 2 1. Avg. Monthly Actives include real money (i.e. exclude free bets) sports betting and casino actives. 2. Increase in Consolidated CPA in 2023 and 2024 due to mix effect (i.e. more FTDs acquired in Spain and Mexico and less in Colo mbi a and Argentina as well as more casino - first FTDs relative to sports - first FTDs). Net Gaming Revenue FTDs Cost per Acquisition (CPA) (2) Avg. Monthly Actives (1) 1% NGR growth (12% in constant currency) versus Q2 2024 driven by FX headwind in Mexico and decline in Colombian NGR 1% 12% (4%) (2%) 7% (4%) 7% (14%) Actual Constant currency 124 126 124 139 143 146 143 147 161 155 Q1-23 Q2-23 Q3-23 Q4-23 Q1-24 Q2-24 Q3-24 Q4-24 Q1-25 Q2-25 000s 161 179 200 218 216 236 250 211 198 218 172 180 180 190 203 217 230 228 224 219 Q1-23 Q2-23 Q3-23 Q4-23 Q1-24 Q2-24 Q3-24 Q4-24 Q1-25 Q2-25 EUR Quarterly LTM 39.5 39.1 43.2 50.1 53.0 54.4 51.7 52.6 57.0 54.8 Q1-23 Q2-23 Q3-23 Q4-23 Q1-24 Q2-24 Q3-24 Q4-24 Q1-25 Q2-25 EUR mm
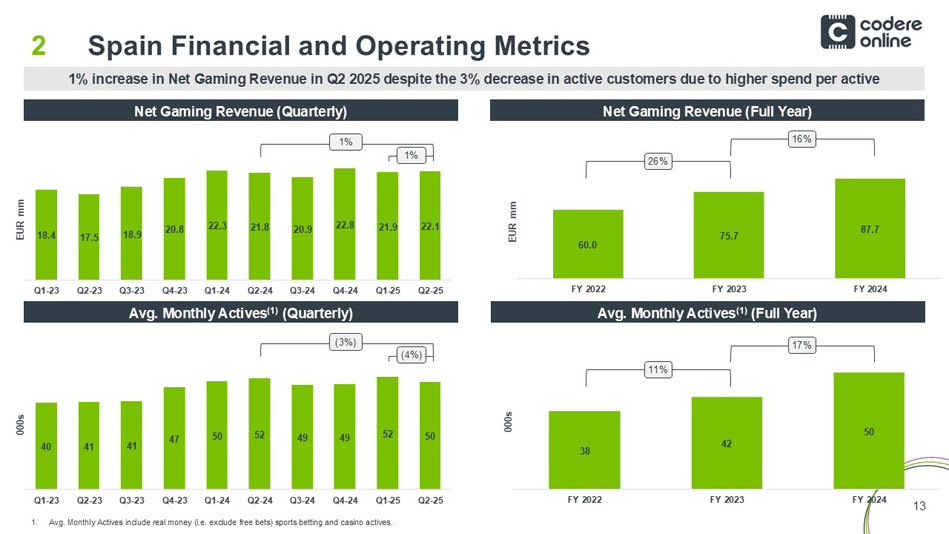
13 18.4 17.5 18.9 20.8 22.3 21.8 20.9 22.8 21.9 22.1 Q1-23 Q2-23 Q3-23 Q4-23 Q1-24 Q2-24 Q3-24 Q4-24 Q1-25 Q2-25 EUR mm 60.0 75.7 87.7 FY 2022 FY 2023 FY 2024 EUR mm Spain Financial and Operating Metrics 2 1% increase in Net Gaming Revenue in Q2 2025 despite the 3% decrease in active customers due to higher spend per active 1. Avg. Monthly Actives include real money (i.e. exclude free bets) sports betting and casino actives. Net Gaming Revenue (Quarterly) Net Gaming Revenue (Full Year) Avg. Monthly Actives (1) (Full Year) Avg. Monthly Actives (1) (Quarterly) 38 42 50 FY 2022 FY 2023 FY 2024 000s 11% 26% 1% 1% (3%) (4%) 16% 17% 40 41 41 47 50 52 49 49 52 50 Q1-23 Q2-23 Q3-23 Q4-23 Q1-24 Q2-24 Q3-24 Q4-24 Q1-25 Q2-25 000s
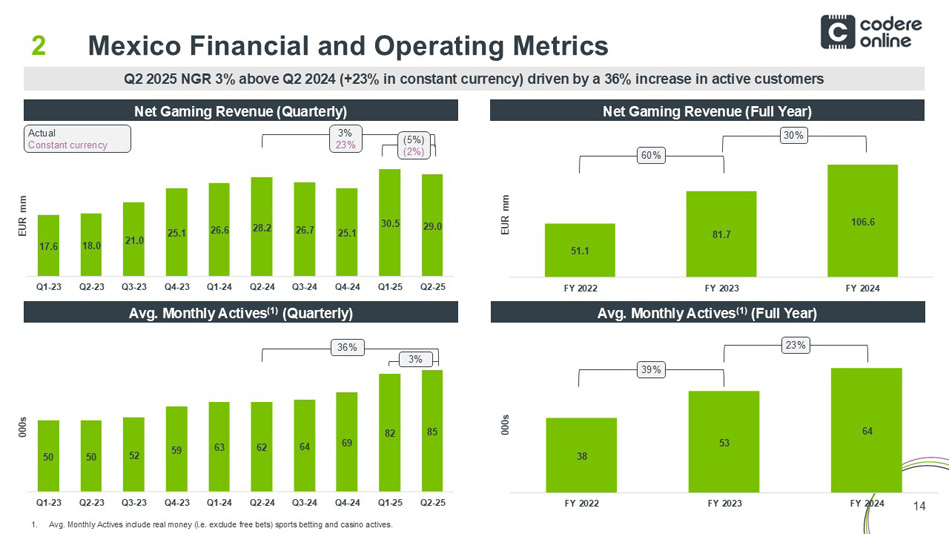
14 17.6 18.0 21.0 25.1 26.6 28.2 26.7 25.1 30.5 29.0 Q1-23 Q2-23 Q3-23 Q4-23 Q1-24 Q2-24 Q3-24 Q4-24 Q1-25 Q2-25 EUR mm 38 53 64 FY 2022 FY 2023 FY 2024 000s Mexico Financial and Operating Metrics 2 Q2 2025 NGR 3% above Q2 2024 (+23% in constant currency) driven by a 36% increase in active customers 51.1 81.7 106.6 FY 2022 FY 2023 FY 2024 EUR mm 1. Avg. Monthly Actives include real money (i.e. exclude free bets) sports betting and casino actives. Net Gaming Revenue (Quarterly) Net Gaming Revenue (Full Year) Avg. Monthly Actives (1) (Full Year) Avg. Monthly Actives (1) (Quarterly) 39% 60% Actual Constant currency 3% 23% (5%) (2%) 36% 3% 30% 23% 50 50 52 59 63 62 64 69 82 85 Q1-23 Q2-23 Q3-23 Q4-23 Q1-24 Q2-24 Q3-24 Q4-24 Q1-25 Q2-25 000s
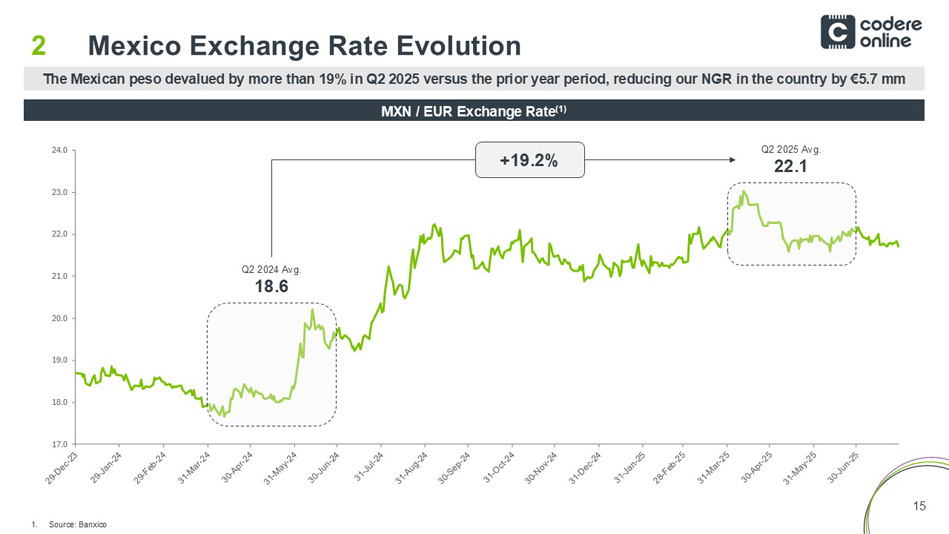
15 17.0 18.0 19.0 20.0 21.0 22.0 23.0 24.0 Mexico Exchange Rate Evolution 2 The Mexican peso devalued by more than 19% in Q2 2025 versus the prior year period, reducing our NGR in the country by €5.7 m m 1. Source: Banxico MXN / EUR Exchange Rate (1) +19.2% Q2 2024 Avg . 18.6 Q2 2025 Avg . 22.1
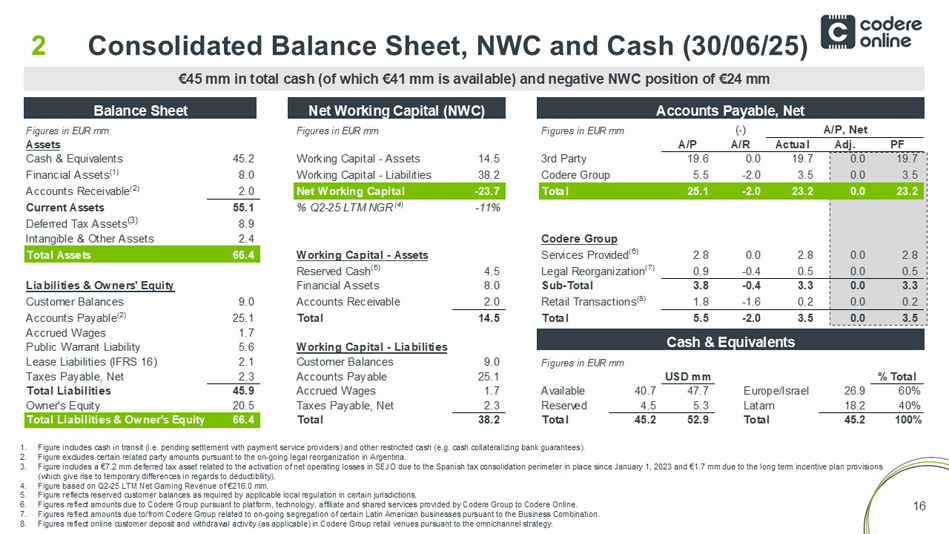
16 Figures in EUR mm Figures in EUR mm Figures in EUR mm (-) A/P, Net Assets A/P A/R Actual Adj. PF Cash & Equivalents 45.2 Working Capital - Assets 14.5 3rd Party 19.6 0.0 19.7 0.0 19.7 Financial Assets (1) 8.0 Working Capital - Liabilities 38.2 Codere Group 5.5 -2.0 3.5 0.0 3.5 Accounts Receivable (2) 2.0 Net Working Capital -23.7 Total 25.1 -2.0 23.2 0.0 23.2 Current Assets 55.1 % Q2-25 LTM NGR (4) -11% Deferred Tax Assets (3) 8.9 Intangible & Other Assets 2.4 Codere Group Total Assets 66.4 Working Capital - Assets Services Provided (6) 2.8 0.0 2.8 0.0 2.8 Reserved Cash (5) 4.5 Legal Reorganization (7) 0.9 -0.4 0.5 0.0 0.5 Liabilities & Owners' Equity Financial Assets 8.0 Sub-Total 3.8 -0.4 3.3 0.0 3.3 Customer Balances 9.0 Accounts Receivable 2.0 Retail Transactions (8) 1.8 -1.6 0.2 0.0 0.2 Accounts Payable (2) 25.1 Total 14.5 Total 5.5 -2.0 3.5 0.0 3.5 Accrued Wages 1.7 Public Warrant Liability 5.6 Working Capital - Liabilities Lease Liabilities (IFRS 16) 2.1 Customer Balances 9.0 Figures in EUR mm Taxes Payable, Net 2.3 Accounts Payable 25.1 USD mm % Total Total Liabilities 45.9 Accrued Wages 1.7 Available 40.7 47.7 Europe/Israel 26.9 60% Owner's Equity 20.5 Taxes Payable, Net 2.3 Reserved 4.5 5.3 Latam 18.2 40% Total Liabilities & Owner's Equity 66.4 Total 38.2 Total 45.2 52.9 Total 45.2 100% Consolidated Balance Sheet, NWC and Cash (30/06/25) 2 Balance Sheet Net Working Capital (NWC) Accounts Payable, Net Cash & Equivalents 1. Figure includes cash in transit (i.e. pending settlement with payment service providers) and other restricted cash (e.g. cash co llateralizing bank guarantees). 2. Figure excludes certain related party amounts pursuant to the on - going legal reorganization in Argentina. 3. Figure includes a €7.2 mm deferred tax asset related to the activation of net operating losses in SEJO due to the Spanish tax co nsolidation perimeter in place since January 1, 2023 and €1.7 mm due to the long term incentive plan provisions (which give rise to temporary differences in regards to deductibility). 4. Figure based on Q2 - 25 LTM Net Gaming Revenue of €216.0 mm. 5. Figure reflects reserved customer balances as required by applicable local regulation in certain jurisdictions. 6. Figures reflect amounts due to Codere Group pursuant to platform, technology, affiliate and shared services provided by Coder e G roup to Codere Online. 7. Figures reflect amounts due to/from Codere Group related to on - going segregation of certain Latin American businesses pursuant t o the Business Combination. 8. Figures reflect online customer deposit and withdrawal activity (as applicable) in Codere Group retail venues pursuant to the om nichannel strategy. €45 mm in total cash (of which €41 mm is available) and negative NWC position of €24 mm
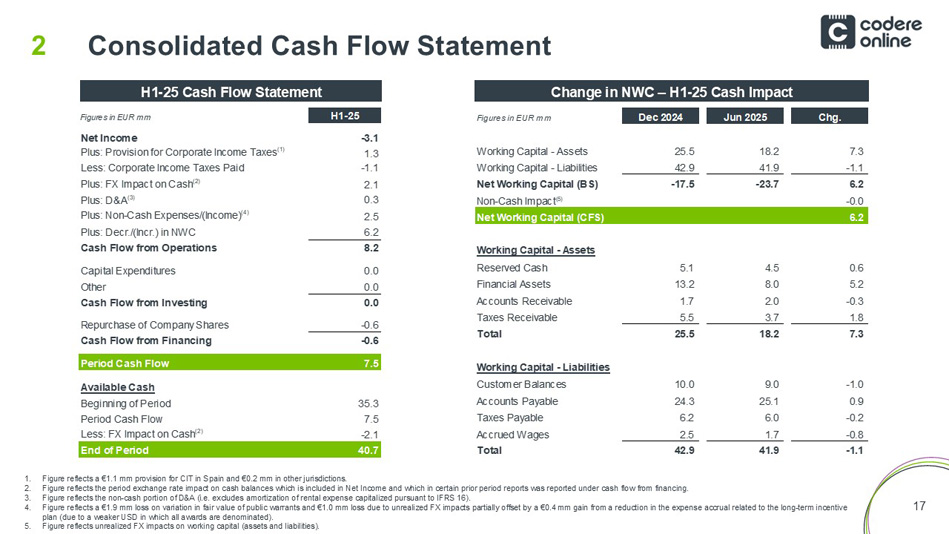
17 Consolidated Cash Flow Statement 2 H1 - 25 Cash Flow Statement Change in NWC – H1 - 25 Cash Impact 1. Figure reflects a €1.1 mm provision for CIT in Spain and €0.2 mm in other jurisdictions. 2. Figure reflects the period exchange rate impact on cash balances which is included in Net Income and which in certain prior p eri od reports was reported under cash flow from financing. 3. Figure reflects the non - cash portion of D&A (i.e. excludes amortization of rental expense capitalized pursuant to IFRS 16). 4. Figure reflects a €1.9 mm loss on variation in fair value of public warrants and €1.0 mm loss due to unrealized FX impacts pa rti ally offset by a €0.4 ௗ mm gain from a reduction in the expense accrual related to the long - term incentive plan (due to a weaker USD in which all awards are denominated). 5. Figure reflects unrealized FX impacts on working capital (assets and liabilities). Figures in EUR mm H1-25 Net Income -3.1 Plus: Provision for Corporate Income Taxes (1) 1.3 Less: Corporate Income Taxes Paid -1.1 Plus: FX Impact on Cash (2) 2.1 Plus: D&A (3) 0.3 Plus: Non-Cash Expenses/(Income) (4) 2.5 Plus: Decr./(Incr.) in NWC 6.2 Cash Flow from Operations 8.2 Capital Expenditures 0.0 Other 0.0 Cash Flow from Investing 0.0 Repurchase of Company Shares -0.6 Cash Flow from Financing -0.6 Period Cash Flow 7.5 Available Cash Beginning of Period 35.3 Period Cash Flow 7.5 Less: FX Impact on Cash (2) -2.1 End of Period 40.7 Figures in EUR mm Dec 2024 Jun 2025 Chg. Working Capital - Assets 25.5 18.2 7.3 Working Capital - Liabilities 42.9 41.9 -1.1 Net Working Capital (BS) -17.5 -23.7 6.2 Non-Cash Impact(5) -0.0 Net Working Capital (CFS) 6.2 Working Capital - Assets Reserved Cash 5.1 4.5 0.6 Financial Assets 13.2 8.0 5.2 Accounts Receivable 1.7 2.0 -0.3 Taxes Receivable 5.5 3.7 1.8 Total 25.5 18.2 7.3 Working Capital - Liabilities Customer Balances 10.0 9.0 -1.0 Accounts Payable 24.3 25.1 0.9 Taxes Payable 6.2 6.0 -0.2 Accrued Wages 2.5 1.7 -0.8 Total 42.9 41.9 -1.1

3 2025 Outlook
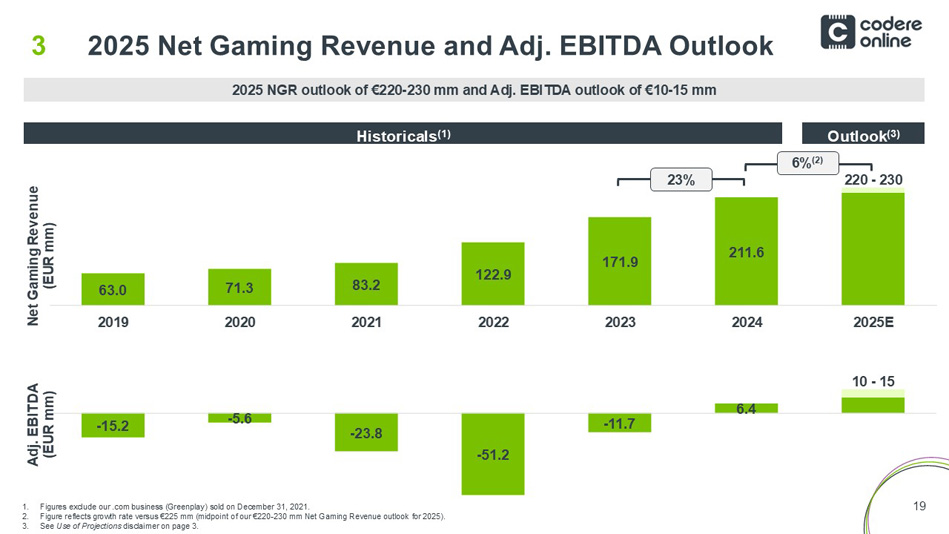
19 63.0 71.3 83.2 122.9 171.9 211.6 2019 2020 2021 2022 2023 2024 2025E Net Gaming Revenue (EUR mm) - 15.2 - 5.6 - 23.8 - 51.2 - 11.7 6.4 Adj. EBITDA (EUR mm) 2025 Net Gaming Revenue and Adj. EBITDA Outlook 3 2025 NGR outlook of €220 - 230 mm and Adj. EBITDA outlook of €10 - 15 mm Outlook (3) Historicals (1) 1. Figures exclude our .com business ( Greenplay ) sold on December 31, 2021. 2. Figure reflects growth rate versus €225 mm (midpoint of our €220 - 230 mm Net Gaming Revenue outlook for 2025). 3. See Use of Projections disclaimer on page 3. 23% 6% (2) 220 - 230 10 - 15

Q&A

4 Appendix
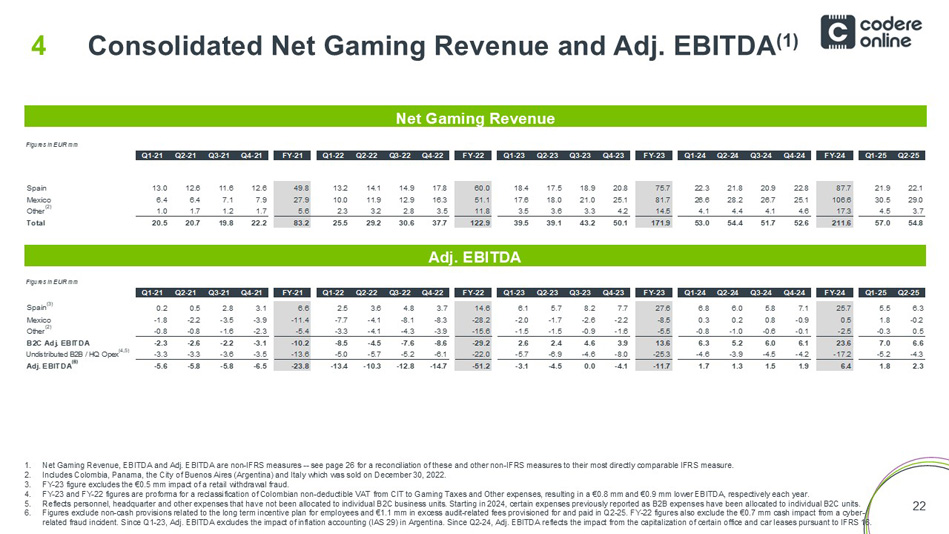
22 Consolidated Net Gaming Revenue and Adj. EBITDA (1) 4 Net Gaming Revenue Adj. EBITDA 1. Net Gaming Revenue, EBITDA and Adj. EBITDA are non - IFRS measures -- see page 26 for a reconciliation of these and other non - IFRS measures to their most directly comparable IFRS measure. 2. Includes Colombia, Panama, the City of Buenos Aires (Argentina) and Italy which was sold on December 30, 2022. 3. FY - 23 figure excludes the €0.5 mm impact of a retail withdrawal fraud. 4. FY - 23 and FY - 22 figures are proforma for a reclassification of Colombian non - deductible VAT from CIT to Gaming Taxes and Other expenses, resulting in a €0.8 mm and €0.9 mm lower EBITDA, respectively each year. 5. Reflects personnel, headquarter and other expenses that have not been allocated to individual B2C business units. Starting in 20 24, certain expenses previously reported as B2B expenses have been allocated to individual B2C units. 6. Figures exclude non - cash provisions related to the long term incentive plan for employees and €1.1 mm in excess audit - related fe es provisioned for and paid in Q2 - 25. FY - 22 figures also exclude the €0.7 mm cash impact from a cyber - related fraud incident. Since Q1 - 23, Adj. EBITDA excludes the impact of inflation accounting (IAS 29) in Argentina. Since Q2 - 24, Adj. EBITDA reflects the impact from the capitalization of certain office and car leases pursuant to IFRS 16. Figures in EUR mm Q1-21 Q2-21 Q3-21 Q4-21 FY-21 Q1-22 Q2-22 Q3-22 Q4-22 FY-22 Q1-23 Q2-23 Q3-23 Q4-23 FY-23 Q1-24 Q2-24 Q3-24 Q4-24 FY-24 Q1-25 Q2-25 Spain 13.0 12.6 11.6 12.6 49.8 13.2 14.1 14.9 17.8 60.0 18.4 17.5 18.9 20.8 75.7 22.3 21.8 20.9 22.8 87.7 21.9 22.1 Mexico 6.4 6.4 7.1 7.9 27.9 10.0 11.9 12.9 16.3 51.1 17.6 18.0 21.0 25.1 81.7 26.6 28.2 26.7 25.1 106.6 30.5 29.0 Other (2) 1.0 1.7 1.2 1.7 5.6 2.3 3.2 2.8 3.5 11.8 3.5 3.6 3.3 4.2 14.5 4.1 4.4 4.1 4.6 17.3 4.5 3.7 Total 20.5 20.7 19.8 22.2 83.2 25.5 29.2 30.6 37.7 122.9 39.5 39.1 43.2 50.1 171.9 53.0 54.4 51.7 52.6 211.6 57.0 54.8 Figures in EUR mm Q1-21 Q2-21 Q3-21 Q4-21 FY-21 Q1-22 Q2-22 Q3-22 Q4-22 FY-22 Q1-23 Q2-23 Q3-23 Q4-23 FY-23 Q1-24 Q2-24 Q3-24 Q4-24 FY-24 Q1-25 Q2-25 Spain (3) 0.2 0.5 2.8 3.1 6.6 2.5 3.6 4.8 3.7 14.6 6.1 5.7 8.2 7.7 27.6 6.8 6.0 5.8 7.1 25.7 5.5 6.3 Mexico -1.8 -2.2 -3.5 -3.9 -11.4 -7.7 -4.1 -8.1 -8.3 -28.2 -2.0 -1.7 -2.6 -2.2 -8.5 0.3 0.2 0.8 -0.9 0.5 1.8 -0.2 Other (2) -0.8 -0.8 -1.6 -2.3 -5.4 -3.3 -4.1 -4.3 -3.9 -15.6 -1.5 -1.5 -0.9 -1.6 -5.5 -0.8 -1.0 -0.6 -0.1 -2.5 -0.3 0.5 B2C Adj. EBITDA -2.3 -2.6 -2.2 -3.1 -10.2 -8.5 -4.5 -7.6 -8.6 -29.2 2.6 2.4 4.6 3.9 13.6 6.3 5.2 6.0 6.1 23.6 7.0 6.6 Undistributed B2B / HQ Opex (4,5) -3.3 -3.3 -3.6 -3.5 -13.6 -5.0 -5.7 -5.2 -6.1 -22.0 -5.7 -6.9 -4.6 -8.0 -25.3 -4.6 -3.9 -4.5 -4.2 -17.2 -5.2 -4.3 Adj. EBITDA (6) -5.6 -5.8 -5.8 -6.5 -23.8 -13.4 -10.3 -12.8 -14.7 -51.2 -3.1 -4.5 0.0 -4.1 -11.7 1.7 1.3 1.5 1.9 6.4 1.8 2.3
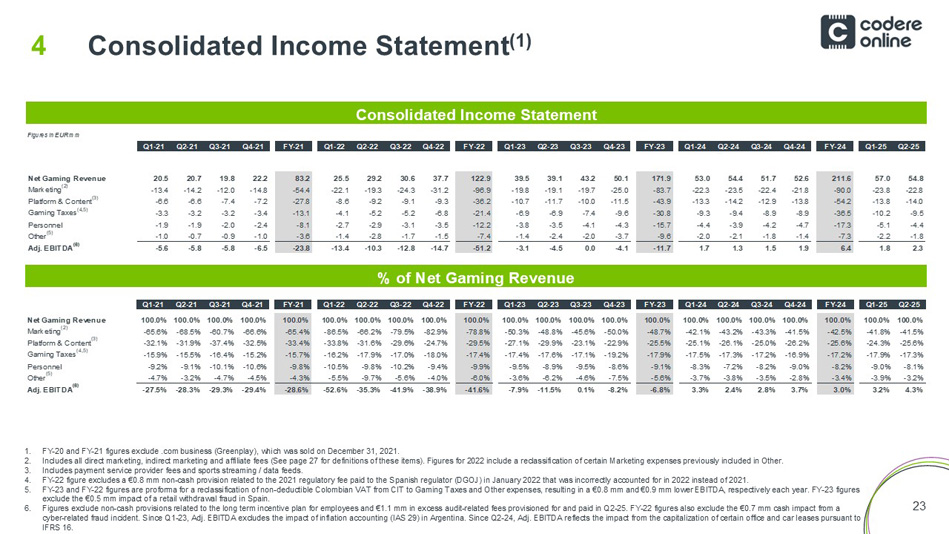
23 Consolidated Income Statement (1) 4 Consolidated Income Statement % of Net Gaming Revenue 1. FY - 20 and FY - 21 figures exclude .com business ( Greenplay ), which was sold on December 31, 2021. 2. Includes all direct marketing, indirect marketing and affiliate fees (See page 27 for definitions of these items). Figures fo r 2 022 include a reclassification of certain Marketing expenses previously included in Other. 3. Includes payment service provider fees and sports streaming / data feeds. 4. FY - 22 figure excludes a €0.8 mm non - cash provision related to the 2021 regulatory fee paid to the Spanish regulator (DGOJ) in Ja nuary 2022 that was incorrectly accounted for in 2022 instead of 2021. 5. FY - 23 and FY - 22 figures are proforma for a reclassification of non - deductible Colombian VAT from CIT to Gaming Taxes and Other expenses, resulting in a €0.8 mm and €0.9 mm lower EBITDA, respectively each year. FY - 23 figures exclude the €0.5 mm impact of a retail withdrawal fraud in Spain. 6. Figures exclude non - cash provisions related to the long term incentive plan for employees and €1.1 mm in excess audit - related fe es provisioned for and paid in Q2 - 25. FY - 22 figures also exclude the €0.7 mm cash impact from a cyber - related fraud incident. Since Q1 - 23, Adj. EBITDA excludes the impact of inflation accounting (IAS 29) in Argentina. Since Q2 - 24, Adj. EBITDA reflects the impact from the capitalization of certain office and car leases pursuant to IFRS 16. Figures in EUR mm Q1-21 Q2-21 Q3-21 Q4-21 FY-21 Q1-22 Q2-22 Q3-22 Q4-22 FY-22 Q1-23 Q2-23 Q3-23 Q4-23 FY-23 Q1-24 Q2-24 Q3-24 Q4-24 FY-24 Q1-25 Q2-25 Net Gaming Revenue 20.5 20.7 19.8 22.2 83.2 25.5 29.2 30.6 37.7 122.9 39.5 39.1 43.2 50.1 171.9 53.0 54.4 51.7 52.6 211.6 57.0 54.8 Marketing (2) -13.4 -14.2 -12.0 -14.8 -54.4 -22.1 -19.3 -24.3 -31.2 -96.9 -19.8 -19.1 -19.7 -25.0 -83.7 -22.3 -23.5 -22.4 -21.8 -90.0 -23.8 -22.8 Platform & Content (3) -6.6 -6.6 -7.4 -7.2 -27.8 -8.6 -9.2 -9.1 -9.3 -36.2 -10.7 -11.7 -10.0 -11.5 -43.9 -13.3 -14.2 -12.9 -13.8 -54.2 -13.8 -14.0 Gaming Taxes (4,5) -3.3 -3.2 -3.2 -3.4 -13.1 -4.1 -5.2 -5.2 -6.8 -21.4 -6.9 -6.9 -7.4 -9.6 -30.8 -9.3 -9.4 -8.9 -8.9 -36.5 -10.2 -9.5 Personnel -1.9 -1.9 -2.0 -2.4 -8.1 -2.7 -2.9 -3.1 -3.5 -12.2 -3.8 -3.5 -4.1 -4.3 -15.7 -4.4 -3.9 -4.2 -4.7 -17.3 -5.1 -4.4 Other (5) -1.0 -0.7 -0.9 -1.0 -3.6 -1.4 -2.8 -1.7 -1.5 -7.4 -1.4 -2.4 -2.0 -3.7 -9.6 -2.0 -2.1 -1.8 -1.4 -7.3 -2.2 -1.8 Adj. EBITDA (6) -5.6 -5.8 -5.8 -6.5 -23.8 -13.4 -10.3 -12.8 -14.7 -51.2 -3.1 -4.5 0.0 -4.1 -11.7 1.7 1.3 1.5 1.9 6.4 1.8 2.3 Q1-21 Q2-21 Q3-21 Q4-21 FY-21 Q1-22 Q2-22 Q3-22 Q4-22 FY-22 Q1-23 Q2-23 Q3-23 Q4-23 FY-23 Q1-24 Q2-24 Q3-24 Q4-24 FY-24 Q1-25 Q2-25 Net Gaming Revenue 100.0% 100.0% 100.0% 100.0% 100.0% 100.0% 100.0% 100.0% 100.0% 100.0% 100.0% 100.0% 100.0% 100.0% 100.0% 100.0% 100.0% 100.0% 100.0% 100.0% 100.0% 100.0% Marketing (2) -65.6% -68.5% -60.7% -66.6% -65.4% -86.5% -66.2% -79.5% -82.9% -78.8% -50.3% -48.8% -45.6% -50.0% -48.7% -42.1% -43.2% -43.3% -41.5% -42.5% -41.8% -41.5% Platform & Content (3) -32.1% -31.9% -37.4% -32.5% -33.4% -33.8% -31.6% -29.6% -24.7% -29.5% -27.1% -29.9% -23.1% -22.9% -25.5% -25.1% -26.1% -25.0% -26.2% -25.6% -24.3% -25.6% Gaming Taxes (4,5) -15.9% -15.5% -16.4% -15.2% -15.7% -16.2% -17.9% -17.0% -18.0% -17.4% -17.4% -17.6% -17.1% -19.2% -17.9% -17.5% -17.3% -17.2% -16.9% -17.2% -17.9% -17.3% Personnel -9.2% -9.1% -10.1% -10.6% -9.8% -10.5% -9.8% -10.2% -9.4% -9.9% -9.5% -8.9% -9.5% -8.6% -9.1% -8.3% -7.2% -8.2% -9.0% -8.2% -9.0% -8.1% Other (5) -4.7% -3.2% -4.7% -4.5% -4.3% -5.5% -9.7% -5.6% -4.0% -6.0% -3.6% -6.2% -4.6% -7.5% -5.6% -3.7% -3.8% -3.5% -2.8% -3.4% -3.9% -3.2% Adj. EBITDA (6) -27.5% -28.3% -29.3% -29.4% -28.6% -52.6% -35.3% -41.9% -38.9% -41.6% -7.9% -11.5% 0.1% -8.2% -6.8% 3.3% 2.4% 2.8% 3.7% 3.0% 3.2% 4.3%
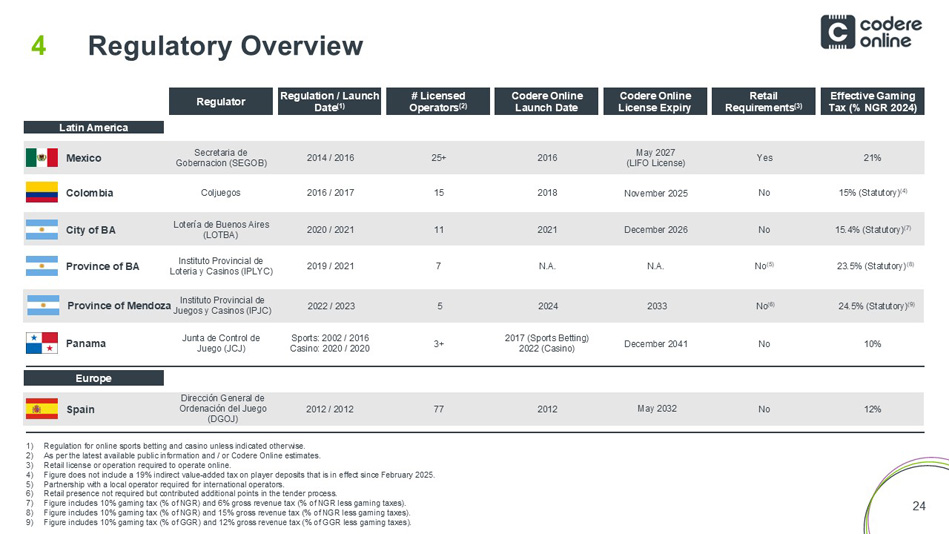
24 Regulatory Overview 4 Latin America Mexico Colombia City of BA Province of BA Spain Europe Regulator # Licensed Operators (2) Effective Gaming Tax (% NGR 2024) Regulation / Launch Date (1) Codere Online License Expiry Retail Requirements (3) Codere Online Launch Date Panama Secretaria de Gobernacion (SEGOB) 25+ 21% 2014 / 2016 May 2027 (LIFO License) Yes 2016 Coljuegos 15 15% (Statutory) (4) 2016 / 2017 November 2025 No 2018 Lotería de Buenos Aires (LOTBA) 11 15.4% (Statutory) (7) 2020 / 2021 December 2026 No 2021 Instituto Provincial de Loteria y Casinos (IPLYC) 7 23.5% (Statutory) (8) 2019 / 2021 N.A. No (5) N.A. Junta de Control de Juego (JCJ) 3+ 10% No Dirección General de Ordenación del Juego (DGOJ) 77 12% 2012 / 2012 May 2032 No 2012 Sports: 2002 / 2016 Casino: 2020 / 2020 2017 (Sports Betting) 2022 (Casino) December 2041 Province of Mendoza Instituto Provincial de Juegos y Casinos (IPJC) 5 24.5% (Statutory) (9) 2022 / 2023 2033 No (6) 2024 1) Regulation for online sports betting and casino unless indicated otherwise. 2) As per the latest available public information and / or Codere Online estimates. 3) Retail license or operation required to operate online. 4) Figure does not include a 19% indirect value - added tax on player deposits that is in effect since February 2025. 5) Partnership with a local operator required for international operators. 6) Retail presence not required but contributed additional points in the tender process. 7) Figure includes 10% gaming tax (% of NGR) and 6% gross revenue tax (% of NGR less gaming taxes). 8) Figure includes 10% gaming tax (% of NGR) and 15% gross revenue tax (% of NGR less gaming taxes). 9) Figure includes 10% gaming tax (% of GGR) and 12% gross revenue tax (% of GGR less gaming taxes).
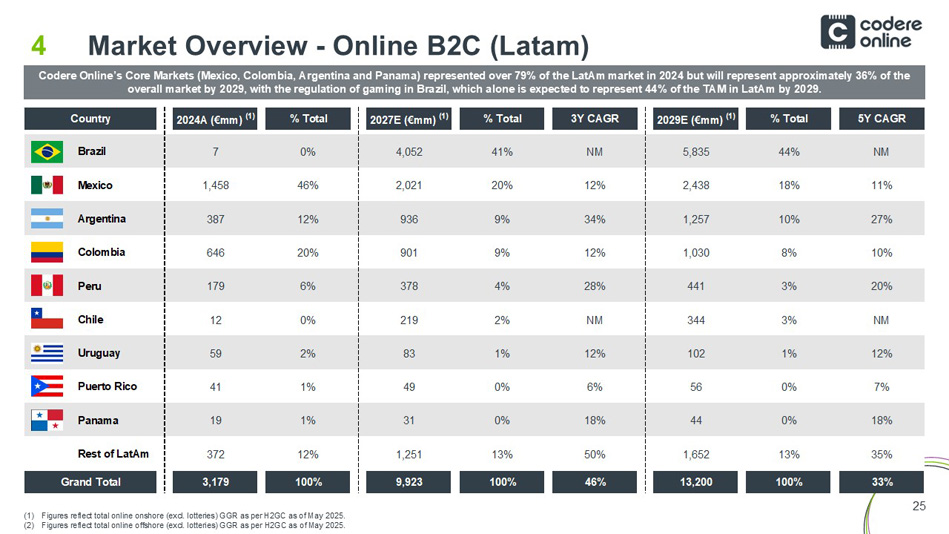
25 Market Overview - Online B2C ( Latam ) 4 (1) Figures reflect total online onshore (excl. lotteries) GGR as per H2GC as of May 2025. (2) Figures reflect total online offshore (excl. lotteries) GGR as per H2GC as of May 2025. Codere Online’s Core Markets (Mexico, Colombia, Argentina and Panama) represented over 79% of the LatAm market in 2024 but will represent approximately 36% of the overall market by 2029, with the regulation of gaming in Brazil, which alone is expected to represent 44% of the TAM in LatAm by 2029. Country 2024A (€mm) (1) % Total 2027E (€mm) (1) % Total 3Y CAGR 2029E (€mm) (1) % Total 5Y CAGR Brazil 7 0% 4,052 41% NM 5,835 44% NM Mexico 1,458 46% 2,021 20% 12% 2,438 18% 11% Argentina 387 12% 936 9% 34% 1,257 10% 27% Colombia 646 20% 901 9% 12% 1,030 8% 10% Peru 179 6% 378 4% 28% 441 3% 20% Chile 12 0% 219 2% NM 344 3% NM Uruguay 59 2% 83 1% 12% 102 1% 12% Puerto Rico 41 1% 49 0% 6% 56 0% 7% Panama 19 1% 31 0% 18% 44 0% 18% Rest of LatAm 372 12% 1,251 13% 50% 1,652 13% 35% Grand Total 3,179 100% 9,923 100% 46% 13,200 100% 33%
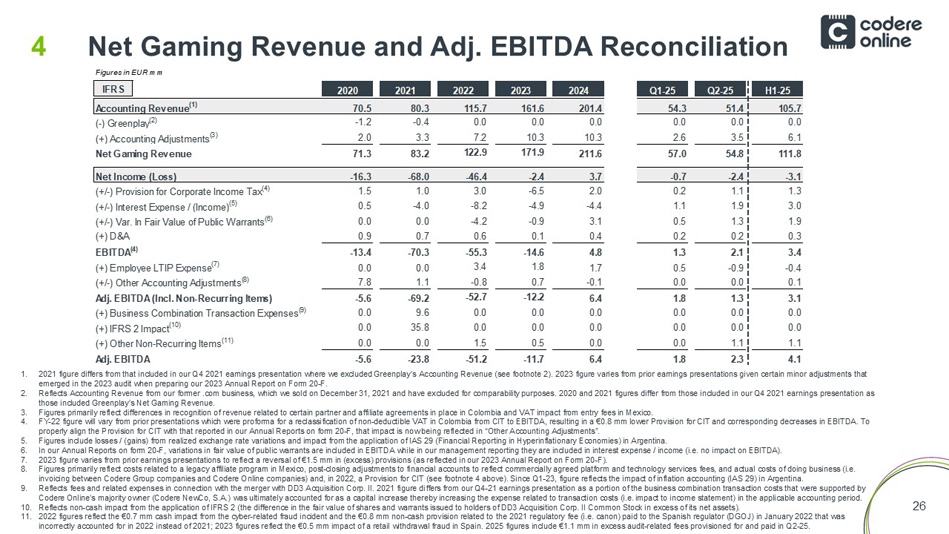
26 Net Gaming Revenue and Adj. EBITDA Reconciliation 4 1. 2021 figure differs from that included in our Q4 2021 earnings presentation where we excluded Greenplay’s Accounting Revenue (see footnote 2). 2023 figure varies from prior earnings presentations given certain minor adjustments tha t emerged in the 2023 audit when preparing our 2023 Annual Report on Form 20 - F. 2. Reflects Accounting Revenue from our former .com business, which we sold on December 31, 2021 and have excluded for comparabi lit y purposes. 2020 and 2021 figures differ from those included in our Q4 2021 earnings presentation as those included Greenplay’s Net Gaming Revenue. 3. Figures primarily reflect differences in recognition of revenue related to certain partner and affiliate agreements in place in Colombia and VAT impact from entry fees in Mexico. 4. FY - 22 figure will vary from prior presentations which were proforma for a reclassification of non - deductible VAT in Colombia from CIT to EBITDA, resulting in a €0.8 mm lower Provision for CIT and corresponding decreases in EBITDA. To properly align the Provision for CIT with that reported in our Annual Reports on form 20 - F, that impact is now being reflected i n “Other Accounting Adjustments”. 5. Figures include losses / (gains) from realized exchange rate variations and impact from the application of IAS 29 (Financial Rep orting in Hyperinflationary Economies) in Argentina. 6. In our Annual Reports on form 20 - F, variations in fair value of public warrants are included in EBITDA while in our management r eporting they are included in interest expense / income (i.e. no impact on EBITDA). 7. 2023 figure varies from prior earnings presentations to reflect a reversal of €1.5 mm in (excess) provisions (as reflected in ou r 2023 Annual Report on Form 20 - F). 8. Figures primarily reflect costs related to a legacy affiliate program in Mexico, post - closing adjustments to financial accounts to reflect commercially agreed platform and technology services fees, and actual costs of doing business (i.e. invoicing between Codere Group companies and Codere Online companies) and, in 2022, a Provision for CIT (see footnote 4 above ). Since Q1 - 23, figure reflects the impact of inflation accounting (IAS 29) in Argentina. 9. Reflects fees and related expenses in connection with the merger with DD3 Acquisition Corp. II. 2021 figure differs from our Q4 - 21 earnings presentation as a portion of the business combination transaction costs that were supported by Codere Online’s majority owner (Codere NewCo , S.A.) was ultimately accounted for as a capital increase thereby increasing the expense related to transaction costs (i.e. imp act to income statement) in the applicable accounting period. 10. Reflects non - cash impact from the application of IFRS 2 (the difference in the fair value of shares and warrants issued to holde rs of DD3 Acquisition Corp. II Common Stock in excess of its net assets). 11. 2022 figures reflect the €0.7 mm cash impact from the cyber - related fraud incident and the €0.8 mm non - cash provision related to the 2021 regulatory fee (i.e. canon) paid to the Spanish regulator (DGOJ) in January 2022 that was incorrectly accounted for in 2022 instead of 2021; 2023 figures reflect the €0.5 mm impact of a retail withdrawal fraud in Spain. 2025 figures include €1.1 mm in excess audit - rela ted fees provisioned for and paid in Q2 - 25. Figures in EUR mm IFRS 2020 2021 2022 2023 2024 Q1-25 Q2-25 H1-25 Accounting Revenue (1) 70.5 80.3 115.7 161.6 201.4 54.3 51.4 105.7 (-) Greenplay (2) -1.2 -0.4 0.0 0.0 0.0 0.0 0.0 0.0 (+) Accounting Adjustments (3) 2.0 3.3 7.2 10.3 10.3 2.6 3.5 6.1 Net Gaming Revenue 71.3 83.2 122.9 171.9 211.6 57.0 54.8 111.8 Net Income (Loss) -16.3 -68.0 -46.4 -2.4 3.7 -0.7 -2.4 -3.1 (+/-) Provision for Corporate Income Tax (4) 1.5 1.0 3.0 -6.5 2.0 0.2 1.1 1.3 (+/-) Interest Expense / (Income) (5) 0.5 -4.0 -8.2 -4.9 -4.4 1.1 1.9 3.0 (+/-) Var. In Fair Value of Public Warrants (6) 0.0 0.0 -4.2 -0.9 3.1 0.5 1.3 1.9 (+) D&A 0.9 0.7 0.6 0.1 0.4 0.2 0.2 0.3 EBITDA (4) -13.4 -70.3 -55.3 -14.6 4.8 1.3 2.1 3.4 (+) Employee LTIP Expense (7) 0.0 0.0 3.4 1.8 1.7 0.5 -0.9 -0.4 (+/-) Other Accounting Adjustments (8) 7.8 1.1 -0.8 0.7 -0.1 0.0 0.0 0.1 Adj. EBITDA (Incl. Non-Recurring Items) -5.6 -69.2 -52.7 -12.2 6.4 1.8 1.3 3.1 (+) Business Combination Transaction Expenses (9) 0.0 9.6 0.0 0.0 0.0 0.0 0.0 0.0 (+) IFRS 2 Impact (10) 0.0 35.8 0.0 0.0 0.0 0.0 0.0 0.0 (+) Other Non-Recurring Items (11) 0.0 0.0 1.5 0.5 0.0 0.0 1.1 1.1 Adj. EBITDA -5.6 -23.8 -51.2 -11.7 6.4 1.8 2.3 4.1
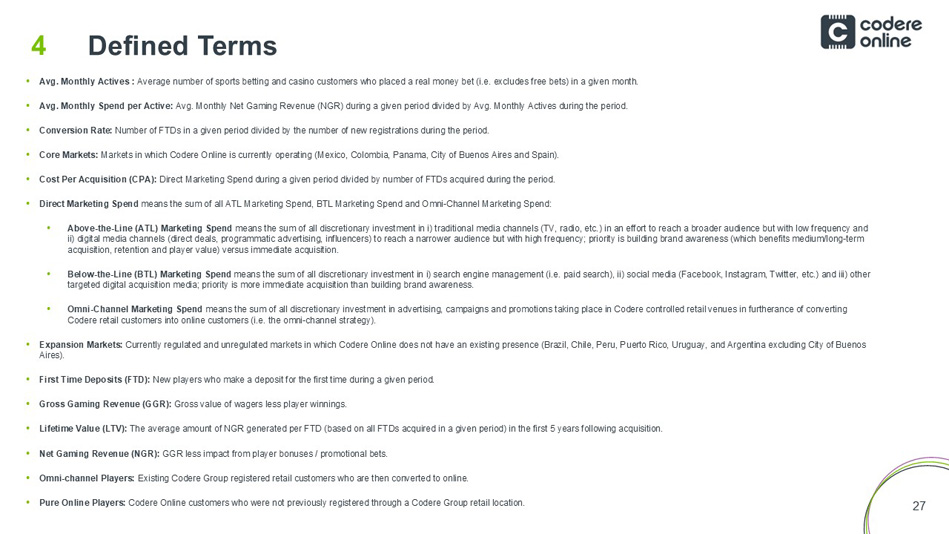
27 Defined Terms 4 • Avg. Monthly Actives : Average number of sports betting and casino customers who placed a real money bet (i.e. excludes free bets) in a given month. • Avg. Monthly Spend per Active: Avg. Monthly Net Gaming Revenue (NGR) during a given period divided by Avg. Monthly Actives during the period. • Conversion Rate: Number of FTDs in a given period divided by the number of new registrations during the period. • Core Markets: Markets in which Codere Online is currently operating (Mexico, Colombia, Panama, City of Buenos Aires and Spain). • Cost Per Acquisition (CPA): Direct Marketing Spend during a given period divided by number of FTDs acquired during the period. • Direct Marketing Spend means the sum of all ATL Marketing Spend, BTL Marketing Spend and Omni - Channel Marketing Spend: • Above - the - Line (ATL) Marketing Spend means the sum of all discretionary investment in i ) traditional media channels (TV, radio, etc.) in an effort to reach a broader audience but with low frequency and ii) digital media channels (direct deals, programmatic advertising, influencers) to reach a narrower audience but with high f req uency; priority is building brand awareness (which benefits medium/long - term acquisition, retention and player value) versus immediate acquisition. • Below - the - Line (BTL) Marketing Spend means the sum of all discretionary investment in i ) search engine management (i.e. paid search), ii) social media (Facebook, Instagram, Twitter, etc.) and iii) other targeted digital acquisition media; priority is more immediate acquisition than building brand awareness. • Omni - Channel Marketing Spend means the sum of all discretionary investment in advertising, campaigns and promotions taking place in Codere controlled reta il venues in furtherance of converting Codere retail customers into online customers (i.e. the omni - channel strategy). • Expansion Markets: Currently regulated and unregulated markets in which Codere Online does not have an existing presence (Brazil, Chile, Peru, P ue rto Rico, Uruguay, and Argentina excluding City of Buenos Aires). • First Time Deposits (FTD): New players who make a deposit for the first time during a given period. • Gross Gaming Revenue (GGR): Gross value of wagers less player winnings. • Lifetime Value (LTV): The average amount of NGR generated per FTD (based on all FTDs acquired in a given period) in the first 5 years following acq uis ition. • Net Gaming Revenue (NGR): GGR less impact from player bonuses / promotional bets. • Omni - channel Players: Existing Codere Group registered retail customers who are then converted to online. • Pure Online Players: Codere Online customers who were not previously registered through a Codere Group retail location.

codereonline.com ir@codereonline.com (+34) 91.354.2800