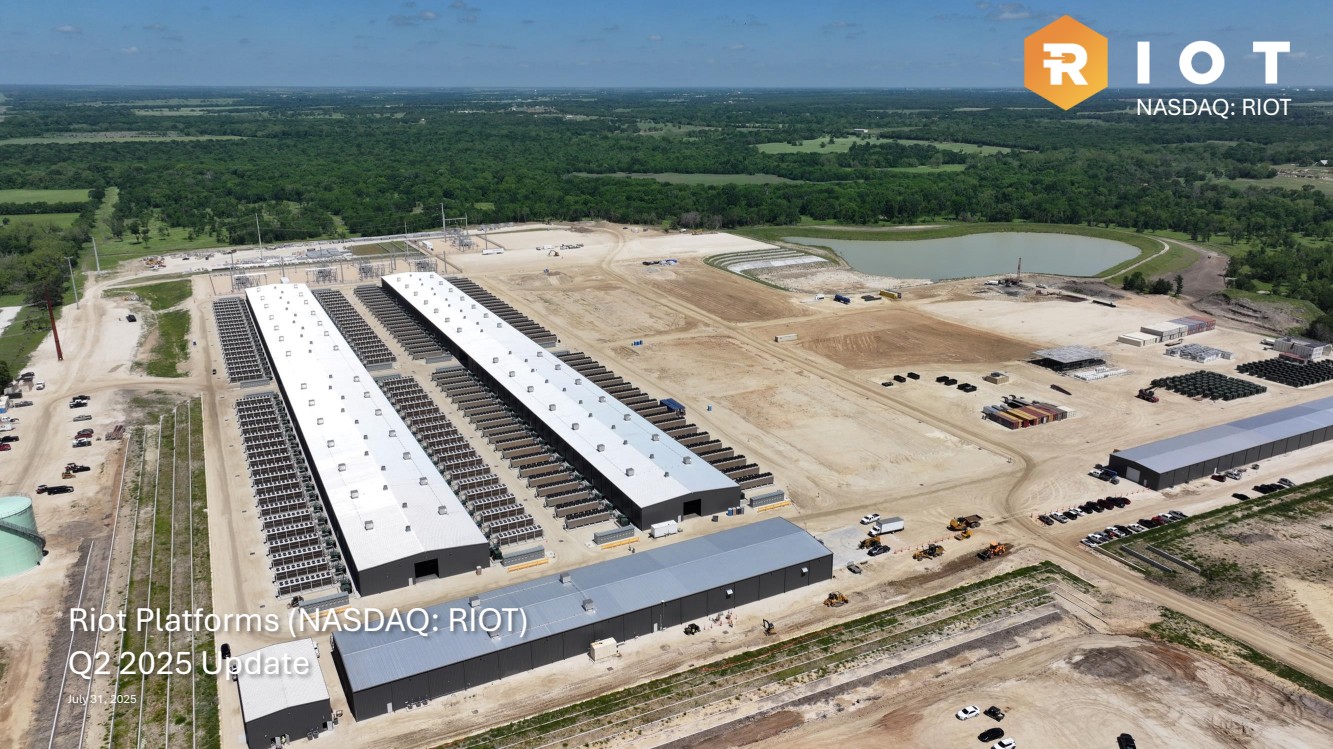
| Riot Platforms (NASDAQ: RIOT) Q2 2025 Update July 31, 2025 NASDAQ: RIOT |
| Statements in this presentation that are not statements of historical fact are forward-looking statements that reflect management’s current expectations, assumptions, and estimates of future performance and economic conditions, and are not guarantees of future performance or actual results. Such statements are made in reliance on the safe harbor provisions of Section 27A of the Securities Act of 1933, as amended, and Section 21E of the Securities Exchange Act of 1934, as amended. These forward-looking statements may include, but are not limited to, statements about the benefits of acquisitions, including potential future financial and operating results, as well as the Company’s plans, objectives, expectations, and intentions. Words such as “anticipates,” “believes,” “plans,” “expects,” “intends,” “will,” “potential,” “hope,” and similar expressions are intended to identify forward-looking statements; however, forward-looking statements may be made without such signifying expressions. Because such forward-looking statements reflect management’s current expectations, assumptions and estimates of future performance and economic conditions, they are subject to risks and uncertainties that may cause actual results to differ materially from those expressed or implied by such forward-looking statements. These risks and uncertainties include, but are not limited to: statements concerning: our plans, strategies and objectives for future operations, integration of new equipment, systems, technologies, services or developments, the feasibility of developing the Company’s remaining power capacity for artificial intelligence (“AI”)/high-performance computing (“HPC”) uses, and the development and implementation of industrial-scale immersion-cooled Bitcoin mining hardware at our Bitcoin Mining facilities in Kentucky and Texas; the anticipated demand for AI/HPC uses; future economic conditions, performance, or outlooks; future political conditions; the outcome of contingencies; potential acquisitions or divestitures; the number and value of Bitcoin rewards and transaction fees we earn from our Bitcoin Mining operations; future self-mining hash rate capacity; timing of receipt and deployment of miners; expected cash flows or capital expenditures; our beliefs or expectations; activities, events or developments that we intend, expect, project, believe, or anticipate will or may occur in the future; unaudited estimates of bitcoin production; risks related to the success, schedule, cost and difficulty of integrating businesses we acquire; and our failure to realize anticipated efficiencies and strategic and financial benefits from our acquisitions. Detailed information regarding the factors identified by the Company’s management which they believe may cause actual results to differ materially from those expressed or implied by the forward-looking statements contained in this presentation may be found in the Company’s filings with the U.S. Securities and Exchange Commission (the “SEC”), including the risks, uncertainties and other factors discussed under the sections entitled “Risk Factors” and “Cautionary Note Regarding Forward-Looking Statements” of the Company’s Annual Report on Form 10-K for the fiscal year ended December 31, 2024, and the other filings the Company makes with the SEC, copies of which may be obtained from the SEC’s website, www.sec.gov. In addition to these risks and those identified by the Company’s management and disclosed in the Company’s filings with the SEC, other risks, factors and uncertainties not identified by management, or which management does not presently believe to be material to the Company, its business or prospects, may also materially affect the Company’s actual future results, including in ways adverse to the Company’s business. All forward-looking statements included in this presentation are made only as of the date of this presentation, and the Company disclaims any intention or obligation to update or revise any such forward-looking statements to reflect events or circumstances that subsequently occur, or of which the Company hereafter becomes aware, except as required by law. Persons reading this presentation are cautioned not to place undue reliance on such forward-looking statements. 2 Forward Looking Statements |
| FY 2023 Financial Update 3 Table of Contents I. Riot’s Strategic Roadmap II. Q2 2025 Key Accomplishments III. Q2 2025 Financial Update I. Capital Expenditures Update II. Data Center Update III. Closing Remarks I II III IV V VI |
| 4 I Riot’s Strategic Roadmap |

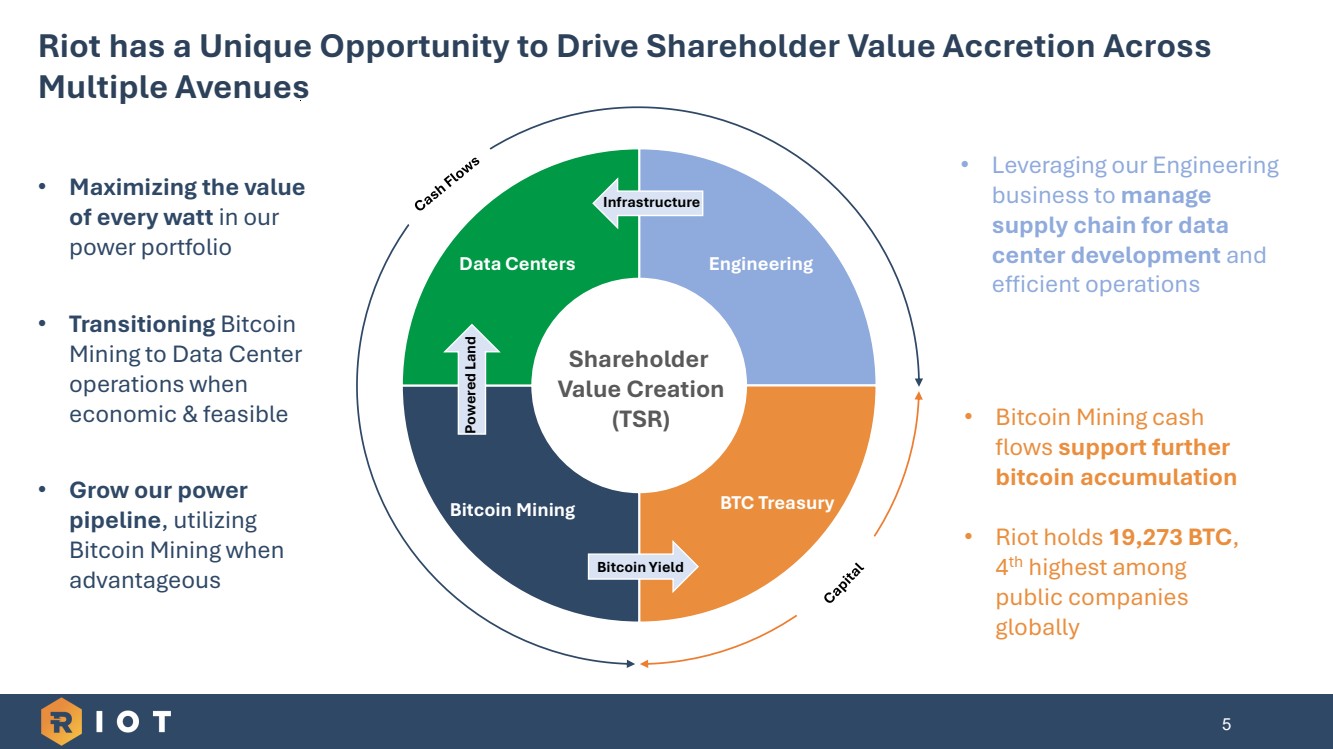
| 5 Riot has a Unique Opportunity to Drive Shareholder Value Accretion Across Multiple Avenues Engineering BTC Treasury Bitcoin Mining Data Centers Shareholder Value Creation (TSR) • Maximizing the value of every watt in our power portfolio • Transitioning Bitcoin Mining to Data Center operations when economic & feasible • Grow our power pipeline, utilizing Bitcoin Mining when advantageous • Leveraging our Engineering business to manage supply chain for data center development and efficient operations • Bitcoin Mining cash flows support further bitcoin accumulation • Riot holds 19,273 BTC, 4 th highest among public companies globally Bitcoin Yield Powered Land Infrastructure |
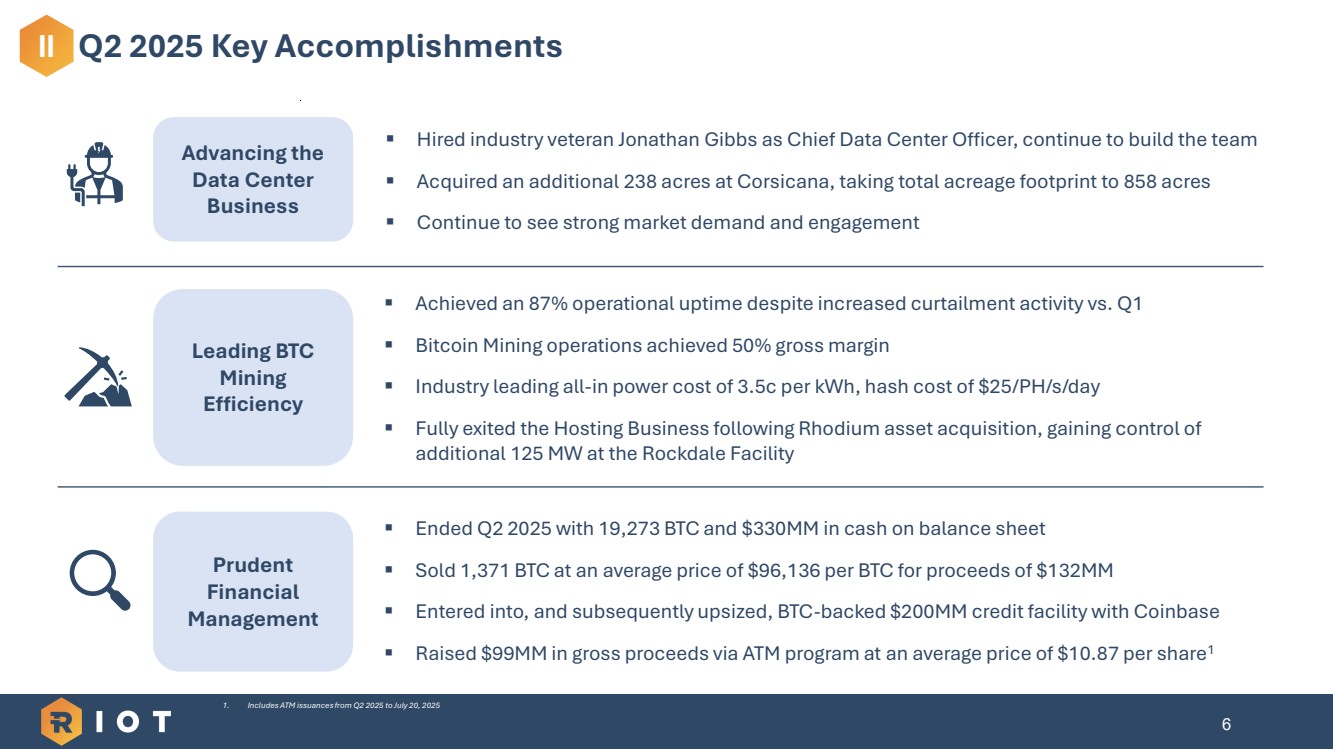
| 6 Leading BTC Mining Efficiency Advancing the Data Center Business ▪ Achieved an 87% operational uptime despite increased curtailment activity vs. Q1 ▪ Bitcoin Mining operations achieved 50% gross margin ▪ Industry leading all-in power cost of 3.5c per kWh, hash cost of $25/PH/s/day ▪ Fully exited the Hosting Business following Rhodium asset acquisition, gaining control of additional 125 MW at the Rockdale Facility ▪ Hired industry veteran Jonathan Gibbs as Chief Data Center Officer, continue to build the team ▪ Acquired an additional 238 acres at Corsicana, taking total acreage footprint to 858 acres ▪ Continue to see strong market demand and engagement Prudent Financial Management ▪ Ended Q2 2025 with 19,273 BTC and $330MM in cash on balance sheet ▪ Sold 1,371 BTC at an average price of $96,136 per BTC for proceeds of $132MM ▪ Entered into, and subsequently upsized, BTC-backed $200MM credit facility with Coinbase ▪ Raised $99MM in gross proceeds via ATM program at an average price of $10.87 per share1 II Q2 2025 Key Accomplishments 1. Includes ATM issuances from Q2 2025 to July 20, 2025 |
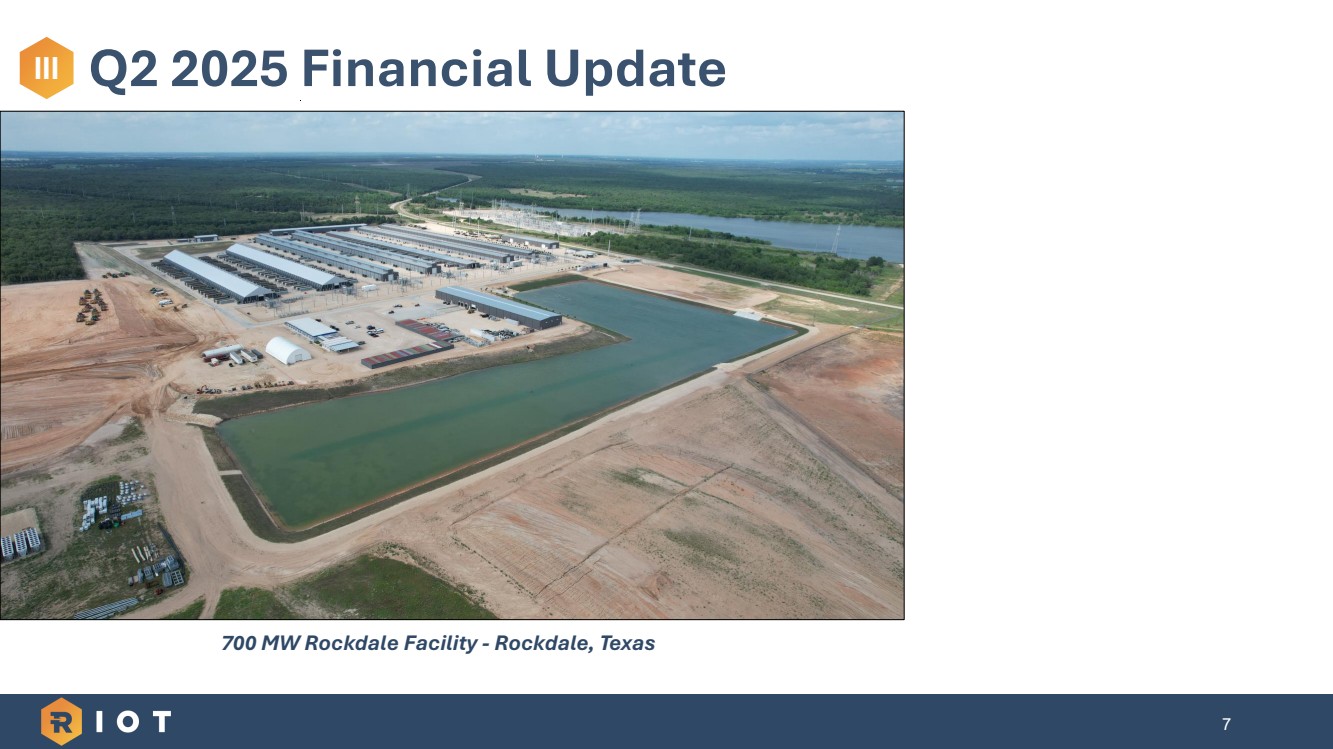
| FY 2023 Financial Update 7 700 MW Rockdale Facility - Rockdale, Texas III Q2 2025 Financial Update |
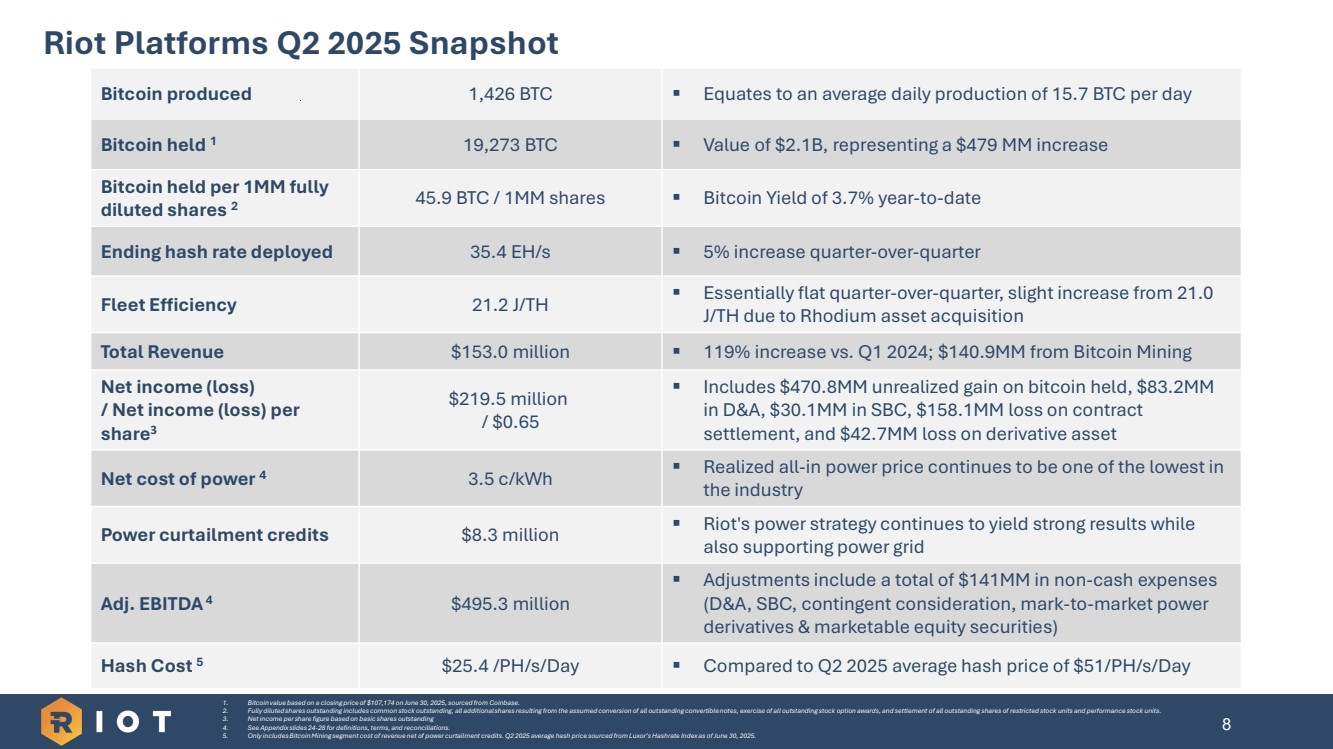
| 8 Bitcoin produced 1,426 BTC ▪ Equates to an average daily production of 15.7 BTC per day Bitcoin held 1 19,273 BTC ▪ Value of $2.1B, representing a $479 MM increase Bitcoin held per 1MM fully diluted shares 2 45.9 BTC / 1MM shares ▪ Bitcoin Yield of 3.7% year-to-date Ending hash rate deployed 35.4 EH/s ▪ 5% increase quarter-over-quarter Fleet Efficiency 21.2 J/TH ▪ Essentially flat quarter-over-quarter, slight increase from 21.0 J/TH due to Rhodium asset acquisition Total Revenue $153.0 million ▪ 119% increase vs. Q1 2024; $140.9MM from Bitcoin Mining Net income (loss) / Net income (loss) per share3 $219.5 million / $0.65 ▪ Includes $470.8MM unrealized gain on bitcoin held, $83.2MM in D&A, $30.1MM in SBC, $158.1MM loss on contract settlement, and $42.7MM loss on derivative asset Net cost of power 4 3.5 c/kWh ▪ Realized all-in power price continues to be one of the lowest in the industry Power curtailment credits $8.3 million ▪ Riot's power strategy continues to yield strong results while also supporting power grid Adj. EBITDA4 $495.3 million ▪ Adjustments include a total of $141MM in non-cash expenses (D&A, SBC, contingent consideration, mark-to-market power derivatives & marketable equity securities) Hash Cost 5 $25.4 /PH/s/Day ▪ Compared to Q2 2025 average hash price of $51/PH/s/Day 1. Bitcoin value based on a closing price of $107,174 on June 30, 2025, sourced from Coinbase. 2. Fully diluted shares outstanding includes common stock outstanding, all additional shares resulting from the assumed conversion of all outstanding convertible notes, exercise of all outstanding stock option awards, and settlement of all outstanding shares of restricted stock units and performance stock units. 3. Net income per share figure based on basic shares outstanding 4. See Appendix slides 24-28 for definitions, terms, and reconciliations. 5. Only includes Bitcoin Mining segment cost of revenue net of power curtailment credits. Q2 2025 average hash price sourced from Luxor’s Hashrate Index as of June 30, 2025. Riot Platforms Q2 2025 Snapshot |
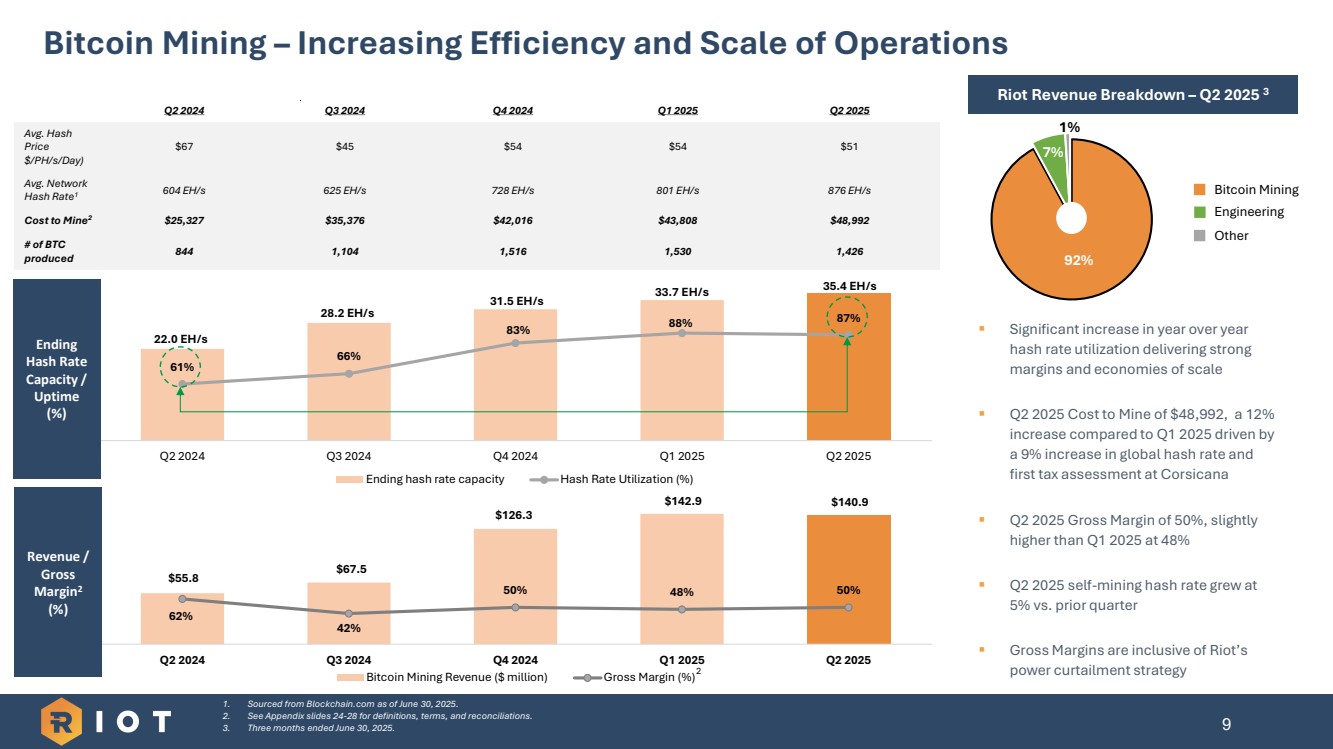
| 22.0 EH/s 28.2 EH/s 31.5 EH/s 33.7 EH/s 35.4 EH/s 61% 66% 83% 88% 87% 30% 40% 50% 60% 70% 80% 90% 100% 110% 120% $0 m $5 m $10 m $15 m $20 m $25 m $30 m $35 m $40 m Q2 2024 Q3 2024 Q4 2024 Q1 2025 Q2 2025 Ending hash rate capacity Hash Rate Utilization (%) $55.8 $67.5 $126.3 $142.9 $140.9 62% 42% 50% 48% 50% 0% 50% 100% 150% 200% $0 m $20 m $40 m $60 m $80 m $100 m $120 m $140 m $160 m Q2 2024 Q3 2024 Q4 2024 Q1 2025 Q2 2025 Bitcoin Mining Revenue ($ million) Gross Margin (%) Bitcoin Mining – Increasing Efficiency and Scale of Operations 9 ▪ Significant increase in year over year hash rate utilization delivering strong margins and economies of scale ▪ Q2 2025 Cost to Mine of $48,992, a 12% increase compared to Q1 2025 driven by a 9% increase in global hash rate and first tax assessment at Corsicana ▪ Q2 2025 Gross Margin of 50%, slightly higher than Q1 2025 at 48% ▪ Q2 2025 self-mining hash rate grew at 5% vs. prior quarter ▪ Gross Margins are inclusive of Riot’s power curtailment strategy 1. Sourced from Blockchain.com as of June 30, 2025. 2. See Appendix slides 24-28 for definitions, terms, and reconciliations. 3. Three months ended June 30, 2025. Q2 2024 Q3 2024 Q4 2024 Q1 2025 Q2 2025 Avg. Hash Price $/PH/s/Day) $67 $45 $54 $54 $51 Avg. Network Hash Rate1 604 EH/s 625 EH/s 728 EH/s 801 EH/s 876 EH/s Cost to Mine2 $25,327 $35,376 $42,016 $43,808 $48,992 # of BTC produced 844 1,104 1,516 1,530 1,426 Riot Revenue Breakdown – Q2 2025 3 Ending Hash Rate Capacity / Uptime (%) Revenue / Gross Margin2 (%) 92% 7% 1% 2 Bitcoin Mining Engineering Other |
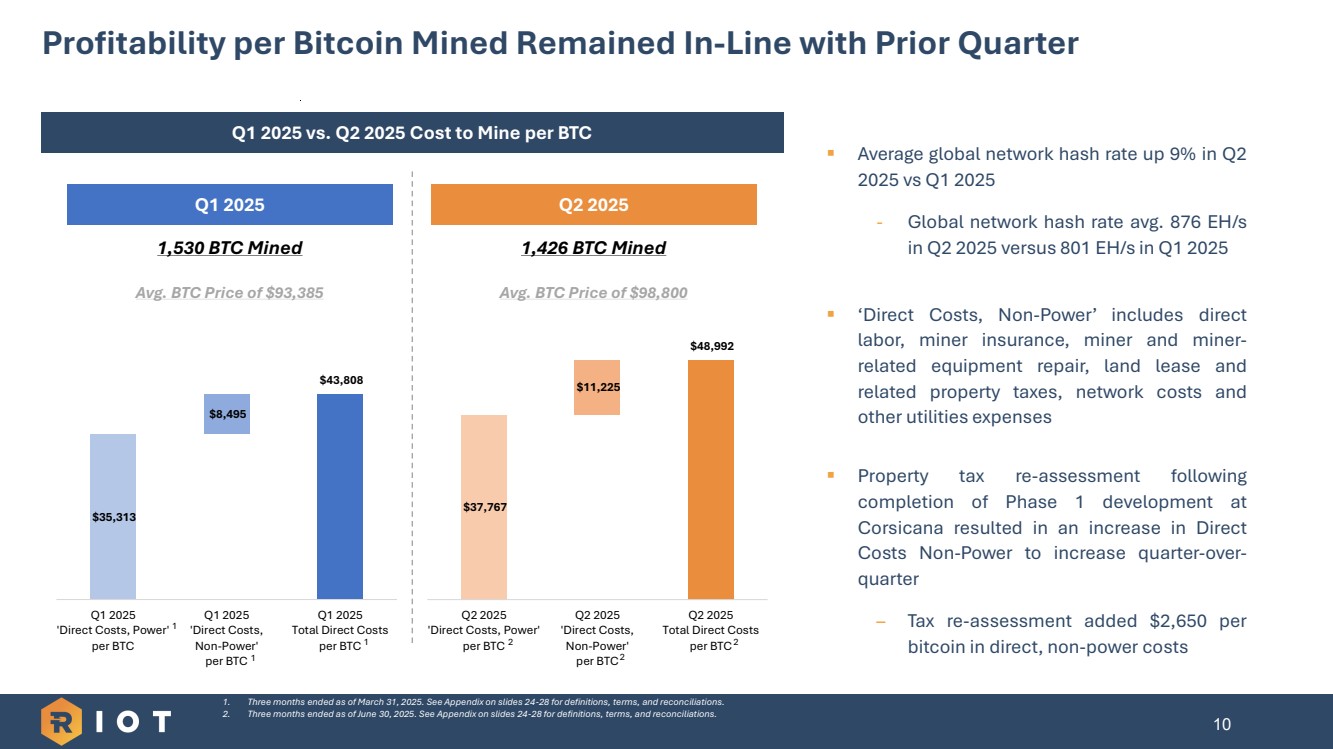
| $37,767 $11,225 $48,992 Q2 2025 'Direct Costs, Power' per BTC Q2 2025 'Direct Costs, Non-Power' per BTC Q2 2025 Total Direct Costs per BTC $35,313 $8,495 $43,808 Q1 2025 'Direct Costs, Power' per BTC Q1 2025 'Direct Costs, Non-Power' per BTC Q1 2025 Total Direct Costs per BTC 10 Profitability per Bitcoin Mined Remained In-Line with Prior Quarter Q1 2025 vs. Q2 2025 Cost to Mine per BTC 1 2 1. Three months ended as of March 31, 2025. See Appendix on slides 24-28 for definitions, terms, and reconciliations. 2. Three months ended as of June 30, 2025. See Appendix on slides 24-28 for definitions, terms, and reconciliations. ▪ Average global network hash rate up 9% in Q2 2025 vs Q1 2025 - Global network hash rate avg. 876 EH/s in Q2 2025 versus 801 EH/s in Q1 2025 ▪ ‘Direct Costs, Non-Power’ includes direct labor, miner insurance, miner and miner-related equipment repair, land lease and related property taxes, network costs and other utilities expenses ▪ Property tax re-assessment following completion of Phase 1 development at Corsicana resulted in an increase in Direct Costs Non-Power to increase quarter-over-quarter – Tax re-assessment added $2,650 per bitcoin in direct, non-power costs 1 2 1 2 Q1 2025 Q2 2025 1,530 BTC Mined Avg. BTC Price of $93,385 1,426 BTC Mined Avg. BTC Price of $98,800 |
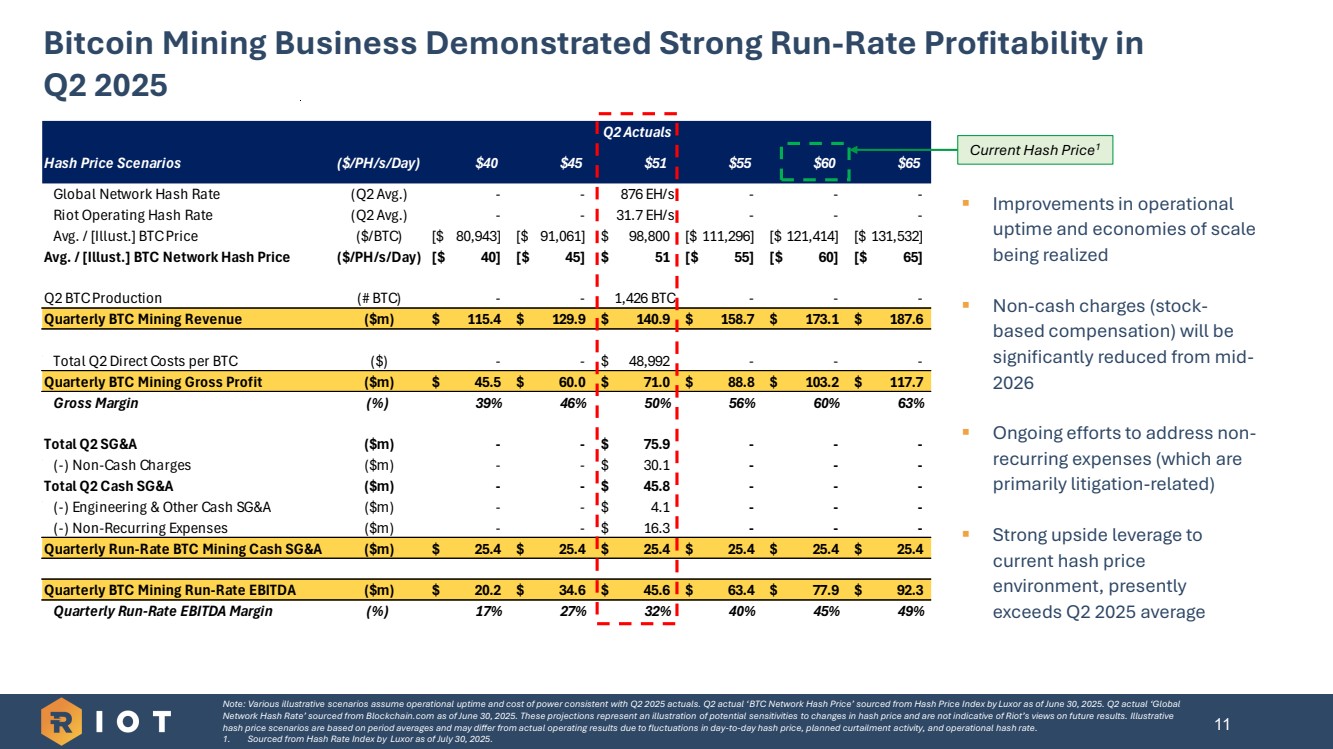
| Q2 Actuals Hash Price Scenarios ($/PH/s/Day) $40 $45 $51 $55 $60 $65 Global Network Hash Rate (Q2 Avg.) - - 876 EH/s - - - Riot Operating Hash Rate (Q2 Avg.) - - 31.7 EH/s - - - Avg. / [Illust.] BTC Price ($/BTC) [$ 80,943] [$ 91,061] $ 98,800 [$ 111,296] [$ 121,414] [$ 131,532] Avg. / [Illust.] BTC Network Hash Price ($/PH/s/Day) [$ 40] [$ 45] $ 51 [$ 55] [$ 60] [$ 65] Q2 BTC Production (# BTC) - - 1,426 BTC - - - Quarterly BTC Mining Revenue ($m) $ 115.4 $ 129.9 $ 140.9 $ 158.7 $ 173.1 $ 187.6 Total Q2 Direct Costs per BTC ($) - - $ 48,992 - - - Quarterly BTC Mining Gross Profit ($m) $ 45.5 $ 60.0 $ 71.0 $ 88.8 $ 103.2 $ 117.7 Gross Margin (%) 39% 46% 50% 56% 60% 63% Total Q2 SG&A ($m) - - $ 75.9 - - - (-) Non-Cash Charges ($m) - - $ 30.1 - - - Total Q2 Cash SG&A ($m) - - $ 45.8 - - - (-) Engineering & Other Cash SG&A ($m) - - $ 4.1 - - - (-) Non-Recurring Expenses ($m) - - $ 16.3 - - - Quarterly Run-Rate BTC Mining Cash SG&A ($m) $ 25.4 $ 25.4 $ 25.4 $ 25.4 $ 25.4 $ 25.4 Quarterly BTC Mining Run-Rate EBITDA ($m) $ 20.2 $ 34.6 $ 45.6 $ 63.4 $ 77.9 $ 92.3 Quarterly Run-Rate EBITDA Margin (%) 17% 27% 32% 40% 45% 49% Bitcoin Mining Business Demonstrated Strong Run-Rate Profitability in Q2 2025 11 Note: Various illustrative scenarios assume operational uptime and cost of power consistent with Q2 2025 actuals. Q2 actual ‘BTC Network Hash Price’ sourced from Hash Price Index by Luxor as of June 30, 2025. Q2 actual ‘Global Network Hash Rate’ sourced from Blockchain.com as of June 30, 2025. These projections represent an illustration of potential sensitivities to changes in hash price and are not indicative of Riot’s views on future results. Illustrative hash price scenarios are based on period averages and may differ from actual operating results due to fluctuations in day-to-day hash price, planned curtailment activity, and operational hash rate. 1. Sourced from Hash Rate Index by Luxor as of July 30, 2025. ▪ Improvements in operational uptime and economies of scale being realized ▪ Non-cash charges (stock-based compensation) will be significantly reduced from mid-2026 ▪ Ongoing efforts to address non-recurring expenses (which are primarily litigation-related) ▪ Strong upside leverage to current hash price environment, presently exceeds Q2 2025 average Current Hash Price1 |
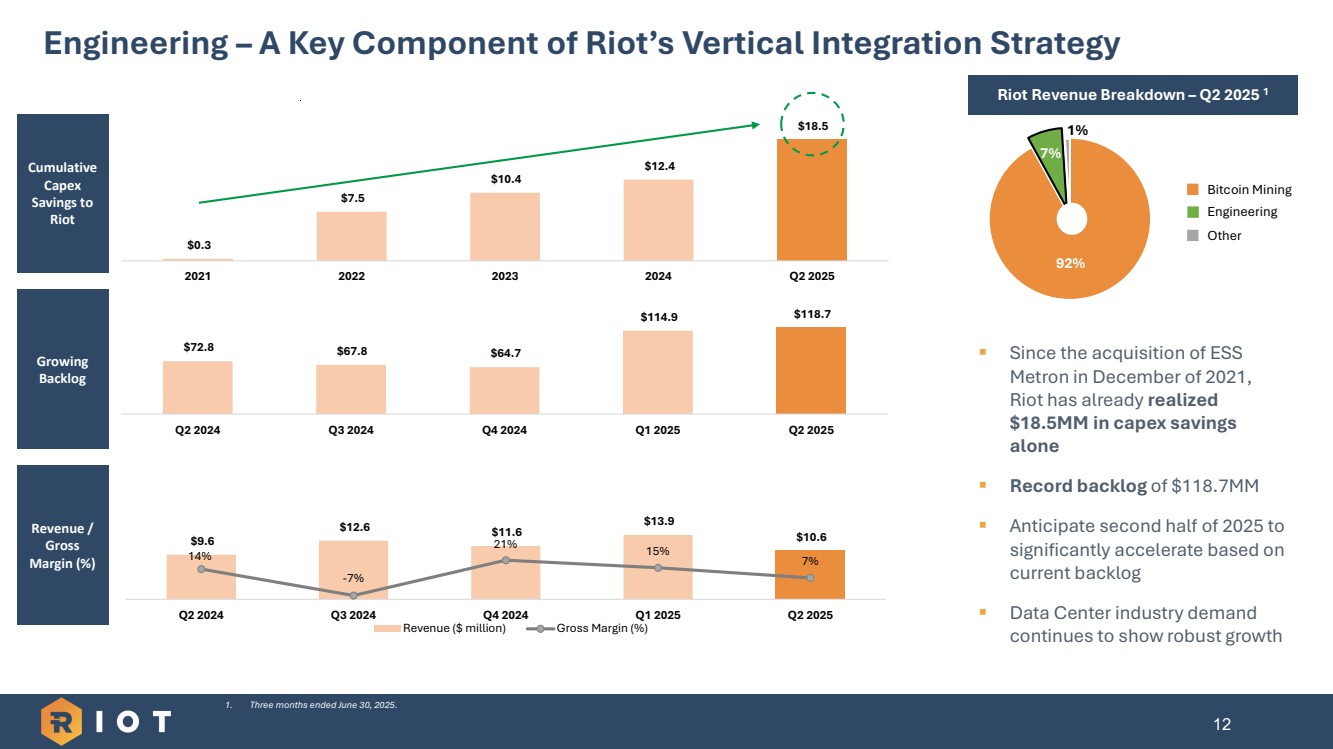
| Engineering – A Key Component of Riot’s Vertical Integration Strategy 12 ▪ Since the acquisition of ESS Metron in December of 2021, Riot has already realized $18.5MM in capex savings alone ▪ Record backlog of $118.7MM ▪ Anticipate second half of 2025 to significantly accelerate based on current backlog ▪ Data Center industry demand continues to show robust growth Riot Revenue Breakdown – Q4 20231 1. Three months ended June 30, 2025. Cumulative Capex Savings to Riot Riot Revenue Breakdown – Q2 2025 1 92% 7% 1% Bitcoin Mining Engineering Other Growing Backlog Revenue / Gross Margin (%) $72.8 $67.8 $64.7 $114.9 $118.7 Q2 2024 Q3 2024 Q4 2024 Q1 2025 Q2 2025 $0.3 $7.5 $10.4 $12.4 $18.5 2021 2022 2023 2024 Q2 2025 $9.6 $12.6 $11.6 $13.9 $10.6 14% -7% 21% 15% 7% Q2 2024 Q3 2024 Q4 2024 Q1 2025 Q2 2025 Revenue ($ million) Gross Margin (%) |
| 13 IV Capital Expenditures Update |
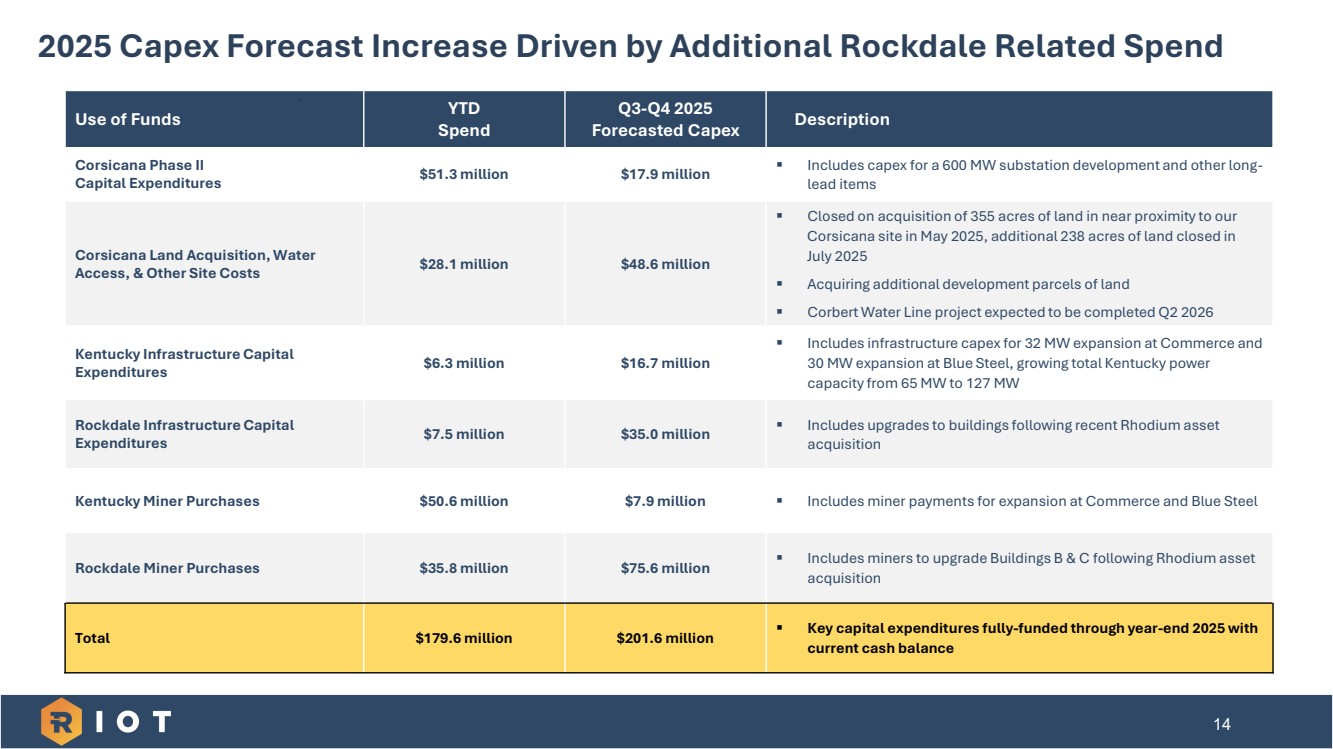
| 14 2025 Capex Forecast Increase Driven by Additional Rockdale Related Spend Use of Funds YTD Spend Q3-Q4 2025 Forecasted Capex Description Corsicana Phase II Capital Expenditures $51.3 million $17.9 million ▪ Includes capex for a 600 MW substation development and other long-lead items Corsicana Land Acquisition, Water Access, & Other Site Costs $28.1 million $48.6 million ▪ Closed on acquisition of 355 acres of land in near proximity to our Corsicana site in May 2025, additional 238 acres of land closed in July 2025 ▪ Acquiring additional development parcels of land ▪ Corbert Water Line project expected to be completed Q2 2026 Kentucky Infrastructure Capital Expenditures $6.3 million $16.7 million ▪ Includes infrastructure capex for 32 MW expansion at Commerce and 30 MW expansion at Blue Steel, growing total Kentucky power capacity from 65 MW to 127 MW Rockdale Infrastructure Capital Expenditures $7.5 million $35.0 million ▪ Includes upgrades to buildings following recent Rhodium asset acquisition Kentucky Miner Purchases $50.6 million $7.9 million ▪ Includes miner payments for expansion at Commerce and Blue Steel Rockdale Miner Purchases $35.8 million $75.6 million ▪ Includes miners to upgrade Buildings B & C following Rhodium asset acquisition Total $179.6 million $201.6 million ▪ Key capital expenditures fully-funded through year-end 2025 with current cash balance |
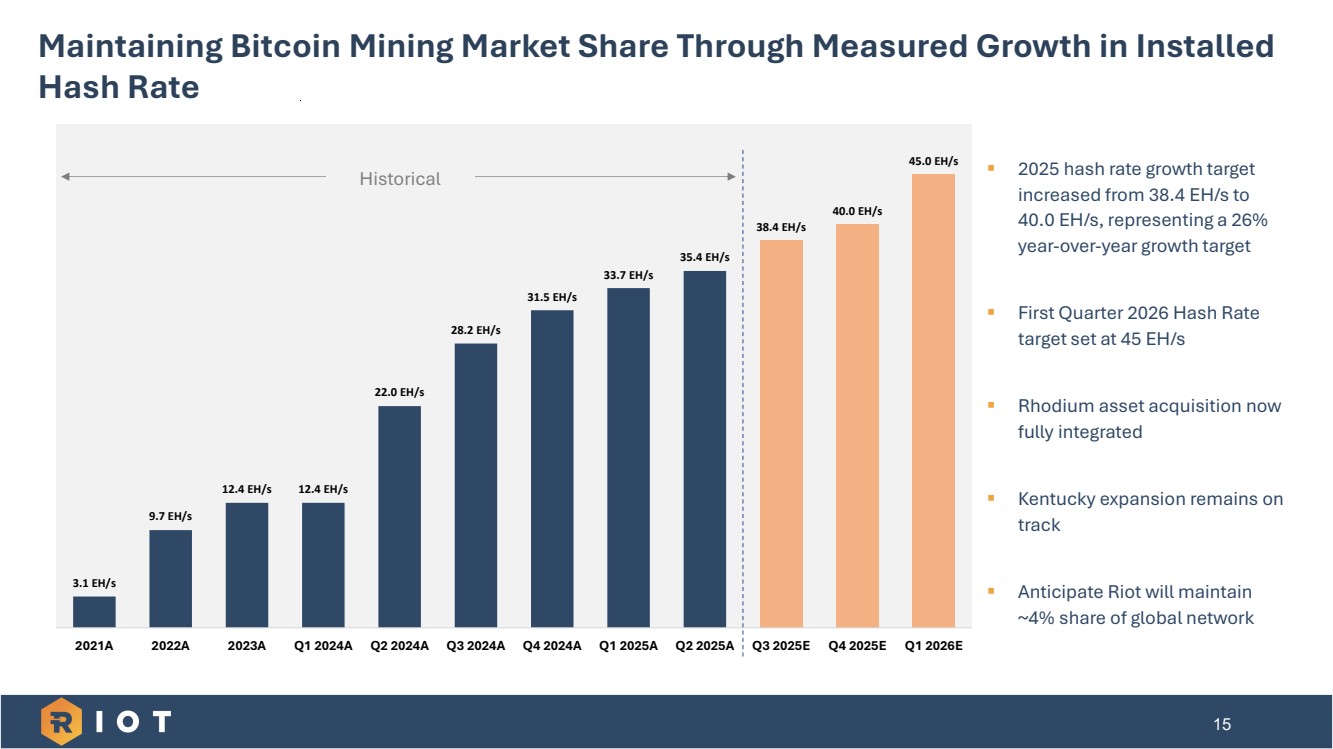
| 15 Maintaining Bitcoin Mining Market Share Through Measured Growth in Installed Hash Rate ▪ 2025 hash rate growth target increased from 38.4 EH/s to 40.0 EH/s, representing a 26% year-over-year growth target ▪ First Quarter 2026 Hash Rate target set at 45 EH/s ▪ Rhodium asset acquisition now fully integrated ▪ Kentucky expansion remains on track ▪ Anticipate Riot will maintain ~4% share of global network 3.1 EH/s 9.7 EH/s 12.4 EH/s 12.4 EH/s 22.0 EH/s 28.2 EH/s 31.5 EH/s 33.7 EH/s 35.4 EH/s 38.4 EH/s 40.0 EH/s 45.0 EH/s 2021A 2022A 2023A Q1 2024A Q2 2024A Q3 2024A Q4 2024A Q1 2025A Q2 2025A Q3 2025E Q4 2025E Q1 2026E Historical |
| 16 V Data Center Update |
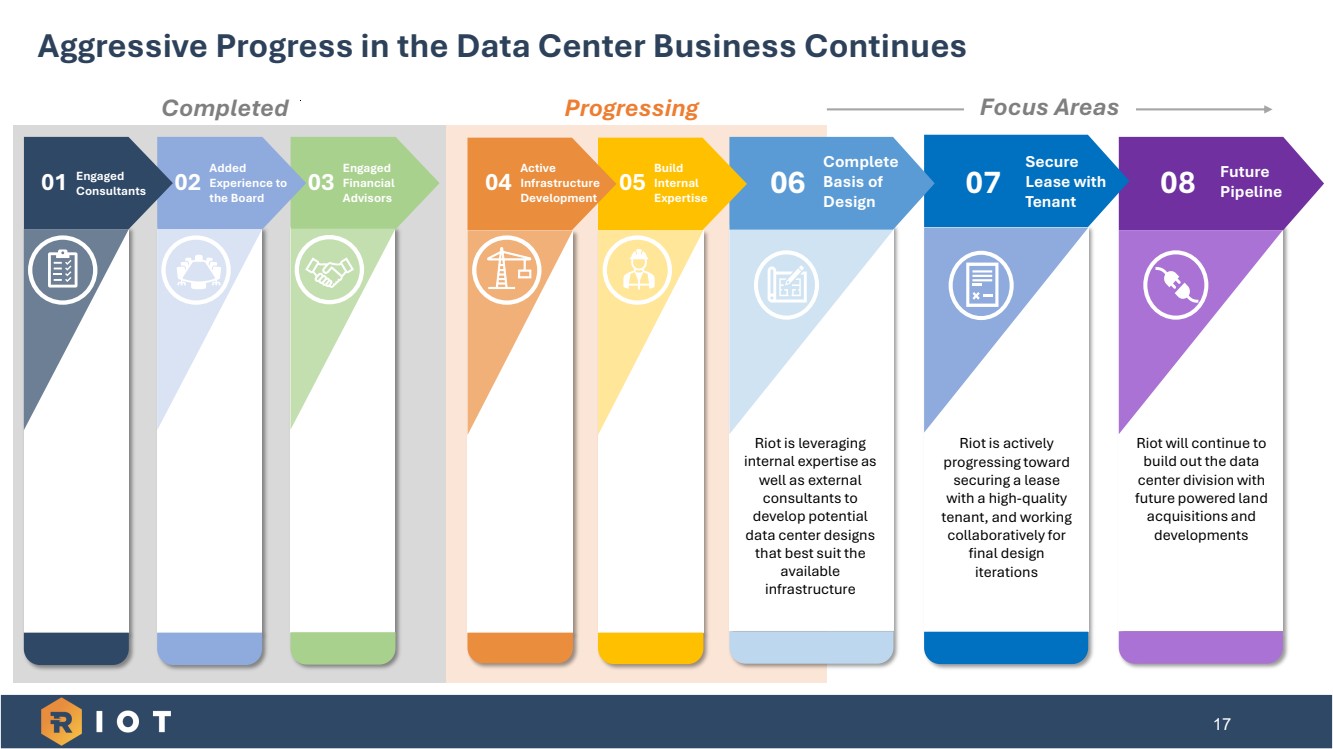
| 07 Secure Lease with Tenant Riot is actively progressing toward securing a lease with a high-quality tenant, and working collaboratively for final design iterations 17 Aggressive Progress in the Data Center Business Continues Completed Focus Areas 03 Engaged Financial Advisors Added Experience to the Board 08 Future Pipeline Riot will continue to build out the data center division with future powered land acquisitions and developments 02 Added Experience to the Board 01 Engaged Consultants 06 Complete Basis of Design Riot is leveraging internal expertise as well as external consultants to develop potential data center designs that best suit the available infrastructure Progressing 05 Build Internal Expertise 04 Active Infrastructure Development |
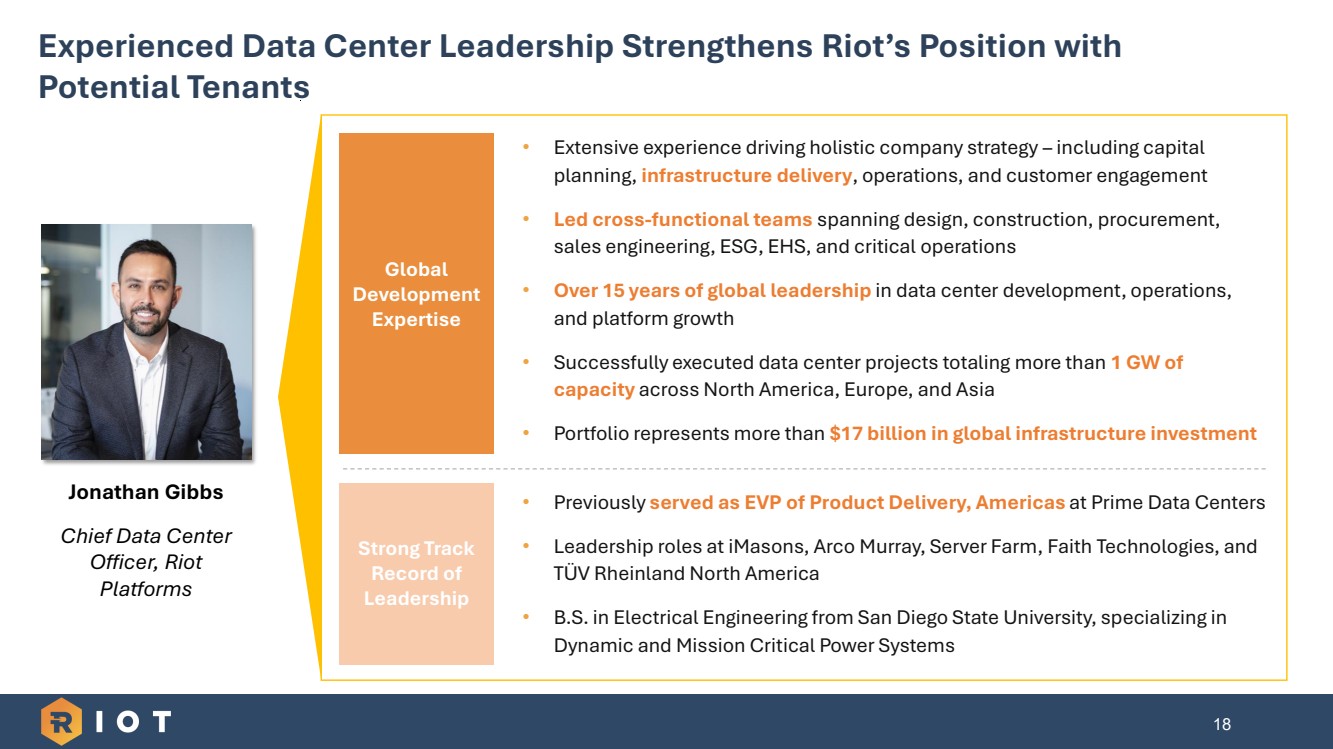
| 18 Experienced Data Center Leadership Strengthens Riot’s Position with Potential Tenants • Extensive experience driving holistic company strategy – including capital planning, infrastructure delivery, operations, and customer engagement • Led cross-functional teams spanning design, construction, procurement, sales engineering, ESG, EHS, and critical operations • Over 15 years of global leadership in data center development, operations, and platform growth • Successfully executed data center projects totaling more than 1 GW of capacity across North America, Europe, and Asia • Portfolio represents more than $17 billion in global infrastructure investment Global Development Expertise Jonathan Gibbs Chief Data Center Officer, Riot Platforms Strong Track Record of Leadership • Previously served as EVP of Product Delivery, Americas at Prime Data Centers • Leadership roles at iMasons, Arco Murray, Server Farm, Faith Technologies, and TÜV Rheinland North America • B.S. in Electrical Engineering from San Diego State University, specializing in Dynamic and Mission Critical Power Systems |
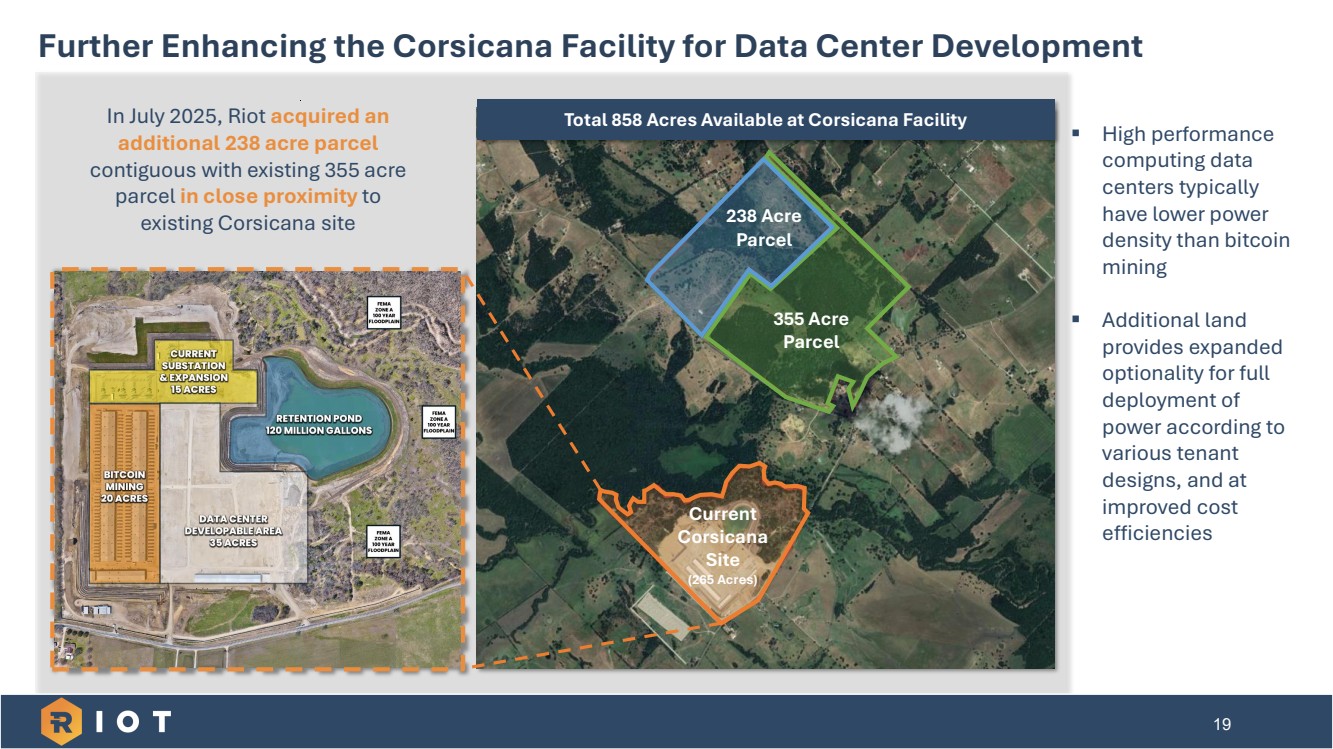
| 19 Further Enhancing the Corsicana Facility for Data Center Development ▪ High performance computing data centers typically have lower power density than bitcoin mining ▪ Additional land provides expanded optionality for full deployment of power according to various tenant designs, and at improved cost efficiencies Current Corsicana Site (265 Acres) 238 Acre Parcel 355 Acre Parcel In July 2025, Riot acquired an additional 238 acre parcel contiguous with existing 355 acre parcel in close proximity to existing Corsicana site Total 858 Acres Available at Corsicana Facility |
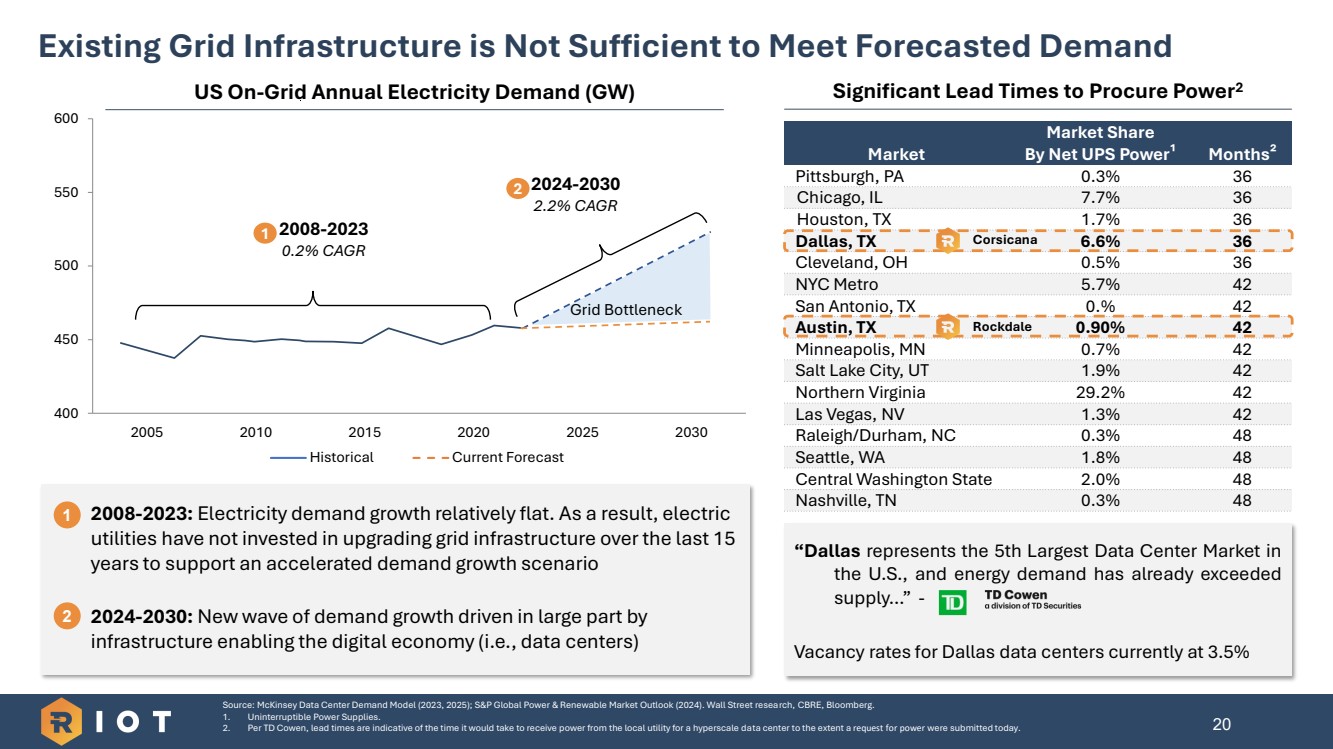
| Market Market Share By Net UPS Power¹ Months² Pittsburgh, PA 0.3% 36 Chicago, IL 7.7% 36 Houston, TX 1.7% 36 Dallas, TX 6.6% 36 Cleveland, OH 0.5% 36 NYC Metro 5.7% 42 San Antonio, TX 0.% 42 Austin, TX 0.90% 42 Minneapolis, MN 0.7% 42 Salt Lake City, UT 1.9% 42 Northern Virginia 29.2% 42 Las Vegas, NV 1.3% 42 Raleigh/Durham, NC 0.3% 48 Seattle, WA 1.8% 48 Central Washington State 2.0% 48 Nashville, TN 0.3% 48 20 2008-2023: Electricity demand growth relatively flat. As a result, electric utilities have not invested in upgrading grid infrastructure over the last 15 years to support an accelerated demand growth scenario 2024-2030: New wave of demand growth driven in large part by infrastructure enabling the digital economy (i.e., data centers) 400 450 500 550 600 2005 2010 2015 2020 2025 2030 Historical Current Forecast US On-Grid Annual Electricity Demand (GW) 1 2008-2023 0.2% CAGR 2 2024-2030 2.2% CAGR Grid Bottleneck Source: McKinsey Data Center Demand Model (2023, 2025); S&P Global Power & Renewable Market Outlook (2024). Wall Street research, CBRE, Bloomberg. 1. Uninterruptible Power Supplies. 2. Per TD Cowen, lead times are indicative of the time it would take to receive power from the local utility for a hyperscale data center to the extent a request for power were submitted today. Existing Grid Infrastructure is Not Sufficient to Meet Forecasted Demand 1 2 Significant Lead Times to Procure Power2 “Dallas represents the 5th Largest Data Center Market in the U.S., and energy demand has already exceeded supply…” - Vacancy rates for Dallas data centers currently at 3.5% Corsicana Rockdale |
| 21 VI Closing Remarks |

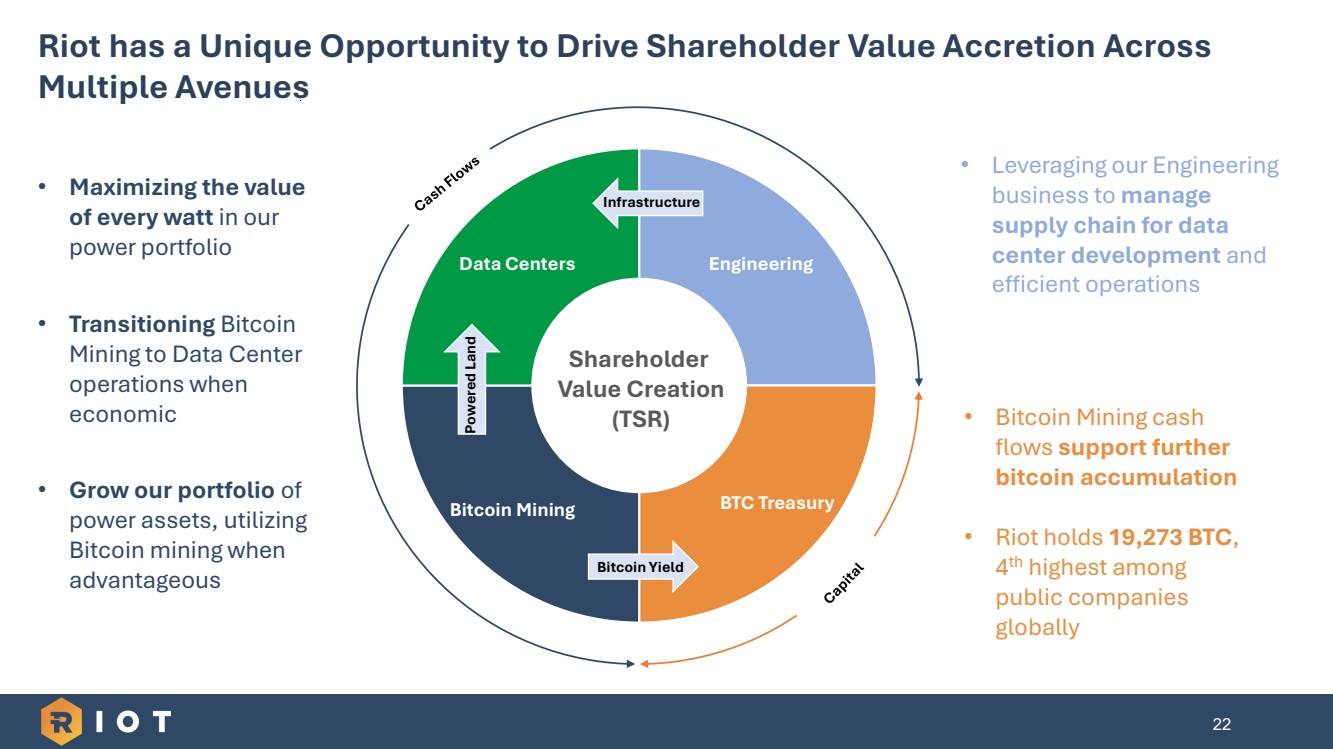
| 22 Riot has a Unique Opportunity to Drive Shareholder Value Accretion Across Multiple Avenues Engineering BTC Treasury Bitcoin Mining Data Centers Shareholder Value Creation (TSR) • Maximizing the value of every watt in our power portfolio • Transitioning Bitcoin Mining to Data Center operations when economic • Grow our portfolio of power assets, utilizing Bitcoin mining when advantageous • Leveraging our Engineering business to manage supply chain for data center development and efficient operations • Bitcoin Mining cash flows support further bitcoin accumulation • Riot holds 19,273 BTC, 4 th highest among public companies globally Bitcoin Yield Powered Land Infrastructure |
| 23 Appendix |
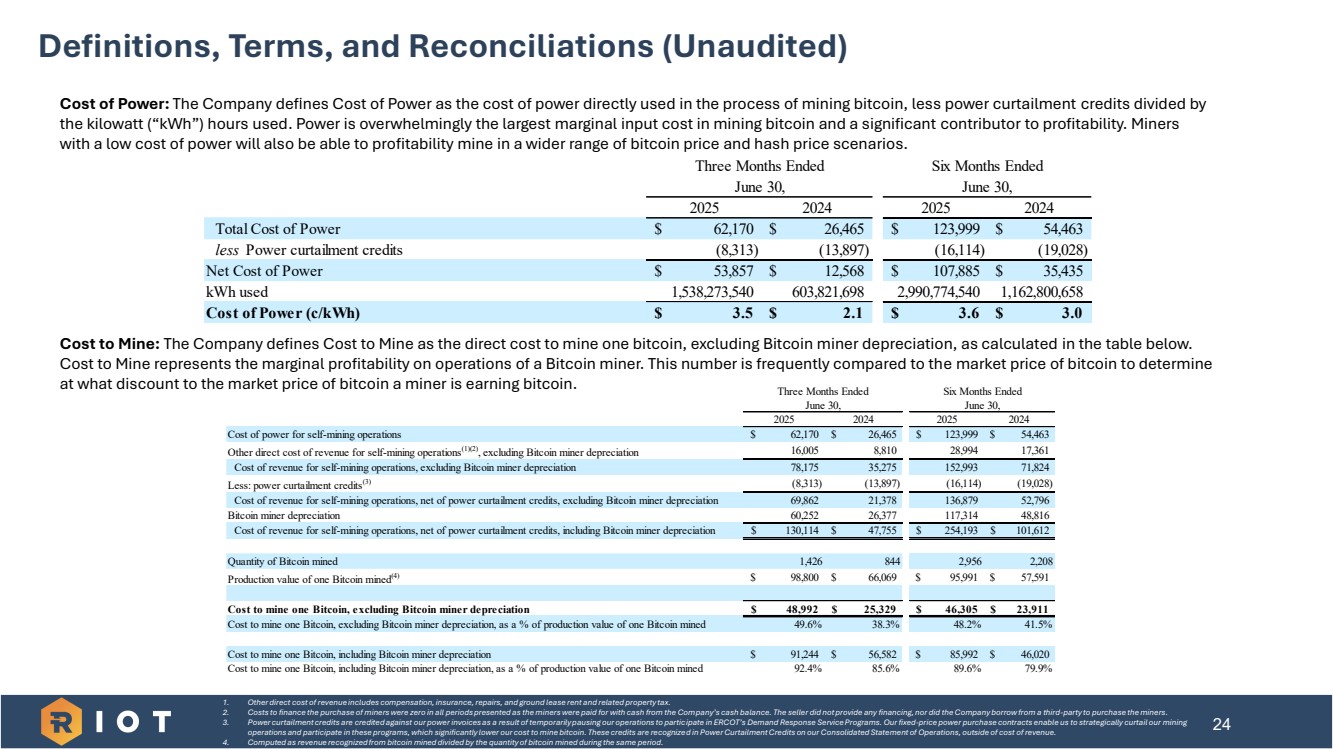
| 24 Definitions, Terms, and Reconciliations (Unaudited) 1. Other direct cost of revenue includes compensation, insurance, repairs, and ground lease rent and related property tax. 2. Costs to finance the purchase of miners were zero in all periods presented as the miners were paid for with cash from the Company’s cash balance. The seller did not provide any financing, nor did the Company borrow from a third-party to purchase the miners. 3. Power curtailment credits are credited against our power invoices as a result of temporarily pausing our operations to participate in ERCOT’s Demand Response Service Programs. Our fixed-price power purchase contracts enable us to strategically curtail our mining operations and participate in these programs, which significantly lower our cost to mine bitcoin. These credits are recognized in Power Curtailment Credits on our Consolidated Statement of Operations, outside of cost of revenue. 4. Computed as revenue recognized from bitcoin mined divided by the quantity of bitcoin mined during the same period. Cost of Power: The Company defines Cost of Power as the cost of power directly used in the process of mining bitcoin, less power curtailment credits divided by the kilowatt (“kWh”) hours used. Power is overwhelmingly the largest marginal input cost in mining bitcoin and a significant contributor to profitability. Miners with a low cost of power will also be able to profitability mine in a wider range of bitcoin price and hash price scenarios. Cost to Mine: The Company defines Cost to Mine as the direct cost to mine one bitcoin, excluding Bitcoin miner depreciation, as calculated in the table below. Cost to Mine represents the marginal profitability on operations of a Bitcoin miner. This number is frequently compared to the market price of bitcoin to determine at what discount to the market price of bitcoin a miner is earning bitcoin. 2025 2024 2025 2024 Cost of power for self-mining operations $ 62,170 $ 26,465 $ 123,999 $ 54,463 Other direct cost of revenue for self-mining operations(1)(2), excluding Bitcoin miner depreciation 16,005 8,810 28,994 17,361 Cost of revenue for self-mining operations, excluding Bitcoin miner depreciation 78,175 35,275 152,993 71,824 Less: power curtailment credits(3) (8,313) (13,897) (16,114) (19,028) Cost of revenue for self-mining operations, net of power curtailment credits, excluding Bitcoin miner depreciation 69,862 21,378 136,879 52,796 Bitcoin miner depreciation 60,252 26,377 117,314 48,816 Cost of revenue for self-mining operations, net of power curtailment credits, including Bitcoin miner depreciation $ 130,114 $ 47,755 $ 254,193 $ 101,612 Quantity of Bitcoin mined 1,426 844 2,956 2,208 Production value of one Bitcoin mined(4) $ 98,800 $ 66,069 $ 95,991 $ 57,591 Cost to mine one Bitcoin, excluding Bitcoin miner depreciation $ 48,992 $ 25,329 $ 46,305 $ 23,911 Cost to mine one Bitcoin, excluding Bitcoin miner depreciation, as a % of production value of one Bitcoin mined 49.6% 38.3% 48.2% 41.5% Cost to mine one Bitcoin, including Bitcoin miner depreciation $ 91,244 $ 56,582 $ 85,992 $ 46,020 Cost to mine one Bitcoin, including Bitcoin miner depreciation, as a % of production value of one Bitcoin mined 92.4% 85.6% 89.6% 79.9% Six Months Ended June 30, Three Months Ended June 30, 2025 2024 2025 2024 Total Cost of Power $ 62,170 $ 26,465 $ 123,999 $ 54,463 less Power curtailment credits (8,313) (13,897) (16,114) (19,028) Net Cost of Power $ 53,857 $ 12,568 $ 107,885 $ 35,435 kWh used 1,538,273,540 603,821,698 2,990,774,540 1,162,800,658 Cost of Power (c/kWh) $ 3.5 $ 2.1 $ 3.6 $ 3.0 Three Months Ended June 30, Six Months Ended June 30, |
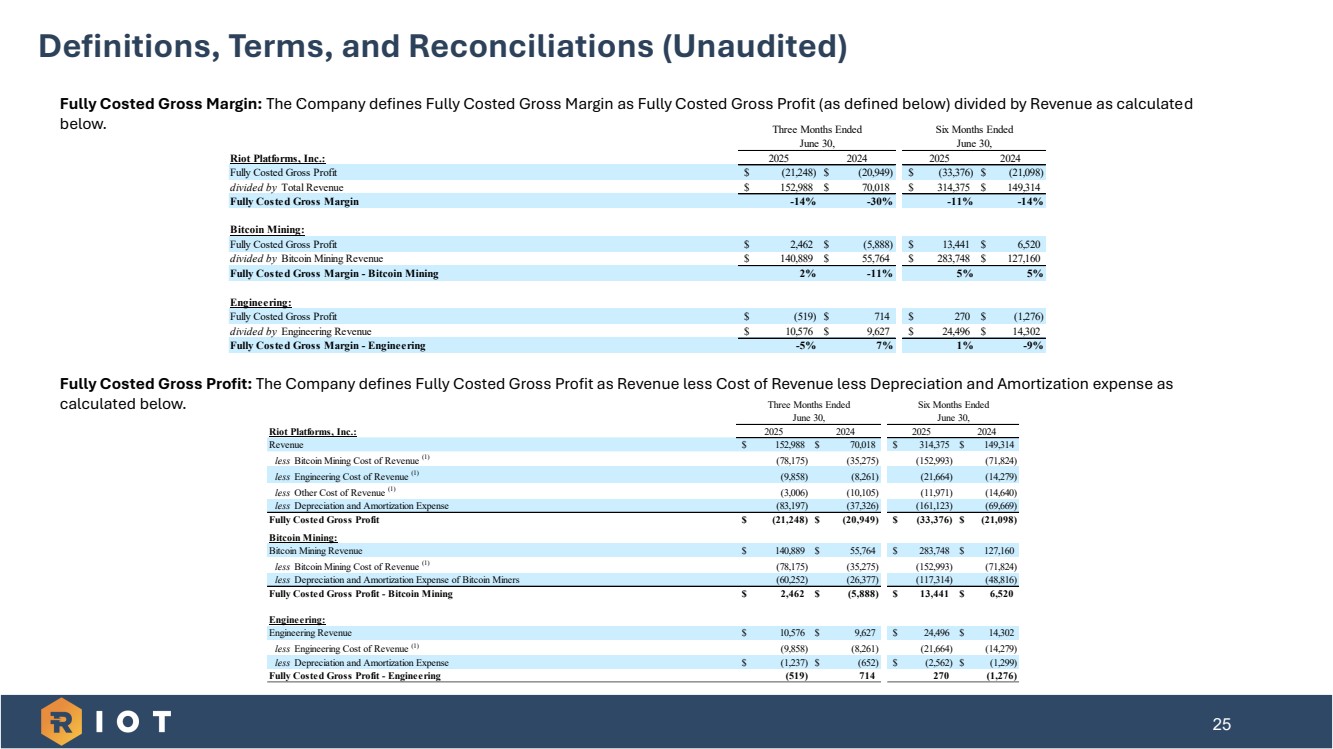
| Fully Costed Gross Margin: The Company defines Fully Costed Gross Margin as Fully Costed Gross Profit (as defined below) divided by Revenue as calculated below. Fully Costed Gross Profit: The Company defines Fully Costed Gross Profit as Revenue less Cost of Revenue less Depreciation and Amortization expense as calculated below. Riot Platforms, Inc.: 2025 2024 2025 2024 Revenue $ 152,988 $ 70,018 $ 314,375 $ 149,314 less Bitcoin Mining Cost of Revenue (1) (78,175) (35,275) (152,993) (71,824) less Engineering Cost of Revenue (1) (9,858) (8,261) (21,664) (14,279) less Other Cost of Revenue (1) (3,006) (10,105) (11,971) (14,640) less Depreciation and Amortization Expense (83,197) (37,326) (161,123) (69,669) Fully Costed Gross Profit $ (21,248) $ (20,949) $ (33,376) $ (21,098) Bitcoin Mining: Bitcoin Mining Revenue $ 140,889 $ 55,764 $ 283,748 $ 127,160 less Bitcoin Mining Cost of Revenue (1) (78,175) (35,275) (152,993) (71,824) less Depreciation and Amortization Expense of Bitcoin Miners (60,252) (26,377) (117,314) (48,816) Fully Costed Gross Profit - Bitcoin Mining $ 2,462 $ (5,888) $ 13,441 $ 6,520 Engineering: Engineering Revenue $ 10,576 $ 9,627 $ 24,496 $ 14,302 less Engineering Cost of Revenue (1) (9,858) (8,261) (21,664) (14,279) less Depreciation and Amortization Expense $ (1,237) $ (652) $ (2,562) $ (1,299) Fully Costed Gross Profit - Engineering (519) 714 270 (1,276) Six Months Ended June 30, Three Months Ended June 30, 25 Definitions, Terms, and Reconciliations (Unaudited) Riot Platforms, Inc.: 2025 2024 2025 2024 Fully Costed Gross Profit $ (21,248) $ (20,949) $ (33,376) $ (21,098) divided by Total Revenue $ 152,988 $ 70,018 $ 314,375 $ 149,314 Fully Costed Gross Margin -14% -30% -11% -14% Bitcoin Mining: Fully Costed Gross Profit $ 2,462 $ (5,888) $ 13,441 $ 6,520 divided by Bitcoin Mining Revenue $ 140,889 $ 55,764 $ 283,748 $ 127,160 Fully Costed Gross Margin - Bitcoin Mining 2 % -11% 5 % 5 % Engineering: Fully Costed Gross Profit $ (519) $ 714 $ 270 $ (1,276) divided by Engineering Revenue $ 10,576 $ 9,627 $ 24,496 $ 14,302 Fully Costed Gross Margin - Engineering -5% 7 % 1 % -9% Six Months Ended June 30, Three Months Ended June 30, |
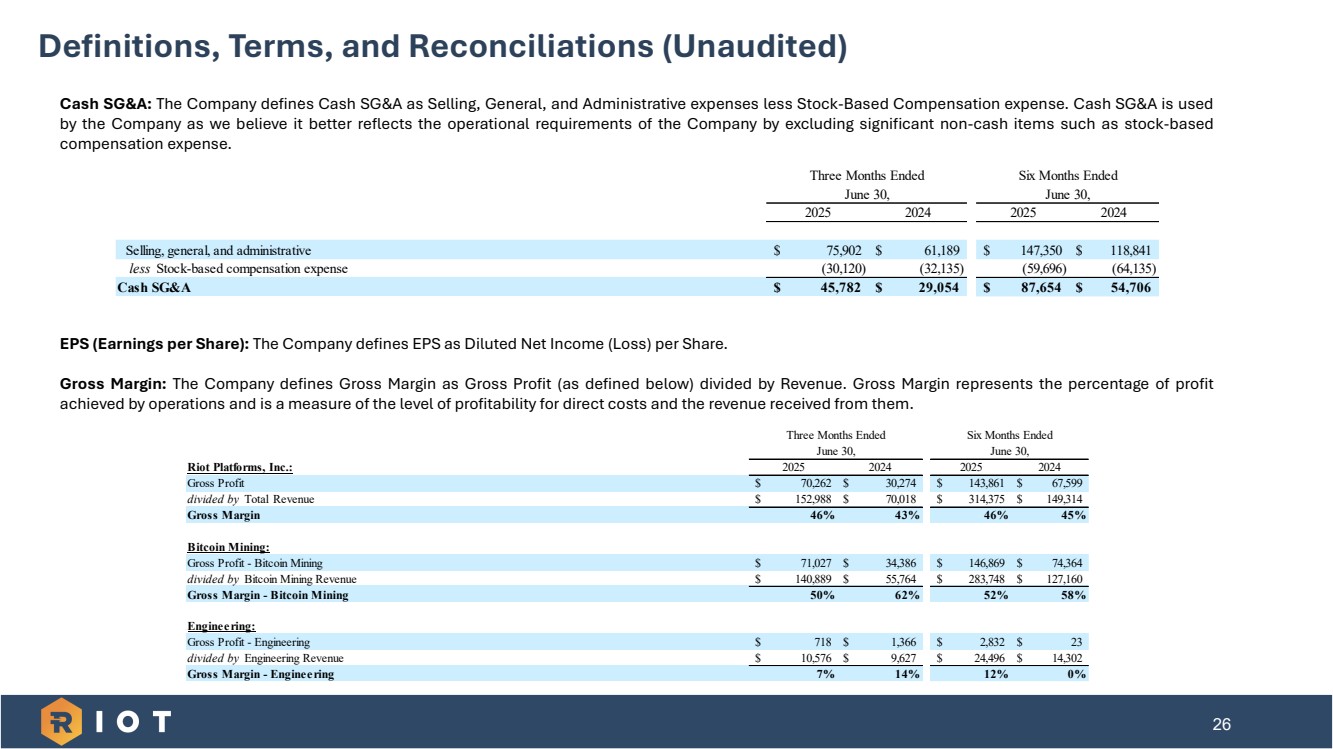
| 26 Definitions, Terms, and Reconciliations (Unaudited) Cash SG&A: The Company defines Cash SG&A as Selling, General, and Administrative expenses less Stock-Based Compensation expense. Cash SG&A is used by the Company as we believe it better reflects the operational requirements of the Company by excluding significant non-cash items such as stock-based compensation expense. EPS (Earnings per Share): The Company defines EPS as Diluted Net Income (Loss) per Share. Gross Margin: The Company defines Gross Margin as Gross Profit (as defined below) divided by Revenue. Gross Margin represents the percentage of profit achieved by operations and is a measure of the level of profitability for direct costs and the revenue received from them. 2025 2024 2025 2024 Selling, general, and administrative $ 75,902 $ 61,189 $ 147,350 $ 118,841 less Stock-based compensation expense (30,120) (32,135) (59,696) (64,135) Cash SG&A $ 45,782 $ 29,054 $ 87,654 $ 54,706 Six Months Ended June 30, Three Months Ended June 30, Riot Platforms, Inc.: 2025 2024 2025 2024 Gross Profit $ 70,262 $ 30,274 $ 143,861 $ 67,599 divided by Total Revenue $ 152,988 $ 70,018 $ 314,375 $ 149,314 Gross Margin 46% 43% 46% 45% Bitcoin Mining: Gross Profit - Bitcoin Mining $ 71,027 $ 34,386 $ 146,869 $ 74,364 divided by Bitcoin Mining Revenue $ 140,889 $ 55,764 $ 283,748 $ 127,160 Gross Margin - Bitcoin Mining 50% 62% 52% 58% Engineering: Gross Profit - Engineering $ 718 $ 1,366 $ 2,832 $ 23 divided by Engineering Revenue $ 10,576 $ 9,627 $ 24,496 $ 14,302 Gross Margin - Engineering 7 % 14% 12% 0 % Six Months Ended June 30, Three Months Ended June 30, |
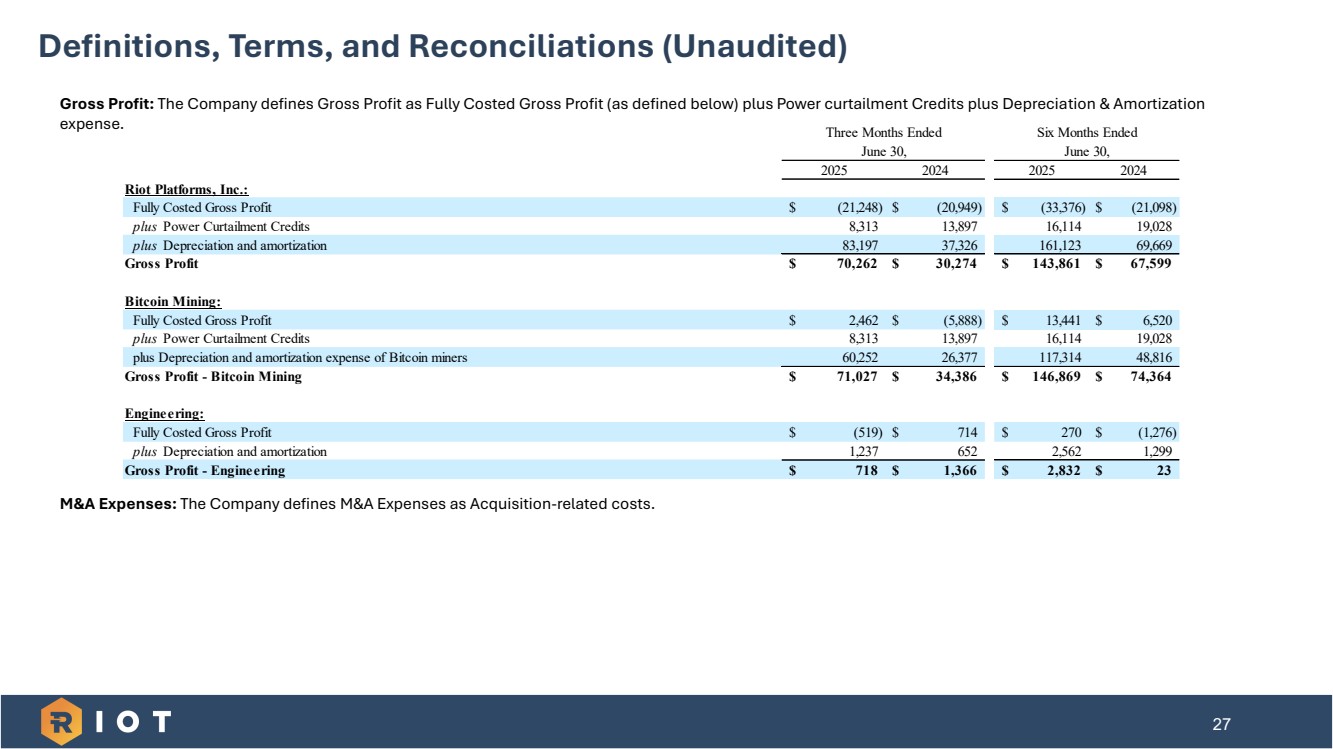
| 27 Definitions, Terms, and Reconciliations (Unaudited) Gross Profit: The Company defines Gross Profit as Fully Costed Gross Profit (as defined below) plus Power curtailment Credits plus Depreciation & Amortization expense. M&A Expenses: The Company defines M&A Expenses as Acquisition-related costs. 2025 2024 2025 2024 Riot Platforms, Inc.: Fully Costed Gross Profit $ (21,248) $ (20,949) $ (33,376) $ (21,098) plus Power Curtailment Credits 8,313 13,897 16,114 19,028 plus Depreciation and amortization 83,197 37,326 161,123 69,669 Gross Profit $ 70,262 $ 30,274 $ 143,861 $ 67,599 Bitcoin Mining: Fully Costed Gross Profit $ 2,462 $ (5,888) $ 13,441 $ 6,520 plus Power Curtailment Credits 8,313 13,897 16,114 19,028 plus Depreciation and amortization expense of Bitcoin miners 60,252 26,377 117,314 48,816 Gross Profit - Bitcoin Mining $ 71,027 $ 34,386 $ 146,869 $ 74,364 Engineering: Fully Costed Gross Profit $ (519) $ 714 $ 270 $ (1,276) plus Depreciation and amortization 1,237 652 2,562 1,299 Gross Profit - Engineering $ 718 $ 1,366 $ 2,832 $ 2 3 Six Months Ended June 30, Three Months Ended June 30, |
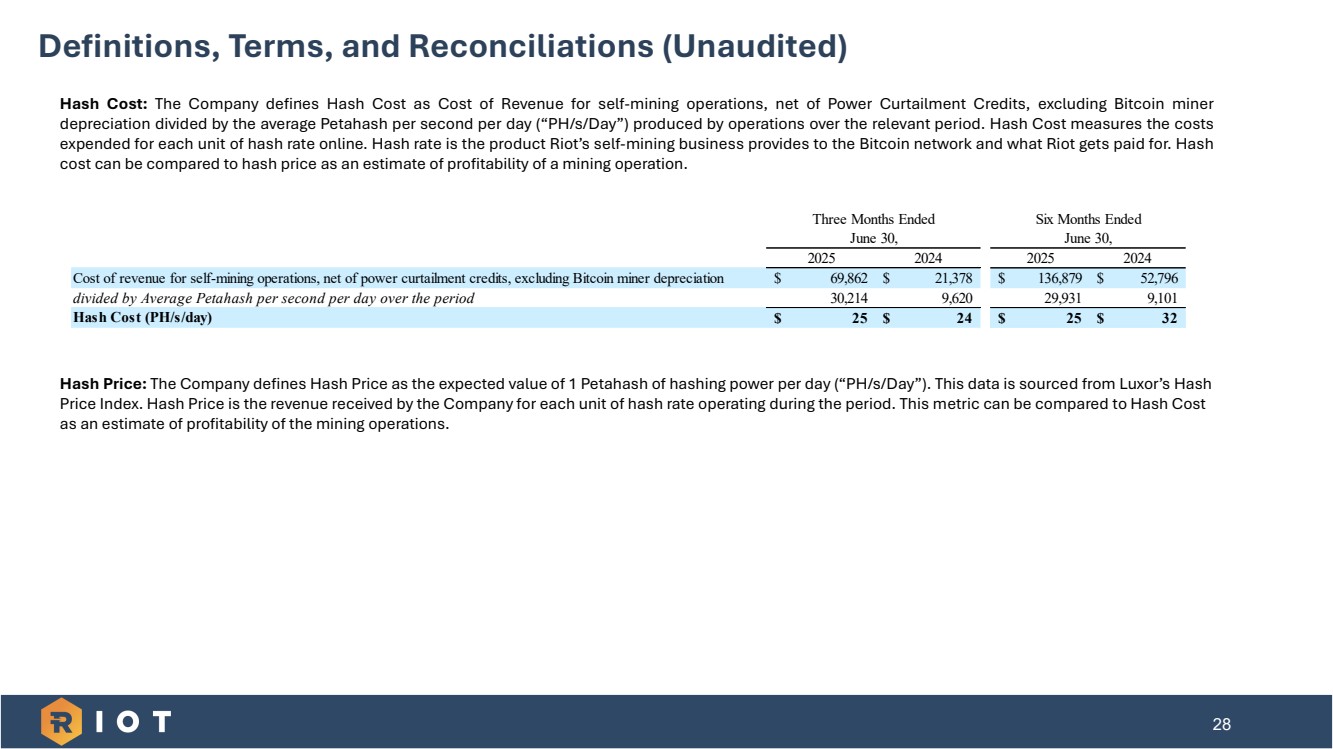
| 28 Definitions, Terms, and Reconciliations (Unaudited) Hash Cost: The Company defines Hash Cost as Cost of Revenue for self-mining operations, net of Power Curtailment Credits, excluding Bitcoin miner depreciation divided by the average Petahash per second per day (“PH/s/Day”) produced by operations over the relevant period. Hash Cost measures the costs expended for each unit of hash rate online. Hash rate is the product Riot’s self-mining business provides to the Bitcoin network and what Riot gets paid for. Hash cost can be compared to hash price as an estimate of profitability of a mining operation. Hash Price: The Company defines Hash Price as the expected value of 1 Petahash of hashing power per day (“PH/s/Day”). This data is sourced from Luxor’s Hash Price Index. Hash Price is the revenue received by the Company for each unit of hash rate operating during the period. This metric can be compared to Hash Cost as an estimate of profitability of the mining operations. 2025 2024 2025 2024 Cost of revenue for self-mining operations, net of power curtailment credits, excluding Bitcoin miner depreciation $ 69,862 $ 21,378 $ 136,879 $ 52,796 divided by Average Petahash per second per day over the period 30,214 9,620 29,931 9,101 Hash Cost (PH/s/day) $ 2 5 $ 2 4 $ 2 5 $ 3 2 Six Months Ended June 30, Three Months Ended June 30, |
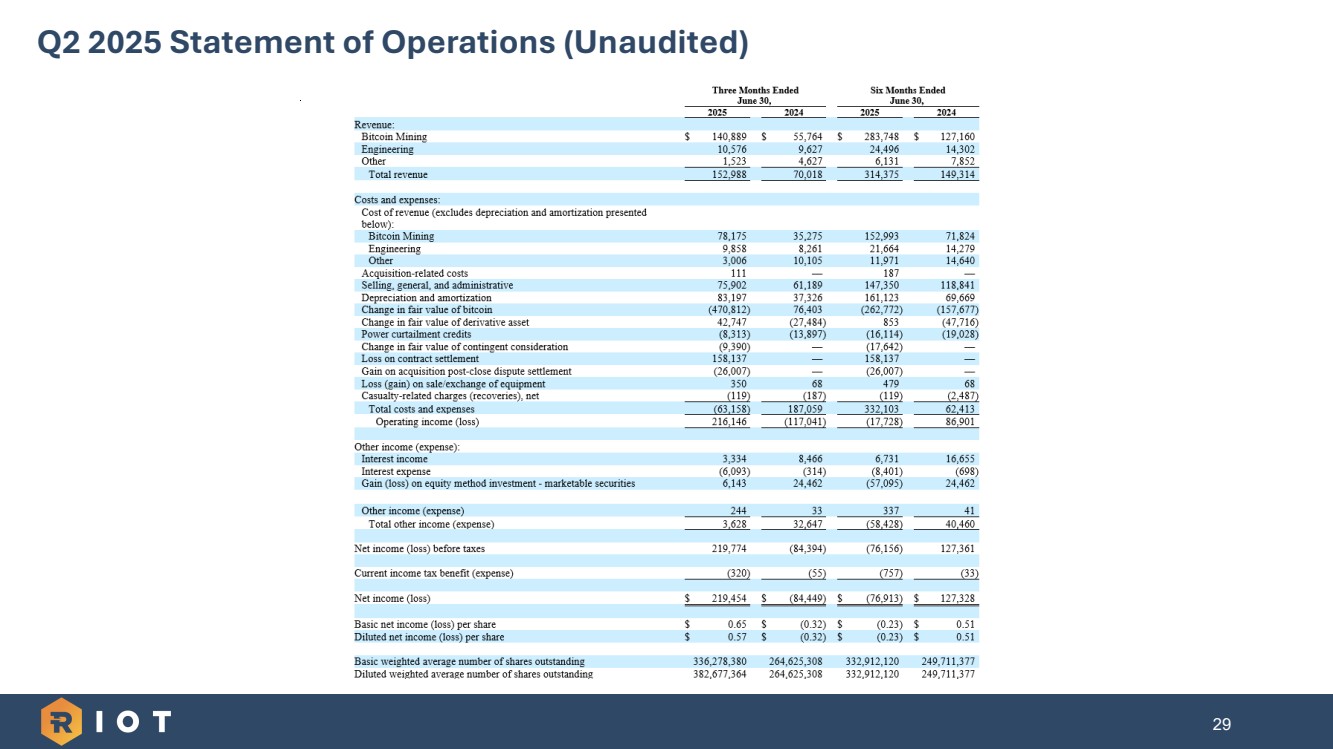
| 29 Q2 2025 Statement of Operations (Unaudited) |
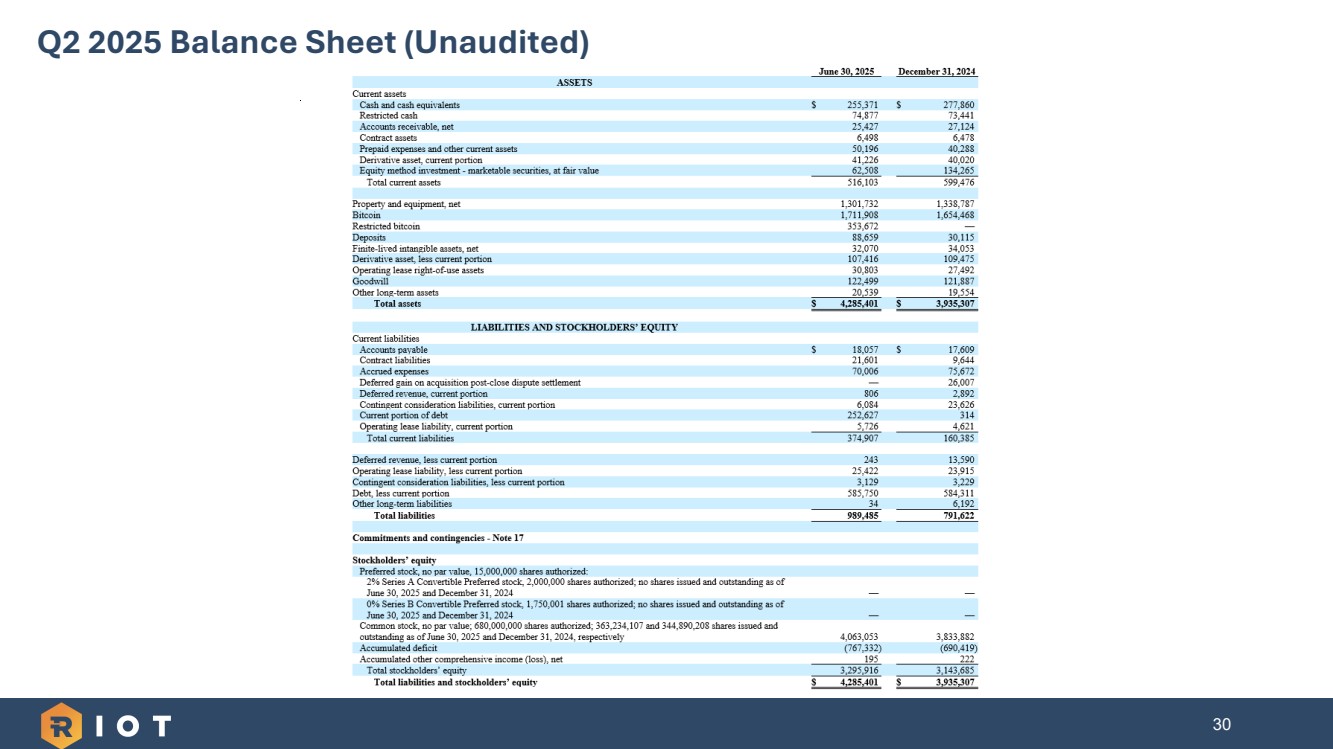
| 30 Q2 2025 Balance Sheet (Unaudited) |
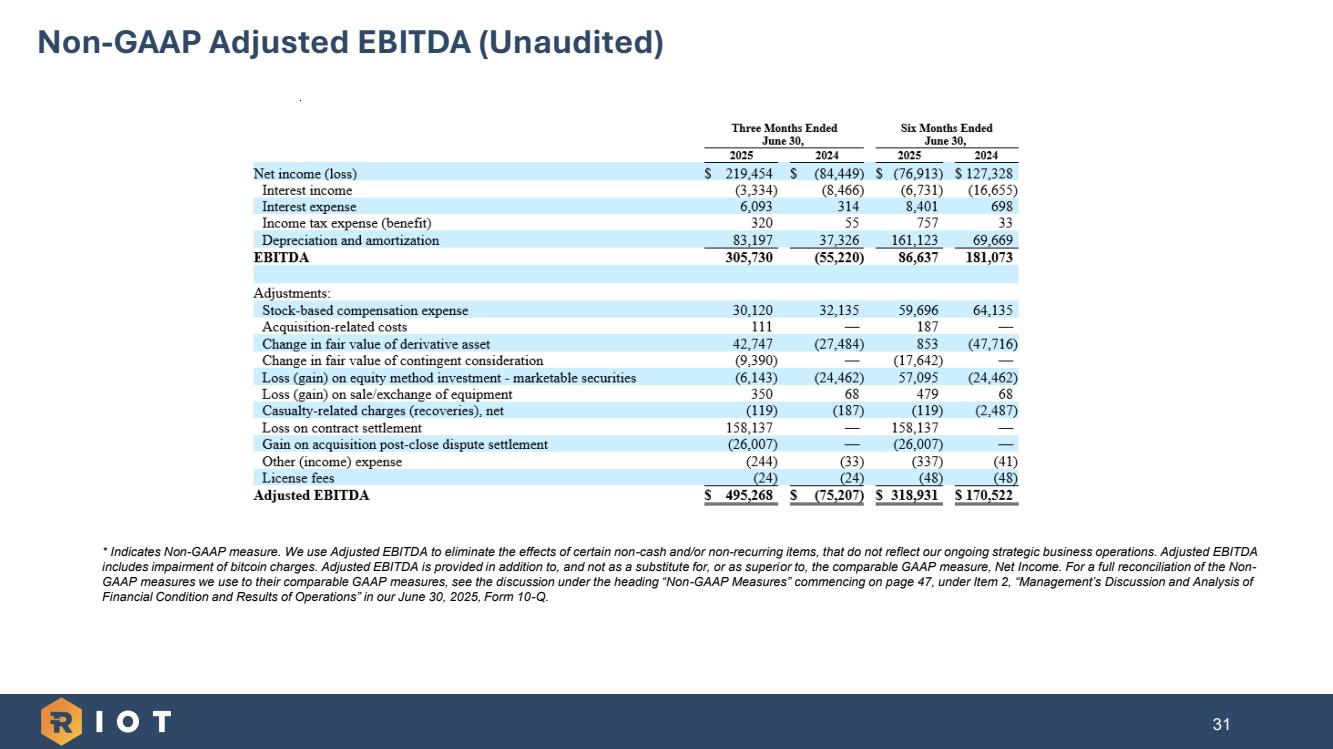
| 31 * Indicates Non-GAAP measure. We use Adjusted EBITDA to eliminate the effects of certain non-cash and/or non-recurring items, that do not reflect our ongoing strategic business operations. Adjusted EBITDA includes impairment of bitcoin charges. Adjusted EBITDA is provided in addition to, and not as a substitute for, or as superior to, the comparable GAAP measure, Net Income. For a full reconciliation of the Non-GAAP measures we use to their comparable GAAP measures, see the discussion under the heading “Non-GAAP Measures” commencing on page 47, under Item 2, “Management’s Discussion and Analysis of Financial Condition and Results of Operations” in our June 30, 2025, Form 10-Q. Non-GAAP Adjusted EBITDA (Unaudited) |
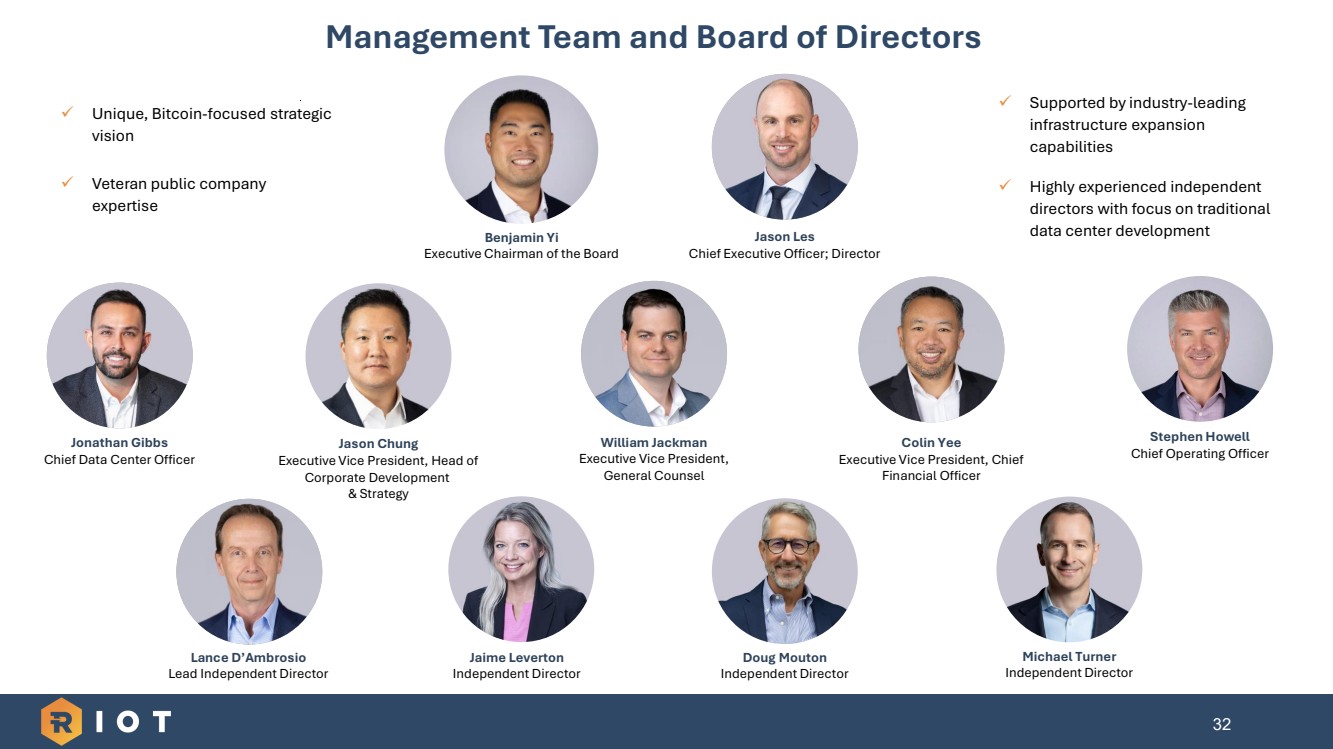
| 32 Management Team and Board of Directors ✓ Unique, Bitcoin-focused strategic vision ✓ Veteran public company expertise Jason Les Chief Executive Officer; Director Benjamin Yi Executive Chairman of the Board William Jackman Executive Vice President, General Counsel Colin Yee Executive Vice President, Chief Financial Officer Lance D’Ambrosio Lead Independent Director Jason Chung Executive Vice President, Head of Corporate Development & Strategy ✓ Supported by industry-leading infrastructure expansion capabilities ✓ Highly experienced independent directors with focus on traditional data center development Stephen Howell Chief Operating Officer Jaime Leverton Independent Director Doug Mouton Independent Director Michael Turner Independent Director Jonathan Gibbs Chief Data Center Officer |
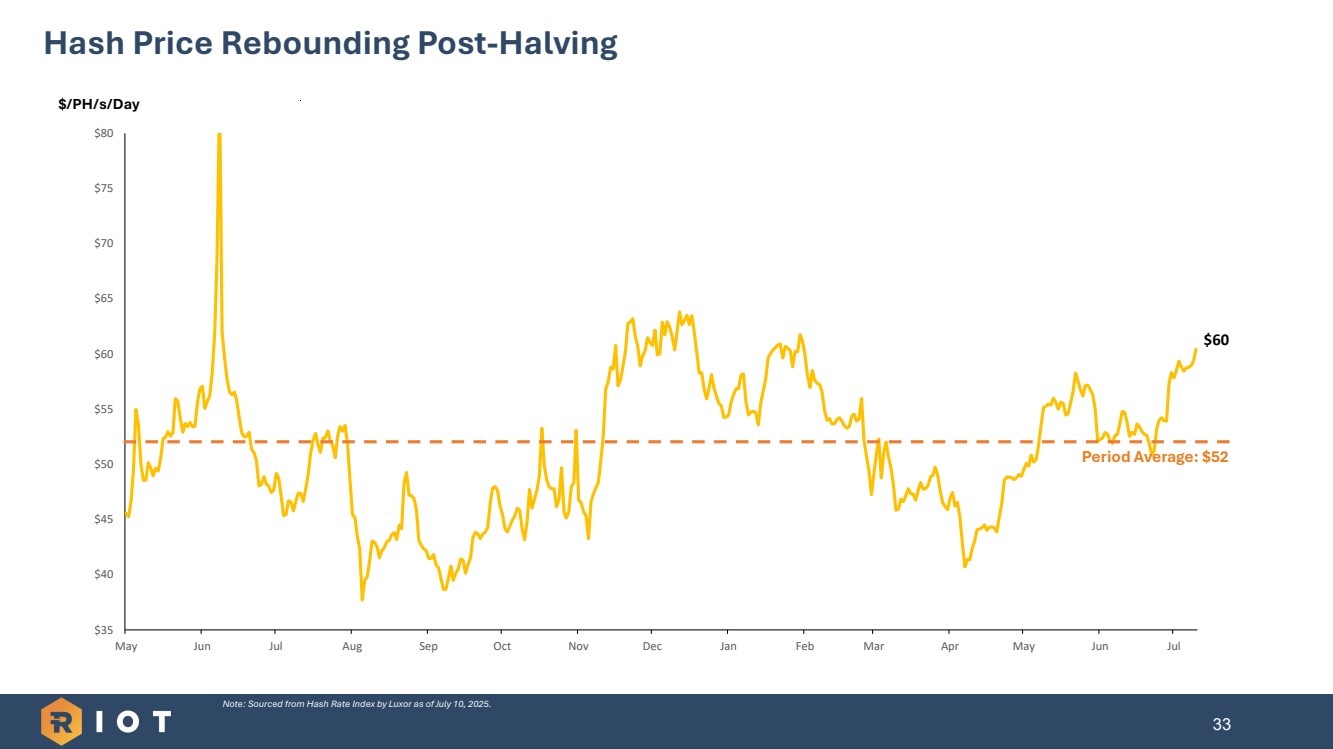
| Hash Price Rebounding Post-Halving 33 1 $60 $35 $40 $45 $50 $55 $60 $65 $70 $75 $80 May Jun Jul Aug Sep Oct Nov Dec Jan Feb Mar Apr May Jun Jul $/PH/s/Day Period Average: $52 Note: Sourced from Hash Rate Index by Luxor as of July 10, 2025. |