Freddie Mac Reports Net Income of $2.4 Billion for Second Quarter 2025
Making Home Possible for 363,000 Households in Second Quarter 2025
•Financed 264,000 mortgages, with 53% of eligible loans affordable to low- to moderate-income families.
•First-time homebuyers represented 53% of new single-family home purchase loans.
•Financed 99,000 rental units, with 95% of eligible units affordable to low- to moderate-income families.
Second Quarter 2025 Financial Results
| | | | | | | | | | | | | | | | | | | | |
| During Second Quarter 2025 | | As of June 30, 2025 |
Market Liquidity Provided - $106 Billion | | Homes and Rental Units Financed - 363,000 | |
Net Worth - $65 Billion
| | Total Mortgage Portfolio - $3.6 Trillion |
| | | | | | | | | | | | | | |
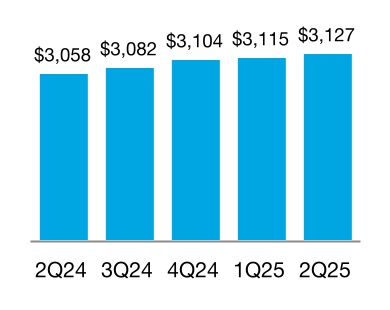
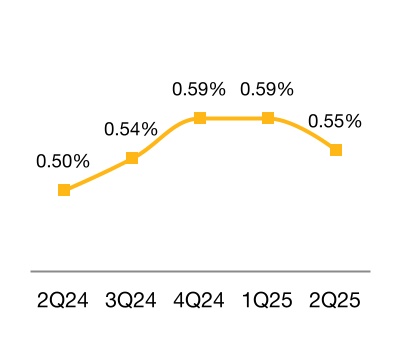
| Consolidated | | •Net income of $2.4 billion, down 14% year-over-year, primarily driven by an increase in the provision for credit losses. •Net revenues of $5.9 billion, a decrease of 1% year-over-year, primarily driven by lower non-interest income, partially offset by higher net interest income. •Provision for credit losses of $0.8 billion, primarily driven by a credit reserve build in Single-Family. •New business activity of $94 billion, up from $85 billion in the second quarter of 2024. •Mortgage portfolio of $3.1 trillion, up 2% year-over-year. •Serious delinquency rate of 0.55%, down from 0.59% at December 31, 2024 and up from 0.50% at June 30, 2024. •Completed approximately 24,000 loan workouts.
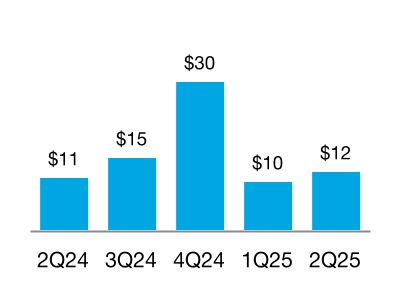
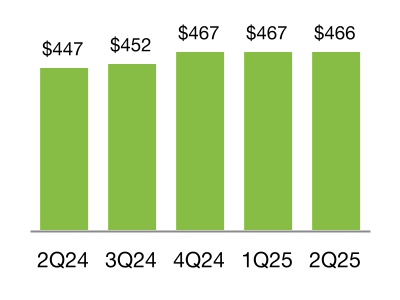
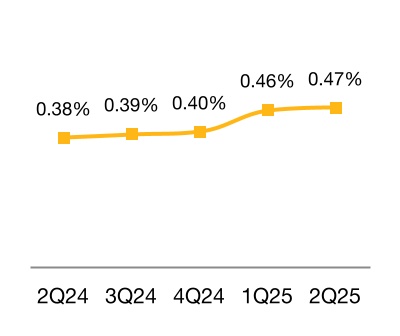
•New business activity of $12 billion, up from $11 billion in the second quarter of 2024. •Mortgage portfolio of $466 billion, up 4% year-over-year. •Delinquency rate of 0.47%, up from 0.40% at December 31, 2024 and up from 0.38% at June 30, 2024.
| | "U.S. Federal Housing is transforming Freddie Mac, making it more efficient and effective, and improving productivity over time. We grew the business in the second quarter, with our mortgage portfolio ending at $3.6 trillion. Earnings for the quarter reflected that growth, as well as the reserve we added to manage our portfolio safely and soundly. The quarter’s $2.4 billion of earnings further enhanced our safety, taking Freddie Mac’s net worth to nearly $65 billion. Overall, the company served more than 360,000 homebuyers and renters in the quarter, with 53% of the homes and 95% of rental units affordable to low- and middle-class families."
William J. Pulte, Director, U.S. Federal Housing and Chair of the Board of Directors, Freddie Mac |
| |
Net Revenues $5.9 Billion Net Income $2.4 Billion Comprehensive Income $2.4 Billion | | |
| | |
Single-Family | | |
| |
Net Revenues $5.1 Billion Net Income $2.1 Billion Comprehensive Income $2.1 Billion | | |
| | |
Multifamily | | |
| |
Net Revenues $0.8 Billion Net Income $0.3 Billion Comprehensive Income $0.3 Billion | | |
Freddie Mac Second Quarter 2025 Financial Results
July 31, 2025
Page 2
McLean, VA — Freddie Mac (OTCQB: FMCC) today reported net income of $2.4 billion for the second quarter of 2025, down 14% from the second quarter of 2024, primarily driven by an increase in the provision for credit losses.
Net revenues were $5.9 billion for the second quarter of 2025, down 1% year-over-year, primarily driven by lower non-interest income, partially offset by higher net interest income. Net interest income for the second quarter of 2025 was $5.3 billion, up 8% year-over-year, primarily driven by continued mortgage portfolio growth and lower funding costs, partially offset by lower yields on short-term investments. Non-interest income for the second quarter of 2025 was $0.6 billion, down 42% year-over-year, primarily driven by Multifamily.
Provision for credit losses was $0.8 billion for the second quarter of 2025, primarily driven by a credit reserve build in Single-Family attributable to lower estimated market values of single-family properties based on the company's internal house price index and lower forecasted house price growth rates. The provision for credit losses of $0.4 billion for the second quarter of 2024 was primarily driven by a credit reserve build in Single-Family attributable to new acquisitions.
Summary of Consolidated Statements of Income and Comprehensive Income | | | | | | | | | | | | | | | | | | | | | | | | | | | | | | | | |
(Dollars in millions) | | 2Q 2025 | | 1Q 2025 | | Change | | 2Q 2024 | | Change |
| Net interest income | | $5,299 | | $5,102 | | $197 | | $4,928 | | $371 |
| Non-interest income | | 617 | | 750 | | (133) | | 1,060 | | (443) |
| Net revenues | | 5,916 | | 5,852 | | 64 | | 5,988 | | | (72) |
| (Provision) benefit for credit losses | | (783) | | (280) | | (503) | | (394) | | | (389) |
| Non-interest expense | | (2,158) | | (2,088) | | (70) | | (2,134) | | (24) |
| Income before income tax expense | | 2,975 | | 3,484 | | (509) | | 3,460 | | | (485) |
| Income tax expense | | (588) | | (690) | | 102 | | (695) | | | 107 |
| Net income | | 2,387 | | 2,794 | | (407) | | 2,765 | | (378) |
| Other comprehensive income (loss), net of taxes and reclassification adjustments | | 21 | | 34 | | (13) | | (5) | | | 26 |
| Comprehensive income | | $2,408 | | $2,828 | | ($420) | | $2,760 | | ($352) |
|
| Conservatorship metrics (in millions) | | | | | | | | | | |
| Net worth | | $64,811 | | $62,403 | | $2,408 | | $53,223 | | $11,588 |
| Senior preferred stock liquidation preference | | 135,051 | | 132,223 | | 2,828 | | 123,111 | | 11,940 |
| Remaining Treasury funding commitment | | 140,162 | | 140,162 | | — | | 140,162 | | — |
| Cumulative dividend payments to Treasury | | 119,680 | | 119,680 | | — | | 119,680 | | — |
| Cumulative draws from Treasury | | 71,648 | | 71,648 | | — | | 71,648 | | — |
| | | | | | | | | | |
| | | | | | | | | | |
| | | | | | | | | | |
| | | | | | | | | | |
| | | | | | | | | | |
| | | | | | | | | | |
| | | | | | | | | | |
| | | | | | | | | | |
| | | | | | | | | | |
| | | | | | | | | | |
| | | | | | | | | | |
| | | | | | | | | | |
| | | | | | | | | | |
| | | | | | | | | | |
| | | | | | | | | | |
| | | | | | | | | | |
| | | | | | | | | | |
| | | | | | | | | | |
| | | | | | | | | | |
| | | | | | | | | | |
Freddie Mac Second Quarter 2025 Financial Results
July 31, 2025
Page 3
| | |
| Single-Family Segment |
| Financial Results |
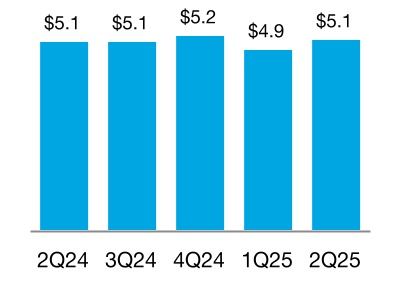
Net Revenues
(In billions)
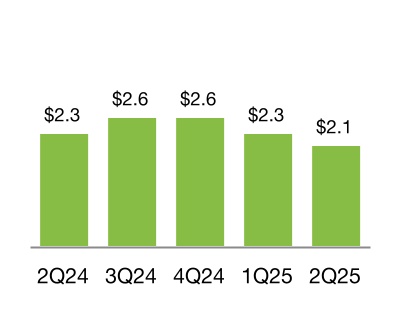
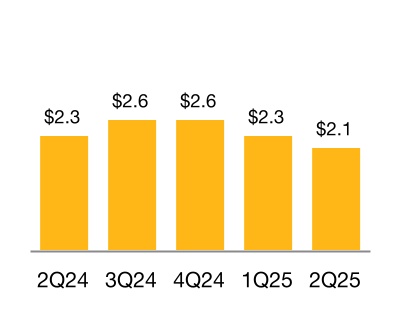
Comprehensive Income
(In billions)
| | | | | | | | | | | | | | | | | | | | | | | | | | | | | | | | |
| (Dollars in millions) | | 2Q 2025 | | 1Q 2025 | | Change | | 2Q 2024 | | Change |
| Net interest income | | $4,898 | | $4,753 | | $145 | | $4,635 | | $263 |
| Non-interest income | | 237 | | 165 | | 72 | | 459 | | (222) |
| Net revenues | | 5,135 | | 4,918 | | 217 | | 5,094 | | 41 |
| (Provision) benefit for credit losses | | (622) | | (228) | | (394) | | (315) | | (307) |
| Non-interest expense | | (1,905) | | (1,871) | | (34) | | (1,921) | | 16 |
| Income before income tax expense | | 2,608 | | 2,819 | | (211) | | 2,858 | | (250) |
| Income tax expense | | (516) | | (558) | | 42 | | (574) | | 58 |
| Net income | | 2,092 | | 2,261 | | (169) | | 2,284 | | (192) |
| Other comprehensive income (loss), net of taxes and reclassification adjustments | | 9 | | 8 | | 1 | | (5) | | 14 | |
| Comprehensive income | | $2,101 | | $2,269 | | ($168) | | $2,279 | | ($178) |
Second Quarter 2025
Net income of $2.1 billion, down 8% year-over-year.
•Net revenues were $5.1 billion, up 1% year-over year. Net interest income was $4.9 billion, up 6% year-over-year, primarily driven by continued mortgage portfolio growth and lower funding costs, partially offset by lower yields on short-term investments.
•Provision for credit losses was $0.6 billion for the second quarter of 2025, primarily driven by a credit reserve build attributable to lower estimated market values of single-family properties based on the company's internal house price index and lower forecasted house price growth rates. The provision for credit losses of $0.3 billion for the second quarter of 2024 was primarily driven by a credit reserve build attributable to new acquisitions.
Freddie Mac Second Quarter 2025 Financial Results
July 31, 2025
Page 4
| | |
| Single-Family Segment |
| Business Results |
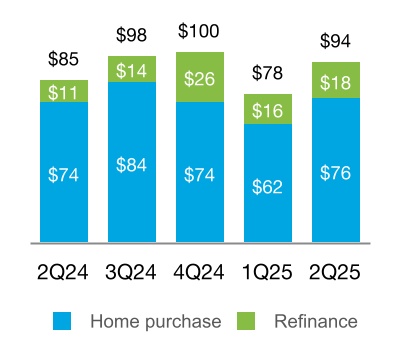
New Business Activity
(UPB in billions)
Mortgage Portfolio
(UPB in billions)
| | | | | | | | | | | | | | | | | | | | | | | | | | | | | | | | |
| | 2Q 2025 | | 1Q 2025 | | Change | | 2Q 2024 | | Change |
| New Business Statistics: | | | | | | | | | | |
| Single-Family homes funded (in thousands) | | 264 | | | 224 | | | 40 | | 257 | | 7 |
| Purchase borrowers (in thousands) | | 206 | | | 171 | | | 35 | | 212 | | (6) |
| Refinance borrowers (in thousands) | | 58 | | | 53 | | | 5 | | 45 | | 13 |
Affordable to low- to moderate-income families (%)(1)(2) | | 53 | | | 53 | | | — | | | 53 | | | — | |
First-time homebuyers (%)(3) | | 53 | | | 52 | | | 1 | | | 53 | | | — | |
| Average estimated guarantee fee rate (bps) | | 54 | | | 54 | | | — | | 54 | | — |
| Weighted average original loan-to-value (LTV) (%) | | 77 | | | 77 | | | — | | | 78 | | | (1) | |
| Weighted average original credit score | | 759 | | | 756 | | | 3 | | 754 | | 5 |
| Portfolio Statistics: | | | | | | | | | | |
| Average estimated guarantee fee rate (bps) | | 49 | | 49 | | — | | 49 | | — |
| Weighted average current LTV (%) | | 53 | | | 52 | | | 1 | | | 52 | | | 1 | |
| Weighted average current credit score | | 754 | | 754 | | — | | 755 | | (1) |
| Loan count (in millions) | | 13.9 | | 13.9 | | — | | 13.8 | | 0.1 |
| Credit-Related Statistics: | | | | | | | | | | |
| Loan workout activity (in thousands) | | 24 | | 25 | | (1) | | 18 | | 6 |
Allowance for credit losses to total loans outstanding (%)(4) | | 0.23 | | | 0.21 | | | 0.02 | | | 0.21 | | | 0.02 | |
| Credit enhancement coverage (%) | | 62 | | | 62 | | | — | | | 62 | | | — | |
(1) Eligible loans acquired affordable to families earning at or below 120% of area median income (AMI).
(2) First quarter 2025 data revised to reflect results based on updated AMI data provided by FHFA in the second quarter of 2025.
(3) Calculated as a percentage of purchase borrowers with loans secured by primary residences.
(4) Calculated as the allowance for credit losses on mortgage loans held-for-investment divided by the amortized cost basis of mortgage loans held-for-investment for which the fair value option has not been elected.
Business Highlights
•New business activity of $94 billion, up from $85 billion in the second quarter of 2024, primarily driven by an increase in refinance activity. Financed 264,000 mortgages and enabled 100,000 first-time homebuyers to purchase a home.
Freddie Mac Second Quarter 2025 Financial Results
July 31, 2025
Page 5
| | |
| Multifamily Segment |
Financial Results |
Net Revenues
(In billions)
Net Income
(In billions)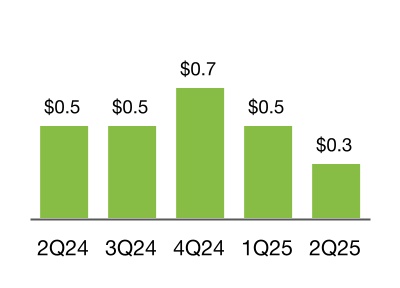
Comprehensive Income
(In billions)
| | | | | | | | | | | | | | | | | | | | | | | | | | | | | | | | |
| (Dollars in millions) | | 2Q 2025 | | 1Q 2025 | | Change | | 2Q 2024 | | Change |
| Net interest income | | $401 | | $349 | | $52 | | $293 | | $108 |
| Non-interest income | | 380 | | 585 | | (205) | | 601 | | (221) |
| Net revenues | | 781 | | 934 | | (153) | | 894 | | | (113) |
| (Provision) benefit for credit losses | | (161) | | (52) | | (109) | | (79) | | | (82) |
| Non-interest expense | | (253) | | (217) | | (36) | | (213) | | | (40) |
| Income before income tax expense | | 367 | | 665 | | (298) | | 602 | | | (235) |
| Income tax expense | | (72) | | (132) | | 60 | | (121) | | | 49 |
| Net income | | 295 | | 533 | | (238) | | 481 | | | (186) |
| Other comprehensive income (loss), net of taxes and reclassification adjustments | | 12 | | 26 | | (14) | | — | | | 12 |
| Comprehensive income | | $307 | | $559 | | ($252) | | $481 | | ($174) |
Second Quarter 2025
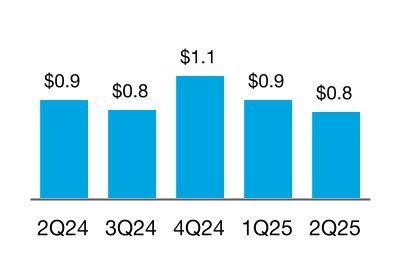
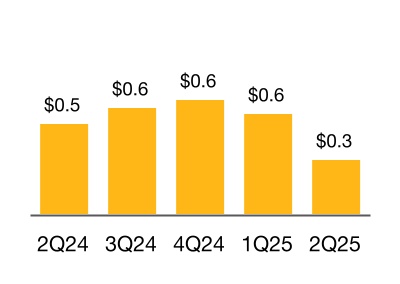
Net income of $0.3 billion, down 39% year-over-year.
•Net revenues were $0.8 billion for the second quarter of 2025, down 13% year-over-year.
◦Net interest income was $0.4 billion, up 37% year-over-year, primarily driven by the change in the company's Multifamily business strategy that resulted in an increase in the volume of fully guaranteed securitizations.
◦Non-interest income was $0.4 billion, down 37% year-over-year, primarily driven by lower revenues from held-for-sale loan purchase and securitization activities and impacts from interest-rate risk management activities.
•Provision for credit losses was $0.2 billion for the second quarter of 2025, primarily driven by a credit reserve build attributable to new loan purchase commitment and acquisition activity, coupled with deterioration in the credit performance of certain delinquent loans.
Freddie Mac Second Quarter 2025 Financial Results
July 31, 2025
Page 6
| | |
| Multifamily Segment |
| Business Results |
New Business Activity
(UPB in billions)
Mortgage Portfolio
(UPB in billions)
| | | | | | | | | | | | | | | | | | | | | | | | | | | | | | | | |
| | 2Q 2025 | | 1Q 2025 | | Change | | 2Q 2024 | | Change |
| New Business Statistics: | | | | | | | | | | |
Number of rental units financed (in thousands)(1) | | 99 | | 89 | | 10 | | 92 | | 7 |
Affordable to low-income families (%)(2)(4) | | 74 | | | 75 | | | (1) | | | 65 | | | 9 | |
Affordable to low- to moderate-income families (%)(3)(4) | | 95 | | | 94 | | | 1 | | | 93 | | | 2 | |
| Weighted average original LTV (%) | | 62 | | | 62 | | | — | | | 61 | | 1 | |
Weighted average original debt service coverage ratio(5) | | 1.34 | | 1.30 | | 0.04 | | 1.28 | | 0.06 |
| Securitization Statistics: | | | | | | | | | | |
| Securitization issuance (UPB in billions) | | $14 | | $16 | | ($2) | | $11 | | $3 |
| Senior subordinate | | 9 | | 7 | | | 2 | | 7 | | 2 |
| Fully guaranteed | | 5 | | 9 | | | (4) | | 4 | | 1 |
| Portfolio Statistics: | | | | | | | | | | |
| Average guarantee fee rate charged (bps) at period end | | 53 | | 52 | | 1 | | 48 | | 5 |
| Credit-Related Statistics: | | | | | | | | | | |
Allowance for credit losses to total loans outstanding (%)(6) | | 0.52 | | | 0.49 | | | 0.03 | | | 0.61 | | | (0.09) | |
| Credit enhancement coverage (%) | | 92 | | | 93 | | | (1) | | | 95 | | | (3) | |
(1) Includes rental units financed by supplemental loans.
(2) Eligible units acquired affordable to families earning at or below 80% of AMI.
(3) Eligible units acquired affordable to families earning at or below 120% of AMI.
(4) First quarter 2025 data revised to reflect results based on updated AMI data provided by FHFA in the second quarter of 2025.
(5) Assumes monthly payments that reflect amortization of principal.
(6) Calculated as the allowance for credit losses on mortgage loans held-for-investment divided by the amortized cost basis of mortgage loans held-for-investment for which the fair value option has not been elected.
Business Highlights
•The company provided financing for 99,000 multifamily rental units in the second quarter of 2025. 74% of the eligible multifamily rental units financed in the second quarter of 2025 were affordable to low-income families.
•The Multifamily delinquency rate increased to 0.47% at June 30, 2025, from 0.38% at June 30, 2024, primarily driven by an increase in delinquent floating rate loans and small balance loans.
Freddie Mac Second Quarter 2025 Financial Results
July 31, 2025
Page 7
About Freddie Mac’s Conservatorship
Since September 2008, Freddie Mac has been operating under conservatorship with FHFA as Conservator. The support provided by Treasury pursuant to the Purchase Agreement enables the company to maintain access to the debt markets and have adequate liquidity to conduct its normal business operations. The amount of funding available to Freddie Mac under the Purchase Agreement was $140.2 billion at June 30, 2025.
Pursuant to the Purchase Agreement, Freddie Mac will not be required to pay a dividend to Treasury on the senior preferred stock until it has built sufficient capital to meet the capital requirements and buffers set forth in the Enterprise Regulatory Capital Framework. As a result, the company was not required to pay a dividend to Treasury on the senior preferred stock in June 2025. As the company builds capital during this period, the quarterly increases in its Net Worth Amount have been, or will be, added to the aggregate liquidation preference of the senior preferred stock. The liquidation preference of the senior preferred stock increased to $135.1 billion on June 30, 2025 based on the increase in the Net Worth Amount during the first quarter of 2025, and will increase to $137.5 billion on September 30, 2025 based on the increase in the Net Worth Amount during the second quarter of 2025.
Additional Information
For more information, including information related to Freddie Mac’s financial results, conservatorship, and related matters, see the company’s Quarterly Report on Form 10-Q for the quarter ended June 30, 2025 and the company’s Second Quarter 2025 Financial Results Supplement. These documents are available on the Investor Relations page of the company’s website at www.FreddieMac.com.
Additional information about Freddie Mac and its business is also set forth in the company’s other filings with the SEC, which are available on the Investor Relations page of the company’s website at www.FreddieMac.com and the SEC’s website at www.sec.gov. Freddie Mac encourages all investors and interested members of the public to review these materials for a more complete understanding of the company’s financial results and related disclosures.
Webcast Announcement
Management will host a conference call at 9 a.m. Eastern Time on July 31, 2025 to share the company’s results with the media. The conference call will be concurrently webcast. To access the audio webcast, use the following link: https://edge.media-server.com/mmc/p/ode2tsd4. The replay will be available on the company’s website at www.FreddieMac.com for approximately 30 days. All materials related to the call will be available on the Investor Relations page of the company’s website at www.FreddieMac.com.
| | | | | |
| |
| Media Contact: Frederick Solomon (703) 903-3861 | Investor Contact: Mahesh Lal (571) 382-4732 |
| |
* * * *
This press release contains forward-looking statements, which may include statements pertaining to the conservatorship, the company’s current expectations and objectives for its Single-Family and Multifamily segments, its efforts to assist the housing market, liquidity and capital management, economic and market conditions and trends including, but not limited to, changes in house prices and house price forecasts, its market coverage, the effect of legislative and regulatory developments and new accounting guidance, the credit quality of loans the company owns or guarantees, the costs and benefits of the company’s CRT transactions, the impact of banking crises or failures, the effects of natural disasters or catastrophic events and actions taken in response thereto on its business, results of operations, and financial condition. Forward-looking statements involve known and unknown risks and uncertainties, some of which are beyond the company’s control. Management’s expectations for the company’s future necessarily involve a number of assumptions, judgments, and estimates, and various factors, including changes in economic and market conditions, liquidity, mortgage spreads, credit outlook, actions by the U.S. government (including FHFA, Treasury, and Congress) and state and local governments, changes in the fiscal and monetary policies of the Federal Reserve, the impact of any downgrade in our credit ratings or those of the U.S. government, and the impacts of legislation or regulations and new or amended accounting guidance, that could cause actual results to differ materially from these expectations. These assumptions, judgments, estimates, and factors are discussed in the company’s Annual Report on Form 10-K for the year ended December 31, 2024, Quarterly Reports on Form 10-Q for the quarters ended March 31, 2025 and June 30, 2025, and Current Reports on Form 8-K, which are available on the Investor Relations page of the
Freddie Mac Second Quarter 2025 Financial Results
July 31, 2025
Page 8
company’s website at www.FreddieMac.com and the SEC’s website at www.sec.gov. The company undertakes no obligation to update forward-looking statements it makes to reflect events or circumstances occurring after the date of this press release.
Freddie Mac's mission is to make home possible for families across the nation. Freddie Mac promotes liquidity, stability, affordability and equity in the housing market throughout all economic cycles. Since 1970, Freddie Mac has helped tens of millions of families buy, rent or keep their home.
Freddie Mac Second Quarter 2025 Financial Results
July 31, 2025
Page 9
FREDDIE MAC
Condensed Consolidated Statements of Income and Comprehensive Income (Unaudited)
| | | | | | | | | | | | | | | | | | | | |
| | |
(In millions, except share-related amounts) | | 2Q 2025 | | 1Q 2025 | | 2Q 2024 |
| Net interest income | | | | | | |
| Interest income | | $32,048 | | $31,365 | | $29,064 |
| Interest expense | | (26,749) | | | (26,263) | | | (24,136) | |
| Net interest income | | 5,299 | | | 5,102 | | | 4,928 | |
| Non-interest income | | | | | | |
| Guarantee income | | 398 | | | 440 | | | 383 | |
| Investment gains, net | | 119 | | | 192 | | | 549 | |
| Other income | | 100 | | | 118 | | | 128 | |
| Non-interest income | | 617 | | | 750 | | | 1,060 | |
| Net revenues | | 5,916 | | | 5,852 | | | 5,988 | |
| (Provision) benefit for credit losses | | (783) | | | (280) | | | (394) | |
| Non-interest expense | | | | | | |
| Salaries and employee benefits | | (453) | | | (423) | | | (420) | |
| Professional services, technology, and occupancy | | (295) | | | (253) | | | (269) | |
| Credit enhancement expense | | (511) | | | (540) | | | (588) | |
| Legislative and regulatory assessments | | (825) | | | (817) | | | (802) | |
| Other expense | | (74) | | | (55) | | | (55) | |
| Non-interest expense | | (2,158) | | | (2,088) | | | (2,134) | |
| Income before income tax expense | | 2,975 | | | 3,484 | | | 3,460 | |
| Income tax expense | | (588) | | | (690) | | | (695) | |
| Net income | | 2,387 | | | 2,794 | | | 2,765 | |
| Other comprehensive income (loss), net of taxes and reclassification adjustments | | 21 | | | 34 | | | (5) | |
| Comprehensive income | | $2,408 | | $2,828 | | $2,760 |
| Net income | | $2,387 | | $2,794 | | $2,765 |
| Amounts attributable to senior preferred stock | | (2,408) | | (2,828) | | (2,760) |
| Net income (loss) attributable to common stockholders | | ($21) | | ($34) | | $5 |
| Net income (loss) per common share | | ($0.01) | | ($0.01) | | $0.00 |
| Weighted average common shares (in millions) | | 3,234 | | | 3,234 | | | 3,234 | |
Freddie Mac Second Quarter 2025 Financial Results
July 31, 2025
Page 10
FREDDIE MAC
Condensed Consolidated Balance Sheets (Unaudited) | | | | | | | | | | | | | | |
| | June 30, | | December 31, |
(In millions, except share-related amounts) | | 2025 | | 2024 |
| Assets | | | | |
Cash and cash equivalents (includes $1,137 and $1,165 of restricted cash and cash equivalents) | | $4,267 | | $5,534 |
| Securities purchased under agreements to resell | | 95,451 | | | 100,118 | |
| Investment securities, at fair value | | 82,850 | | | 55,771 | |
Mortgage loans held-for-sale (includes $3,867 and $11,394 at fair value) | | 6,300 | | | 15,560 | |
Mortgage loans held-for-investment (net of allowance for credit losses of $7,729 and $6,774 and includes $4,424 and $2,413 at fair value) | | 3,206,974 | | | 3,172,329 | |
| Accrued interest receivable | | 11,583 | | | 11,029 | |
| Deferred tax assets, net | | 5,005 | | | 5,018 | |
Other assets (includes $6,166 and $5,870 at fair value) | | 23,850 | | | 21,333 | |
| Total assets | | $3,436,280 | | $3,386,692 |
| Liabilities and equity | | | | |
| Liabilities | | | | |
| Accrued interest payable | | $10,226 | | $9,822 |
Debt (includes $2,693 and $2,339 at fair value) | | 3,349,274 | | | 3,304,949 | |
Other liabilities (includes $967 and $978 at fair value) | | 11,969 | | | 12,346 | |
| Total liabilities | | 3,371,469 | | | 3,327,117 | |
| Commitments and contingencies | | | | |
| Equity | | | | |
Senior preferred stock (liquidation preference of $135,051 and $129,038) | | 72,648 | | | 72,648 | |
| Preferred stock, at redemption value | | 14,109 | | | 14,109 | |
Common stock, $0.00 par value, 4,000,000,000 shares authorized, 725,863,886 shares issued and 650,059,553 shares outstanding | | — | | | — | |
| | | | |
| Retained earnings | | (18,089) | | | (23,270) | |
| AOCI, net of taxes, related to: | | | | |
| Available-for-sale securities | | 113 | | | 66 | |
| Other | | (85) | | | (93) | |
| Total AOCI, net of taxes | | 28 | | | (27) | |
Treasury stock, at cost, 75,804,333 shares | | (3,885) | | | (3,885) | |
| Total equity | | 64,811 | | | 59,575 | |
| Total liabilities and equity | | $3,436,280 | | $3,386,692 |
The table below presents the carrying value and classification of the assets and liabilities related to consolidated variable interest entities (VIEs) on the company's condensed consolidated balance sheets. |
| | June 30, | | December 31, |
| (In millions) | | 2025 | | 2024 |
| Assets | | | | |
Cash and cash equivalents (includes $1,037 and $1,055 of restricted cash and cash equivalents) | | $1,037 | | $1,056 | |
| Securities purchased under agreements to resell | | 14,204 | | 12,764 | |
| Investment securities, at fair value | | 28 | | 1 |
| Mortgage loans held-for-investment, net | | 3,145,913 | | 3,114,937 |
| Accrued interest receivable | | 10,316 | | 9,900 | |
| Other assets | | 7,106 | | | 5,881 | |
| Total assets of consolidated VIEs | | $3,178,604 | | $3,144,539 |
| Liabilities | | | | |
| Accrued interest payable | | $8,877 | | $8,469 |
| Debt | | 3,155,397 | | 3,122,941 |
| Total liabilities of consolidated VIEs | | $3,164,274 | | $3,131,410 |