Shareholder Report
May 31, 2025
USD ($)
holding
| WHAT WERE THE FUND COSTS FOR THE PERIOD? (based on a hypothetical $10,000 investment) | |||||||||||
| COST OF $10,000 INVESTMENT | COST PAID AS A PERCENTAGE OF $10,000 INVESTMENT | ||||||||||
| $11 | 0.74% | ||||||||||
| WHAT FACTORS INFLUENCED PERFORMANCE FOR THE PERIOD? | |||||||||||
The Argent Small Cap ETF achieved a net asset value return of 0.29%, as compared to its benchmark, the Russell 3000 index, which increased by 13.12%. The underperformance was driven by the selection of stocks that were affected by the activities of the new Department of Government Efficiency (DOGE) and broad investor rotation toward lower-quality, unprofitable, thematic momentum winners, including those in the fields of quantum computing and small nuclear reactors. Sector allocation contributed positively to performance.
Stock selection in the industrials sector was a primary detractor from performance. Shares of holdings tied to government services were under pressure from DOGE-related initiatives, including ICF International, Exponent, and CBIZ, Inc.
Conversely, our materials sector holdings contributed positively, due to the outperformance from our lone holding, performance ingredient manufacturer Balchem Corp.
| PERFORMANCE OF A HYPOTHETICAL $10,000 INVESTMENT | |||||||||||
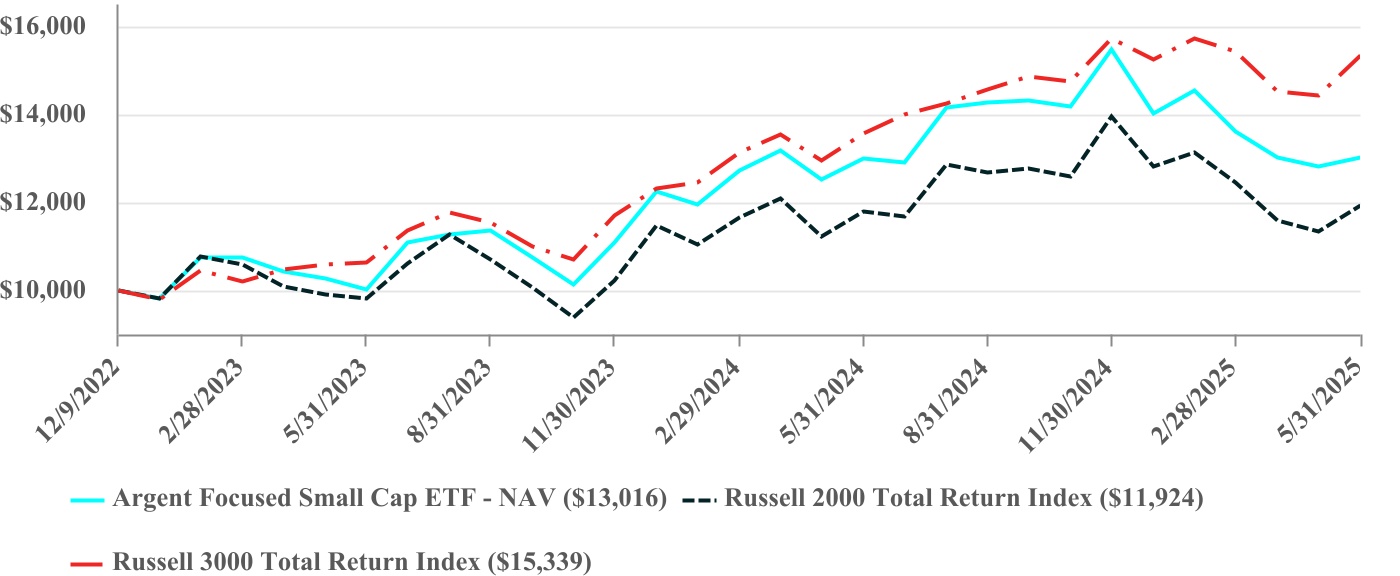
| AVERAGE ANNUAL TOTAL RETURNS | ||||||||||||||
One Year | Since Inception (12/09/2022) | |||||||||||||
| Argent Focused Small Cap ETF - NAV | 0.29% | 11.24% | ||||||||||||
| Russell 2000 Total Return Index | 1.19% | 7.37% | ||||||||||||
| Russell 3000 Total Return Index | 13.12% | 18.88% | ||||||||||||
The Fund’s past performance is not a good predictor of how the Fund will perform in the future. The graph and table do not reflect the deduction of taxes that a shareholder would pay on Fund distributions or redemption of Fund shares. Visit https://argentetfs.com/alil/ for more recent performance information. | ||||||||||||||
The Fund commenced investment operations April 8, 2025 after the conversion of a separately managed account (the “Predecessor Account”) into shares of the Fund. The Predecessor Account commenced operations on December 9, 2022. The chart and performance table above reflect the performance of the Predecessor Account for periods prior to the commencement of the Fund’s operations. The Predecessor Account’s performance has been recalculated using the management fee that applies to the Fund, which has the effect of reducing the Predecessor Account’s performance. The Predecessor Account was not registered under the 1940 Act and therefore was not subject to certain restrictions imposed by the 1940 Act on registered investment companies and by the Internal Revenue Code of 1986 on regulated investment companies, which, had the restrictions applied, may have adversely affected the Predecessor Account’s performance. | ||||||||||||||
| SECTOR WEIGHTING (as a % of Net Assets) | |||||
| Financials | 22.6% | ||||
| Industrials | 20.7% | ||||
| Information Technology | 13.9% | ||||
| Health Care | 12.9% | ||||
| Consumer Discretionary | 11.6% | ||||
| Real Estate | 7.5% | ||||
| Energy | 2.7% | ||||
| Materials | 2.4% | ||||
| Utilities | 2.0% | ||||
| Consumer Staples | 1.9% | ||||
| Communication Services | 1.4% | ||||
| Cash and Cash Equivalents | 0.4% | ||||
| TOP 10 HOLDINGS (as a % of Net Assets) | |||||
| Victory Capital Holdings, Inc. - Class A | 4.1% | ||||
| Hamilton Lane, Inc. - Class A | 3.9% | ||||
| Houlihan Lokey, Inc. | 3.9% | ||||
| Descartes Systems Group, Inc. | 3.8% | ||||
| Colliers International Group, Inc. | 3.8% | ||||
| OneMain Holdings, Inc. | 3.7% | ||||
| FirstService Corp. | 3.7% | ||||
| RLI Corp. | 3.6% | ||||
| ePlus, Inc. | 3.5% | ||||
| Addus HomeCare Corp. | 3.5% | ||||
| WHAT WERE THE FUND COSTS FOR THE PERIOD? (based on a hypothetical $10,000 investment) | |||||||||||
| COST OF $10,000 INVESTMENT | COST PAID AS A PERCENTAGE OF $10,000 INVESTMENT | ||||||||||
| $8 | 0.49% | ||||||||||
| WHAT FACTORS INFLUENCED PERFORMANCE FOR THE PERIOD? | |||||||||||
The Argent Large Cap ETF achieved a net asset value return of 6.73%, as compared to its benchmark, the Russell 3000 index, which increased by 13.12%. The underperformance was driven by the selection of stocks that were affected by activities of the new Department of Government Efficiency (DOGE) and broad investor rotation toward more defensive sectors initially and then thematic momentum winners, including artificial intelligence and cryptocurrency, eventually. Sector allocation contributed positively to performance.
Stock selection in the healthcare sector was a primary detractor from performance. Shares of holding UnitedHealthcare were under pronounced regulatory scrutiny from DOGE-related initiatives. In addition, when the “Liberation Day” tariff pronouncements were rolled back and delayed, our higher-quality, more defensive industrial sector holdings lagged behind the benchmark performance.
Conversely, our financials sector holdings contributed positively, largely due to outperformance from shares of insurer Progressive and payment processors Mastercard and Visa.
| PERFORMANCE OF A HYPOTHETICAL $10,000 INVESTMENT | |||||||||||
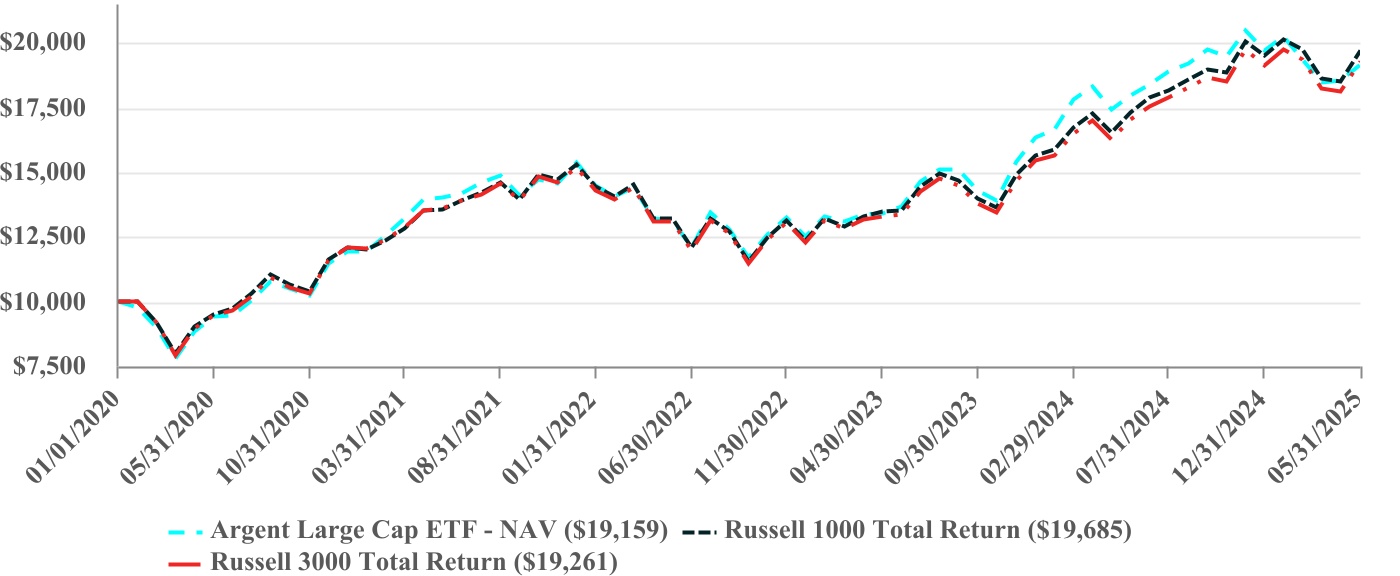
| AVERAGE ANNUAL TOTAL RETURNS | |||||||||||||||||
One Year | Five Years | Since Inception (01/01/2020) | |||||||||||||||
| Argent Large Cap ETF - NAV | 6.73% | 15.29% | 12.76% | ||||||||||||||
| Russell 3000 Total Return Index | 13.12% | 15.34% | 12.87% | ||||||||||||||
| Russell 1000 Total Return Index | 13.73% | 15.66% | 13.33% | ||||||||||||||
The Fund’s past performance is not a good predictor of how the Fund will perform in the future. The graph and table do not reflect the deduction of taxes that a shareholder would pay on Fund distributions or redemption of Fund shares. Visit https://argentetfs.com/abig/ for more recent performance information. | |||||||||||||||||
The Fund commenced investment operations April 8, 2025 after the conversion of a separately managed account (the “Predecessor Account”) into shares of the Fund. The Predecessor Account commenced operations on January 1, 2020. The chart and performance table above reflect the performance of the Predecessor Account for periods prior to the commencement of the Fund’s operations. The Predecessor Account’s performance has been recalculated using the management fee that applies to the Fund, which has the effect of reducing the Predecessor Account’s performance. The Predecessor Account was not registered under the 1940 Act and therefore was not subject to certain restrictions imposed by the 1940 Act on registered investment companies and by the Internal Revenue Code of 1986 on regulated investment companies, which, had the restrictions applied, may have adversely affected the Predecessor Account’s performance. | |||||||||||||||||
| WHAT WERE THE FUND COSTS FOR THE PERIOD? (based on a hypothetical $10,000 investment) | |||||||||||
| COST OF $10,000 INVESTMENT | COST PAID AS A PERCENTAGE OF $10,000 INVESTMENT | ||||||||||
| $52 | 0.52% | ||||||||||
| WHAT FACTORS INFLUENCED PERFORMANCE FOR THE PERIOD? | |||||||||||
During the Period, the Argent Mid Cap ETF achieved a net asset value (NAV) return of 0.56%, as compared to its benchmark, the Russell 3000 index, which increased by 13.12%. The underperformance was driven by the selection of stocks that were affected by the activities of the new Department of Government Efficiency (DOGE) and broad investor rotation away from economically sensitive areas and toward more defensive sectors. Sector allocation contributed positively to performance.
The benchmark industrials sector outperformed, but stock selection weighed on the Fund’s industrials exposure and was the primary drag on performance. Stock selection in the Consumer Discretionary sector also weighed negatively. Conversely, the Energy sector was the primary contributor to performance, due to the outperformance of shares of liquified natural gas provider Cheniere Energy and the underweight allocation.
| PERFORMANCE OF A HYPOTHETICAL $10,000 INVESTMENT | |||||||||||
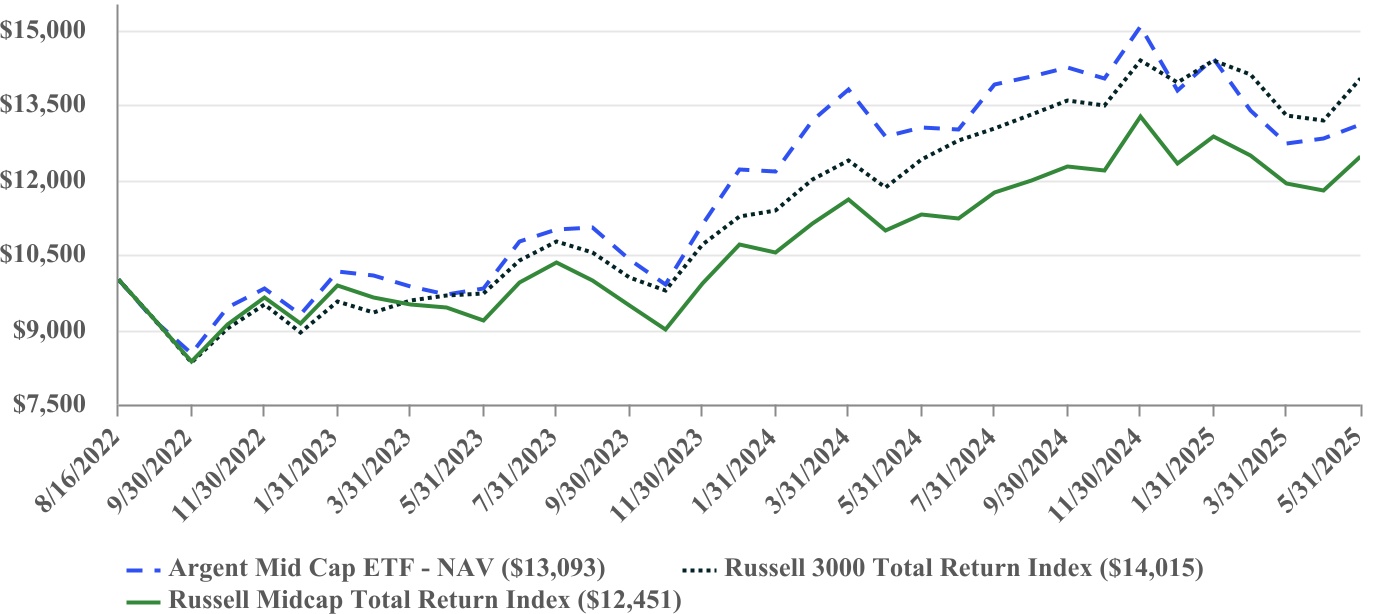
| AVERAGE ANNUAL TOTAL RETURNS | ||||||||||||||
| 1 Year | Since Inception (8/16/2022) | |||||||||||||
| Argent Mid Cap ETF - NAV | 0.56% | 10.15% | ||||||||||||
| Russell Midcap Total Return Index | 10.32% | 8.18% | ||||||||||||
| Russell 3000 Total Return Index | 13.12% | 12.87% | ||||||||||||
The Fund’s past performance is not a good predictor of how the Fund will perform in the future. The graph and table do not reflect the deduction of taxes that a shareholder would pay on Fund distributions or redemption of Fund shares. Visit https://argentetfs.com/abig/ for more recent performance information. | ||||||||||||||
| SECTOR WEIGHTING (as a % of Net Assets) | |||||
| Industrials | 27.4% | ||||
| Information Technology | 21.3% | ||||
| Financials | 19.5% | ||||
| Consumer Discretionary | 14.2% | ||||
| Health Care | 10.6% | ||||
| Real Estate | 4.5% | ||||
| Energy | 2.1% | ||||
| Cash and Cash Equivalents | 0.4% | ||||
| TOP 10 HOLDINGS (as a % of Net Assets) | |||||
| Fortinet, Inc. | 4.0% | ||||
| LPL Financial Holdings, Inc. | 4.0% | ||||
| HCA Healthcare, Inc. | 3.7% | ||||
| Copart, Inc. | 3.6% | ||||
| Houlihan Lokey, Inc. | 3.4% | ||||
| Victory Capital Holdings, Inc. - Class A | 3.1% | ||||
| Descartes Systems Group, Inc. | 3.1% | ||||
| Fair Isaac Corp. | 3.1% | ||||
| CBIZ, Inc. | 3.1% | ||||
| Cintas Corp. | 3.0% | ||||