Shareholder Report
May 31, 2025
USD ($)
holding
| WHAT WERE THE FUND COSTS FOR THE PERIOD? (based on a hypothetical $10,000 investment) | |||||||||||
| COST OF $10,000 INVESTMENT | COST PAID AS A PERCENTAGE OF $10,000 INVESTMENT | ||||||||||
| $48 | 0.48% | ||||||||||
| WHAT FACTORS INFLUENCED PERFORMANCE FOR THE PERIOD? | |||||||||||
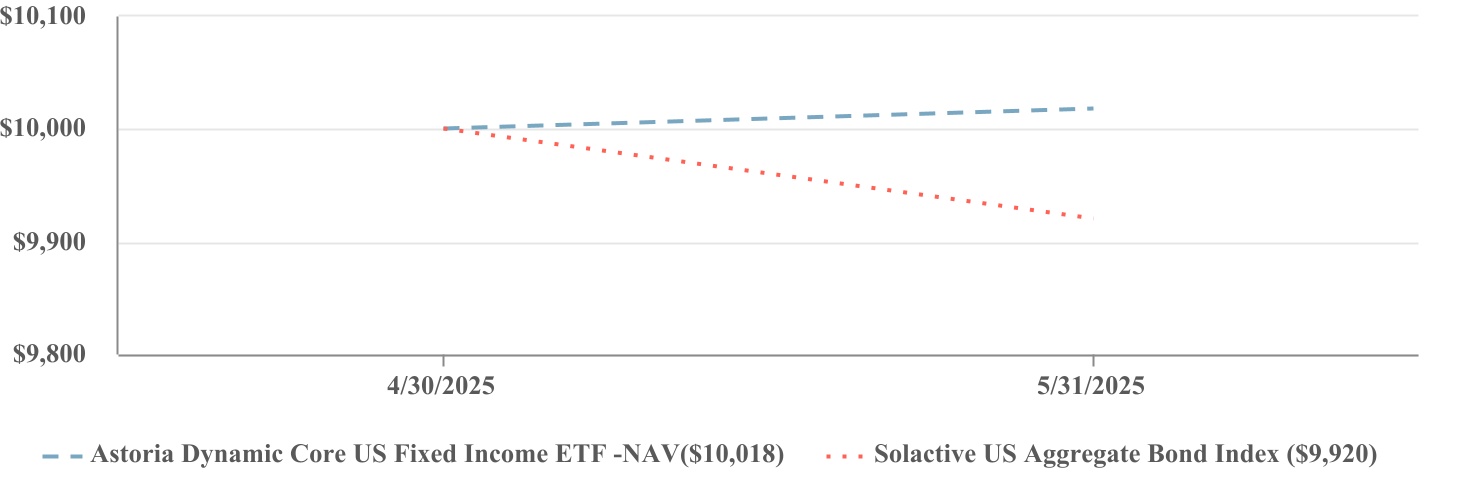
The Fund returned 0.18% during the Period The Fund’s allocations to high yield corporate bonds and investment grade corporate bonds were the largest drivers of the return as economic indicators such as Nonfarm Payrolls and inflation via Consumer Price Index came in better than expectations, reinforcing investor confidence in such riskier assets, and corporate financial stability remained intact, helping to keep default rates low. However, exposures to long term Treasuries negatively contributed to the Fund’s performance given a rise in longer-term US interest rates due to the Fed’s “wait-and-see” approach for further monetary easing, the Moody's downgrade of US sovereign credit, efforts in Congress to extend tax cuts and raise the debt ceiling, the Fed acknowledging upside risks to inflation amid tariffs, and a rising term premium.
| PERFORMANCE OF A HYPOTHETICAL $10,000 INVESTMENT | |||||||||||
| AVERAGE ANNUAL TOTAL RETURNS | ||||||||
Since Inception (4/30/2025) | ||||||||
| Astoria Dynamic Core US Fixed Income ETF - NAV | 0.18% | |||||||
| Solactive US Aggregate Bond Index | (0.80)% | |||||||
The Fund’s past performance is not a good predictor of how the Fund will perform in the future. The graph and table do not reflect the deduction of taxes that a shareholder would pay on fund distributions or redemption of fund shares. | ||||||||
Visit https://astoriaadvisorsetfs.com/roe/ for more recent performance information. | ||||||||
INVESTMENT WEIGHTING (as a % of Net Assets) | |||||
Corporate Bond and Other Fixed Income ETFs | 64.2% | ||||
U.S. Treasury ETFs | 35.5% | ||||
| Money Market Funds | 0.3% | ||||
| TOP 10 HOLDINGS (as a % of Net Assets) | |||||
| SPDR Portfolio Intermediate Term Corporate Bond ETF | 15.0% | ||||
| iShares 5-10 Year Investment Grade Corporate Bond ETF | 12.0% | ||||
| BondBloxx Bloomberg One Year Target Duration US Treasury ETF | 11.9% | ||||
| BondBloxx Bloomberg Ten Year Target Duration US Treasury ETF | 11.8% | ||||
| Schwab High Yield Bond ETF | 10.1% | ||||
| SPDR Portfolio Short Term Treasury ETF | 9.9% | ||||
| JPMorgan BetaBuilders USD High Yield Corporate Bond ETF | 7.0% | ||||
| Janus Henderson AAA CLO ETF | 7.0% | ||||
| SPDR Portfolio High Yield Bond ETF | 5.0% | ||||
| SPDR Bloomberg Investment Grade Floating Rate ETF | 5.0% | ||||
| WHAT WERE THE FUND COSTS FOR THE PERIOD? (based on a hypothetical $10,000 investment) | |||||||||||
| COST OF $10,000 INVESTMENT | COST PAID AS A PERCENTAGE OF $10,000 INVESTMENT | ||||||||||
| $51 | 0.49% | ||||||||||
| WHAT FACTORS INFLUENCED PERFORMANCE FOR THE PERIOD? | |||||||||||
The Fund returned 8.42% during the Period. The Fund’s allocation to financials was the largest driver of return amid a steepening yield curve which typically leads to higher profits for lending institutions, the start of monetary easing with additional interest rate cuts expected, avoidance of a recession coupled with a weakening but resilient consumer and improved lending conditions, and the US administration’s focus on both pro-business and deregulatory policies. Additionally, the Fund’s information technology exposure was a large contributor to return given the robust corporate earnings growth of such stocks, AI and data center related demand and investment, and easing trade tensions. However, exposures to materials and energy stocks negatively contributed to the Fund’s performance as tariffs have raised input costs for such companies, both demand and manufacturing somewhat softened on the back of trade uncertainty, and the price of oil and gas weakened amid elevated production, negatively affecting profitability.
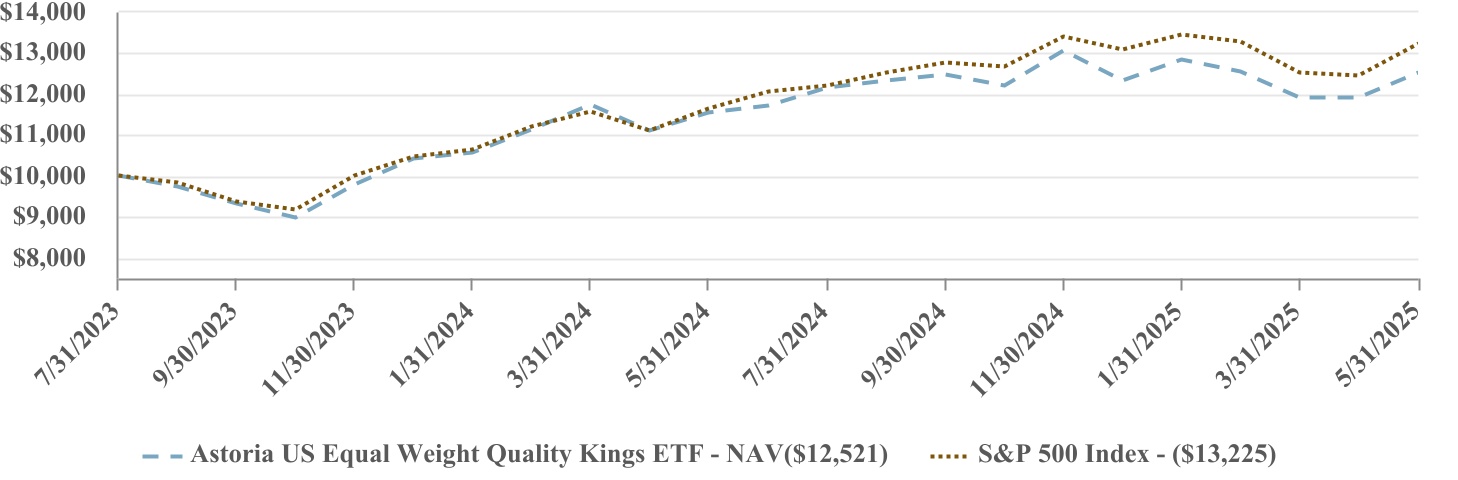
| AVERAGE ANNUAL TOTAL RETURNS | ||||||||
| One Year | Since Inception (7/31/2023) | |||||||
| Astoria US Equal Weight Quality Kings ETF - NAV | 8.42% | 13.03% | ||||||
| S&P 500 Index | 13.52% | 16.45% | ||||||
The Fund’s past performance is not a good predictor of how the Fund will perform in the future. The graph and table do not reflect the deduction of taxes that a shareholder would pay on fund distributions or redemption of fund shares. | ||||||||
Visit https://astoriaadvisorsetfs.com/roe/ for more recent performance information. | ||||||||
| SECTOR WEIGHTING (as a % of Net Assets) | |||||
| Information Technology | 31.4% | ||||
| Financials | 13.7% | ||||
| Health Care | 10.1% | ||||
| Consumer Discretionary | 10.1% | ||||
| Industrials | 9.3% | ||||
| Communication Services | 9.0% | ||||
| Consumer Staples | 6.3% | ||||
| Utilities | 3.5% | ||||
| Energy | 2.5% | ||||
| Real Estate | 2.0% | ||||
| Materials | 1.9% | ||||
| Cash and Cash Equivalents | 0.2% | ||||
| TOP 10 HOLDINGS (as a % of Net Assets) | |||||
| NRG Energy, Inc. | 1.5% | ||||
| Comfort Systems USA, Inc. | 1.3% | ||||
| Tenet Healthcare Corp. | 1.2% | ||||
| Amphenol Corp. - Class A | 1.2% | ||||
| Broadcom, Inc. | 1.2% | ||||
| Vistra Corp. | 1.2% | ||||
| Netflix, Inc. | 1.2% | ||||
| Tesla, Inc. | 1.2% | ||||
| First Solar, Inc. | 1.2% | ||||
| Philip Morris International, Inc. | 1.2% | ||||
| WHAT WERE THE FUND COSTS FOR THE PERIOD? (based on a hypothetical $10,000 investment) | |||||||||||
| COST OF $10,000 INVESTMENT | COST PAID AS A PERCENTAGE OF $10,000 INVESTMENT | ||||||||||
| $35 | 0.35% | ||||||||||
| WHAT FACTORS INFLUENCED PERFORMANCE FOR THE PERIOD? | |||||||||||
The Fund returned 1.70% during the Period. The Fund’s allocations to information technology and communication services were the largest drivers of the return amid the robust corporate earnings growth of such stocks, strong upwards estimate revisions, AI and data center related demand and investment, the start of monetary easing with additional interest rate cuts expected, and alleviating trade tensions. However, the Fund’s consumer discretionary exposure negatively contributed to the Fund’s performance as tariffs have raised input costs for such companies, financing remains expensive despite a slight reduction in interest rates, and consumers have become more price-conscious given declining sentiment around growth and the labor market. Moreover, the Fund’s allocation to health care stocks also subtracted from the return as drug pricing reform has intensified under the US administration.
| PERFORMANCE OF A HYPOTHETICAL $10,000 INVESTMENT | |||||||||||
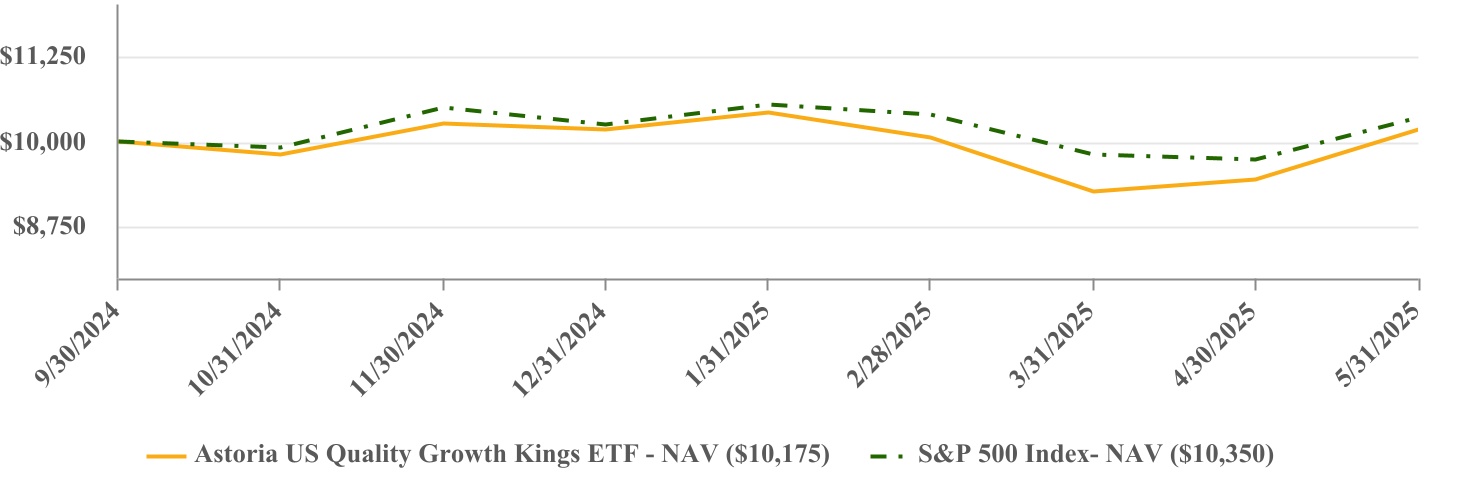
| AVERAGE ANNUAL TOTAL RETURNS | ||||||||
Since Inception (9/30/2024) | ||||||||
| Astoria US Quality Growth Kings ETF | 1.70% | |||||||
| S&P 500 Index | 3.50% | |||||||
The Fund’s past performance is not a good predictor of how the Fund will perform in the future. The graph and table do not reflect the deduction of taxes that a shareholder would pay on fund distributions or redemption of fund shares. | ||||||||
Visit https://astoriaadvisorsetfs.com/gqqq/ for more recent performance information. | ||||||||
| SECTOR WEIGHTING (as a % of Net Assets) | |||||
| Information Technology | 40.8% | ||||
| Communication Services | 12.4% | ||||
| Consumer Discretionary | 12.2% | ||||
| Health Care | 7.7% | ||||
| Financials | 7.1% | ||||
| Industrials | 6.9% | ||||
| Consumer Staples | 5.8% | ||||
| Utilities | 2.3% | ||||
| Energy | 1.8% | ||||
| Materials | 1.5% | ||||
| Real Estate | 1.1% | ||||
| Cash and Cash Equivalents | 0.4% | ||||
| TOP 10 HOLDINGS (as a % of Net Assets) | |||||
| Microsoft Corp. | 6.9% | ||||
| NVIDIA Corp. | 6.9% | ||||
| Apple, Inc. | 6.3% | ||||
| Amazon.com, Inc. | 4.6% | ||||
| Alphabet, Inc. - Class A | 4.0% | ||||
| Broadcom, Inc. | 3.5% | ||||
| Meta Platforms, Inc. - Class A | 2.9% | ||||
| Costco Wholesale Corp. | 2.7% | ||||
| Tesla, Inc. | 2.4% | ||||
| Netflix, Inc. | 2.2% | ||||