Shareholder Report
May 31, 2025
USD ($)
holding
| WHAT WERE THE FUND COSTS FOR THE PERIOD? (based on a hypothetical $10,000 investment) | |||||||||||
| COST OF $10,000 INVESTMENT | COST PAID AS A PERCENTAGE OF $10,000 INVESTMENT | ||||||||||
| $77 | 0.85% | ||||||||||
| WHAT FACTORS INFLUENCED PERFORMANCE FOR THE PERIOD? | |||||||||||
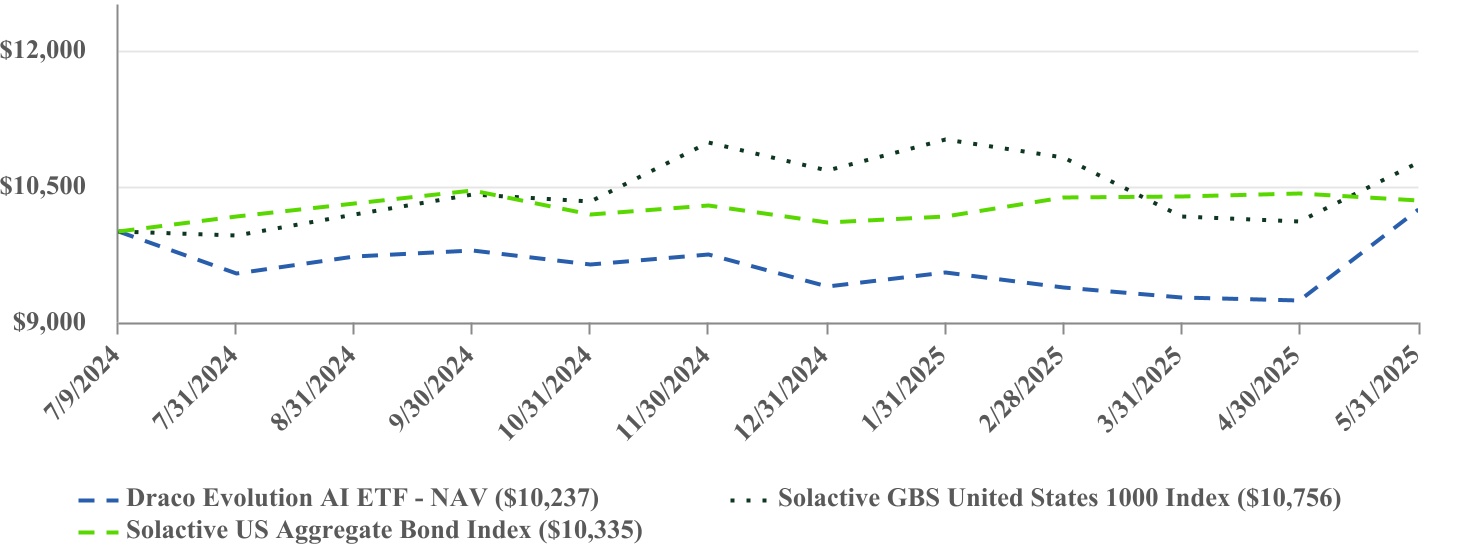
The DRAI ETF (the “Fund”) returned 2.37% (NAV) and 2.67% (market price) for the Period. In comparison, the Solactive US Aggregate Bond Index and Solactive GBS United States 1000 Index gained 3.35% and 7.94%, respectively, over the same period. During the Period, the Fund used an AI‑powered, multi‑asset allocation process that seeks attractive risk‑adjusted opportunities and maintained a predominantly equity‑oriented posture.
•Monetary policy shifts set the tone for the Period. The Federal Reserve held rates steady through mid‑2024, supporting a summer rally right before the Fund’s launch, and the Fund launched into a market that was testing fresh highs in July 2024. Within the following weeks, profit‑taking and mixed macro signals triggered the sharpest equity pullback in almost two years. Although the Fund’s model responded to the sudden volatility by trimming equity exposure, the Fund underperformed in the first few months, and this was largely due to the overall market pullback.
•Through early 2025, the Fed kept interest rates unchanged. As it later signaled a slower cadence of cuts for the year, the Fund’s model rotated into higher-quality equities and modestly rebuilt its cash position to cushion potential volatility. Beginning in
February, the Fund replaced nearly three-quarters of its leveraged-equity exposure with a defensive blend of long-duration Treasuries, a stronger U.S.-dollar stance, gold, and an expanded cash allocation. By materially lowering its equity beta just weeks ahead of the April tariff shock, the Fund limited its drawdown and rebounded more quickly than the broader market once risk appetite returned.
•After the announcement of a temporary pause in tariff implementation, the Fund maintained a defensive posture while adding a small test position in broad-market equities. As headline risk receded, the Fund trimmed Treasuries and gold, strengthened a tactical hedge against small-cap volatility to keep equity beta near neutral, and held cash steady for flexibility. Beta measures the sensitivity of an investment to the movement of its benchmark. A beta higher than 1.0 indicates the investment has been more volatile than the benchmark and a beta of less than 1.0 indicates that the investment has been less volatile than the benchmark. When the relief rally broadened toward May month-end, the model swiftly rotated back into risk assets, redeploying capital into large-cap growth and other higher-beta equity themes, while shifting fixed-income exposure from long-duration bonds to a balanced mix of core and high-yield credit. Over two successive rebalances the model trimmed the bond-and-gold hedge, neutralized the tail-risk hedge, and in the final April rebalance, the Fund shifted decisively back into growth-oriented and higher-beta equity themes alongside core and high-yield credit.
The Fund strictly followed the model’s signal and rebalanced assets accordingly, which contributed to limiting drawdown in April and capturing market rebound in May. Because the Fund had followed the initial defensive signal, drawdown during the tariff shock was minimal and capital was available to redeploy precisely when upside probability turned favorable, allowing the Fund to participate fully in the post-pause rally quickly. Despite this timely defensive positioning, the Fund still underperformed the broader market for the Period. The Fund launched into a period of heightened volatility amid shifting Federal Reserve guidance, election year uncertainty, and a sharp pull back in the second half of 2024, all of which weighed on early returns of the Fund before the model guided rebalancing steadied the portfolio and positioned it to capture the rebound later in the Period.
| PERFORMANCE OF A HYPOTHETICAL $10,000 INVESTMENT | |||||||||||
| AVERAGE ANNUAL TOTAL RETURNS | |||||
Since Inception (7/9/2024) | |||||
| Draco Evolution AI ETF - NAV | 2.37% | ||||
| Solactive GBS United States 1000 Index | 7.94% | ||||
| Solactive US Aggregate Bond Index | 3.35% | ||||
The Fund’s past performance is not a good predictor of how the Fund will perform in the future. The graph and table do not reflect the deduction of taxes that a shareholder would pay on fund distributions or redemption of fund shares. | |||||
Visit https://draietf.com/etf/ for more recent performance information. | |||||
| INVESTMENT WEIGHTING (as a % of Net Assets) | |||||
| Levered Equity ETFs | 53.8% | ||||
| Fixed Income ETFs | 45.8% | ||||
Money Market Funds* | 0.4% | ||||
*Excludes investments purchased with proceeds from securities lending
| TOP HOLDINGS (as a % of Net Assets) | |||||
| ProShares UltraPro QQQ | 24.1% | ||||
| Direxion Daily S&P 500 Bull 3X | 22.3% | ||||
| iShares iBoxx $ High Yield Corporate Bond ETF | 15.4% | ||||
| Vanguard Total Bond Market ETF | 15.2% | ||||
| iShares 7-10 Year Treasury Bond ETF | 15.2% | ||||
| Direxion Daily Semiconductors Bull 3x Shares | 2.7% | ||||
| Direxion Daily Small Cap Bull 3X Shares | 2.4% | ||||
| ProShares UltraPro Dow30 | 2.4% | ||||
First American Government Obligations Fund* | 0.4% | ||||