| 2Q 2025 Earnings Conference Call July 31, 2025 |

| 2 Statements made during this presentation that set forth expectations, predictions, projections or are about future events are based on facts and situations that are known to us as of July 31, 2025. We believe that our expectations and assumptions are reasonable. Actual results may differ materially, due to risks and uncertainties, such as those described on pages 24-35 of our Form 10-Q filed on May 6, 2025 and other subsequent filings by Matson with the SEC. Statements made during this presentation are not guarantees of future performance. We do not undertake any obligation to update our forward-looking statements. 2Q 2025 Earnings Conference Call Forward-Looking Statements |
| 3 • 2Q25 exceeded our expectations amid the challenges of market uncertainty and volatility arising from tariffs and global trade • Ocean Transportation operating income in 2Q25 was lower YoY primarily due to lower YoY volume in our China service ─ In our domestic tradelanes, we saw higher YoY volume in Hawaii and Alaska and lower YoY volume in Guam • In Logistics, our operating income was lower YoY primarily due to a lower contribution from transportation brokerage • Looking ahead, we expect uncertainty regarding tariffs and global trade, regulatory measures, the trajectory of the U.S. economy and other geopolitical factors to continue • Given 2Q25 financial performance and assuming these factors do not materially change from current conditions, we are raising full year outlook 2Q 2025 Earnings Conference Call Opening Remarks |
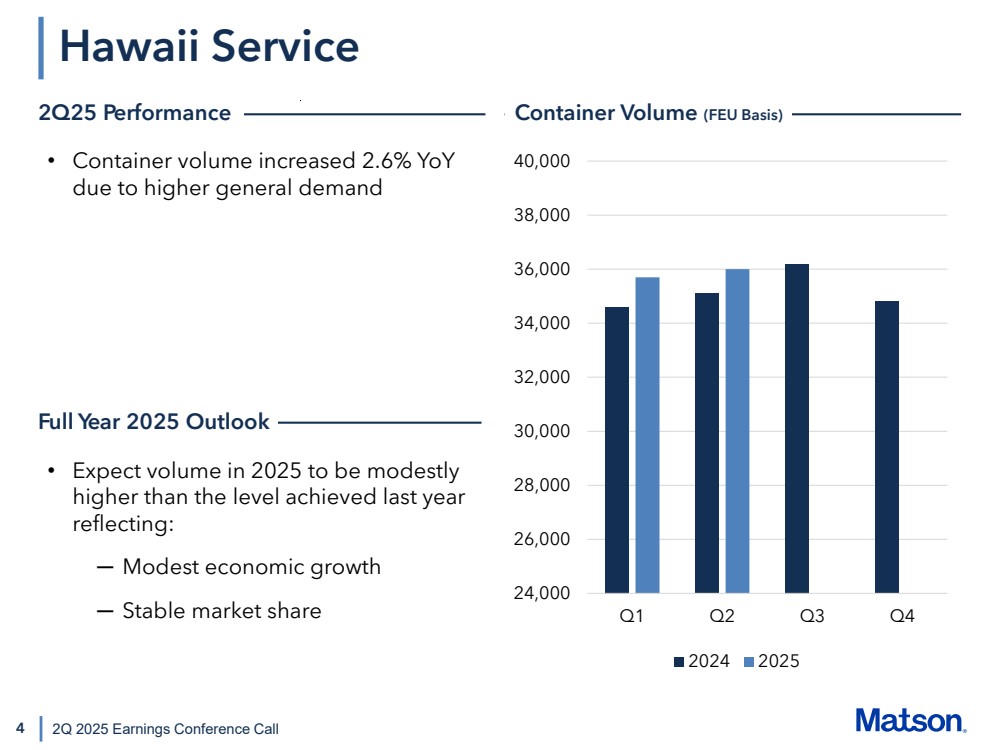
| 4 24,000 26,000 28,000 30,000 32,000 34,000 36,000 38,000 40,000 Q1 Q2 Q3 Q4 2024 2025 2Q 2025 Earnings Conference Call • Container volume increased 2.6% YoY due to higher general demand • Expect volume in 2025 to be modestly higher than the level achieved last year reflecting: ─ Modest economic growth ─ Stable market share Hawaii Service 2Q25 Performance Container Volume (FEU Basis) Full Year 2025 Outlook |
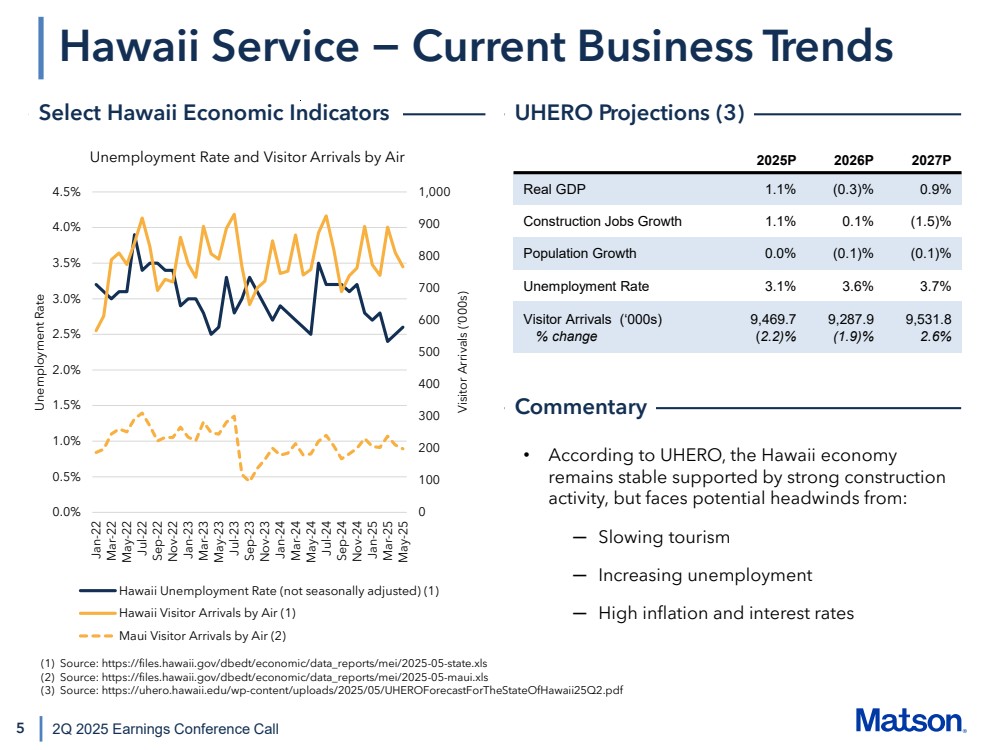
| 0 100 200 300 400 500 600 700 800 900 1,000 0.0% 0.5% 1.0% 1.5% 2.0% 2.5% 3.0% 3.5% 4.0% 4.5% Jan-22 Mar-22 May-22 Jul-22 Sep-22 Nov-22 Jan-23 Mar-23 May-23 Jul-23 Sep-23 Nov-23 Jan-24 Mar-24 May-24 Jul-24 Sep-24 Nov-24 Jan-25 Mar-25 May-25 Unemployment Rate Visitor Arrivals (‘000s) Unemployment Rate and Visitor Arrivals by Air Hawaii Unemployment Rate (not seasonally adjusted) (1) Hawaii Visitor Arrivals by Air (1) Maui Visitor Arrivals by Air (2) 5 Hawaii Service − Current Business Trends 2Q 2025 Earnings Conference Call • According to UHERO, the Hawaii economy remains stable supported by strong construction activity, but faces potential headwinds from: ─ Slowing tourism ─ Increasing unemployment ─ High inflation and interest rates 2025P 2026P 2027P Real GDP 1.1% (0.3)% 0.9% Construction Jobs Growth 1.1% 0.1% (1.5)% Population Growth 0.0% (0.1)% (0.1)% Unemployment Rate 3.1% 3.6% 3.7% Visitor Arrivals (‘000s) % change 9,469.7 (2.2)% 9,287.9 (1.9)% 9,531.8 2.6% Select Hawaii Economic Indicators UHERO Projections (3) Commentary (1) Source: https://files.hawaii.gov/dbedt/economic/data_reports/mei/2025-05-state.xls (2) Source: https://files.hawaii.gov/dbedt/economic/data_reports/mei/2025-05-maui.xls (3) Source: https://uhero.hawaii.edu/wp-content/uploads/2025/05/UHEROForecastForTheStateOfHawaii25Q2.pdf |
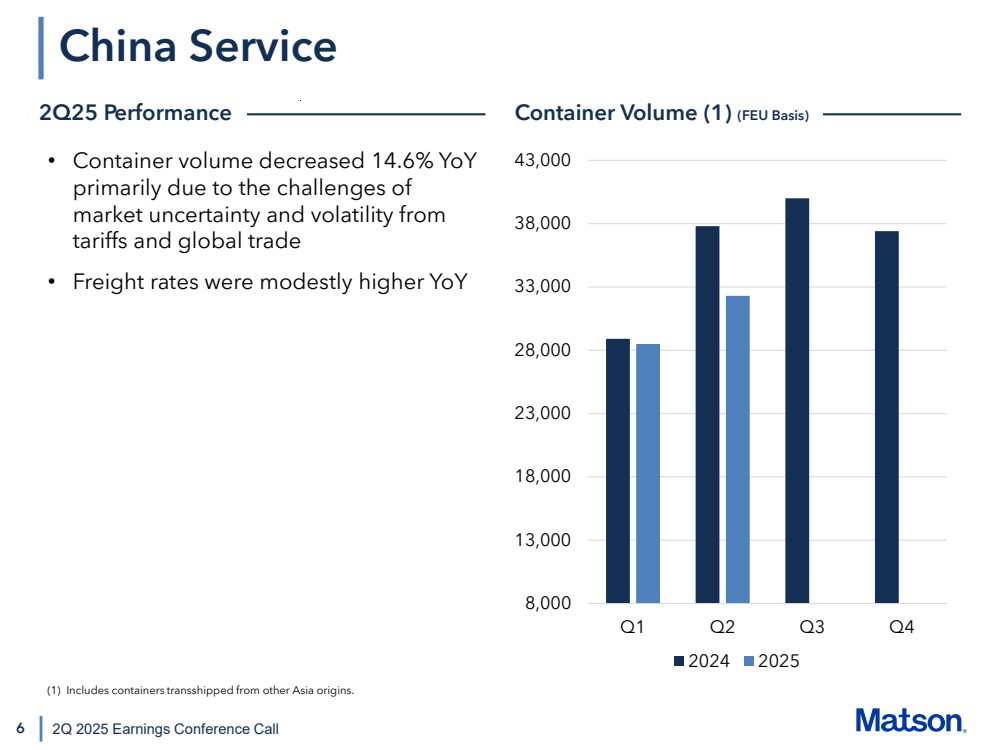
| 6 China Service 2Q 2025 Earnings Conference Call • Container volume decreased 14.6% YoY primarily due to the challenges of market uncertainty and volatility from tariffs and global trade • Freight rates were modestly higher YoY 2Q25 Performance Container Volume (1) (FEU Basis) 8,000 13,000 18,000 23,000 28,000 33,000 38,000 43,000 Q1 Q2 Q3 Q4 2024 2025 (1) Includes containers transshipped from other Asia origins. |
| 7 • At the onset of tariffs in April, we experienced significantly lower year-over-year freight demand as our customers held back less urgent shipments to work through the tariff impacts ─ Many of our customers were negotiating the tariffs with their trading partners on an order-by-order basis ─ At the same time, we saw carriers and alliances begin to reduce capacity in the Transpacific tradelane based on the significant volume downturn • Starting in mid-May, we saw a rebound in demand after the U.S. and China agreed to a temporary reduced level of tariffs, but also in anticipation of country-specific reciprocal tariffs returning in August ─ The build-up of freight that had taken place unwound over several weeks ─ Market freight rates increased quickly to meet the higher demand levels and capacity returned over the subsequent few weeks • Following the London meeting in June between the U.S. and China that upheld the terms from May, we saw a stabilization of volume modestly below the prior year period level amid a number of evolving tradelane supply and demand factors including: ─ Tradelane capacity reductions after the cargo rush in May ─ Customers in Vietnam and other Southeast Asian countries advancing freight ahead of July 9th when the 90-day pause on country-specific reciprocal tariffs expired ─ Some customers pulling forward freight from the traditional peak season in the third quarter to de-risk ahead of the next U.S.-China deadline 2Q 2025 Earnings Conference Call China Service − Current Business Trends |
| 8 • During 2Q25, we moved with our customers as they shifted production throughout Asia in response to the tariffs, which resulted in higher container volume levels outside of China ─ The sequential quarterly increase is primarily due to higher customer demand and the opening of our new expedited Ho Chi Minh service offering as our second best-in-class service out of Vietnam along with Haiphong from two years ago • We remain focused on supporting our customers in the region as they continue to shift their production capabilities, and we will look at opportunities to further expand our transshipment capabilities • Looking ahead, in 3Q25 we expect lower year-over-year freight rates and volume compared to the elevated demand levels achieved in 3Q24 and our expectation of a muted peak season this year ─ In July, we continued to see stabilized volume and rates, notwithstanding lower demand levels and continued pressure in the SCFI; as a result, we significantly outperformed the market relative to the SCFI due to our service differentiation and brand reputation • Assuming tariffs and global trade, regulatory measures, the trajectory of the U.S. economy and other geopolitical factors do not materially change from current conditions, we expect, for full year 2025, average freight rates and volume to be lower year-over-year 2Q 2025 Earnings Conference Call China Service − Current Business Trends (continued) |
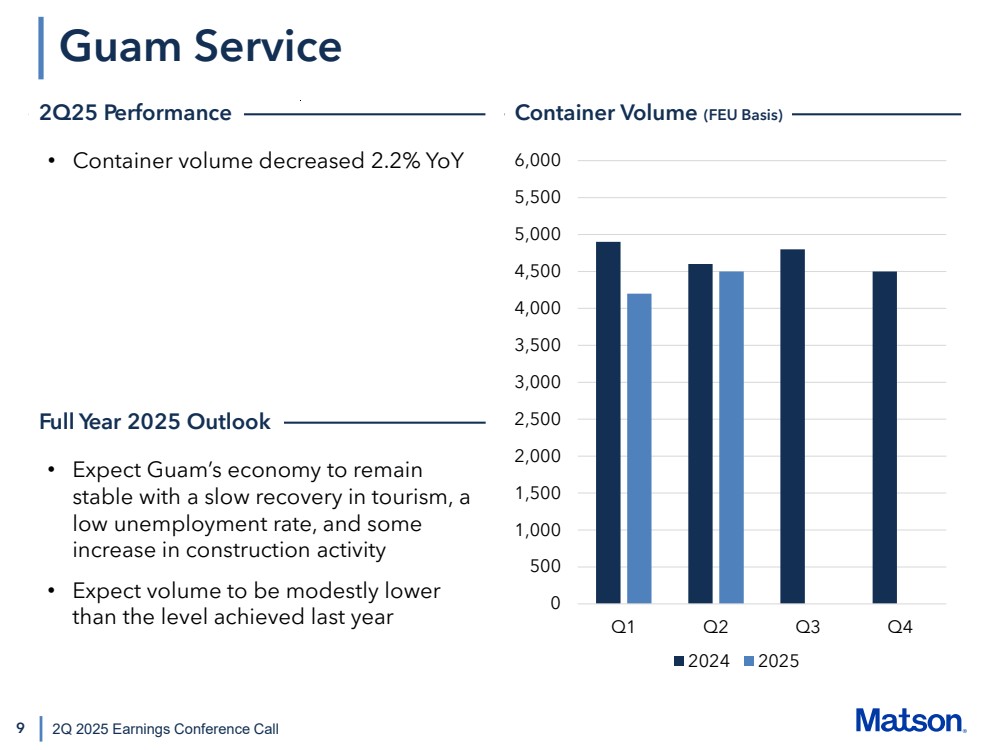
| 9 Guam Service 2Q 2025 Earnings Conference Call • Container volume decreased 2.2% YoY • Expect Guam’s economy to remain stable with a slow recovery in tourism, a low unemployment rate, and some increase in construction activity • Expect volume to be modestly lower than the level achieved last year 2Q25 Performance Container Volume (FEU Basis) 0 500 1,000 1,500 2,000 2,500 3,000 3,500 4,000 4,500 5,000 5,500 6,000 Q1 Q2 Q3 Q4 2024 2025 Full Year 2025 Outlook |
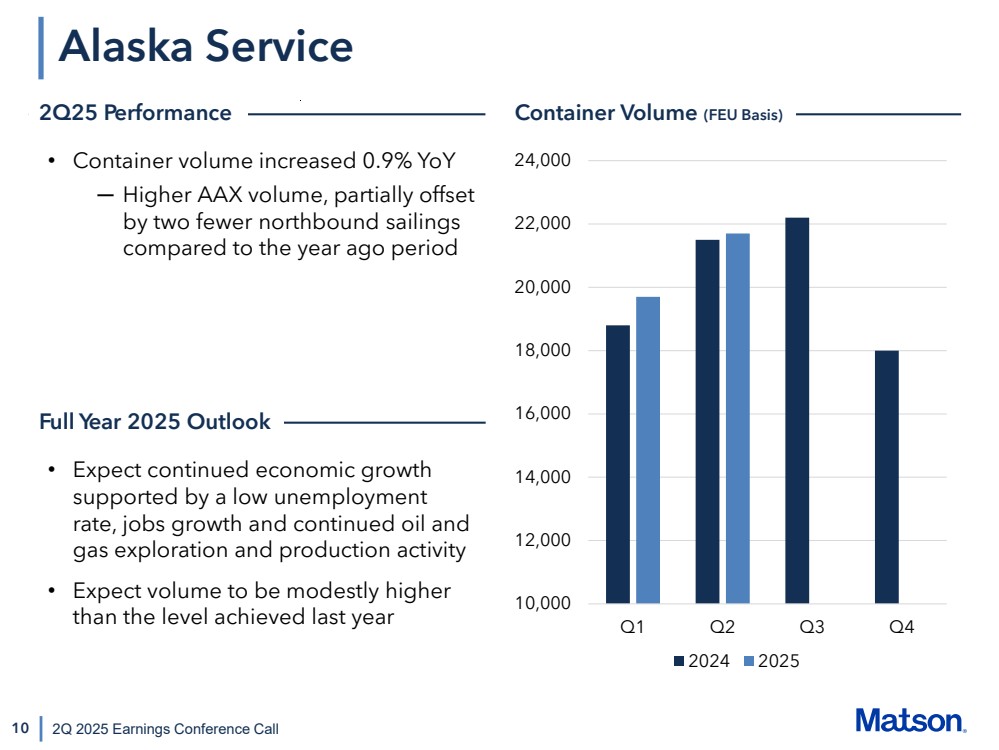
| 10 Alaska Service 2Q 2025 Earnings Conference Call • Container volume increased 0.9% YoY ─ Higher AAX volume, partially offset by two fewer northbound sailings compared to the year ago period 10,000 12,000 14,000 16,000 18,000 20,000 22,000 24,000 Q1 Q2 Q3 Q4 2024 2025 • Expect continued economic growth supported by a low unemployment rate, jobs growth and continued oil and gas exploration and production activity • Expect volume to be modestly higher than the level achieved last year 2Q25 Performance Container Volume (FEU Basis) Full Year 2025 Outlook |
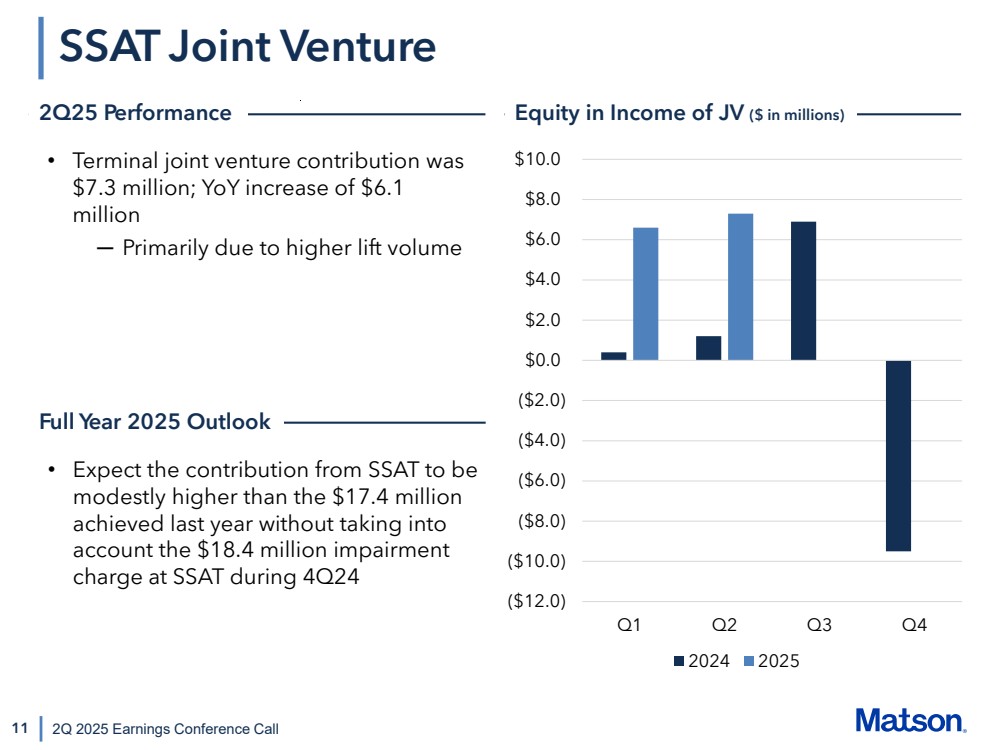
| 11 SSAT Joint Venture 2Q 2025 Earnings Conference Call • Terminal joint venture contribution was $7.3 million; YoY increase of $6.1 million ─ Primarily due to higher lift volume ($12.0) ($10.0) ($8.0) ($6.0) ($4.0) ($2.0) $0.0 $2.0 $4.0 $6.0 $8.0 $10.0 Q1 Q2 Q3 Q4 2024 2025 2Q25 Performance Equity in Income of JV ($ in millions) • Expect the contribution from SSAT to be modestly higher than the $17.4 million achieved last year without taking into account the $18.4 million impairment charge at SSAT during 4Q24 Full Year 2025 Outlook |
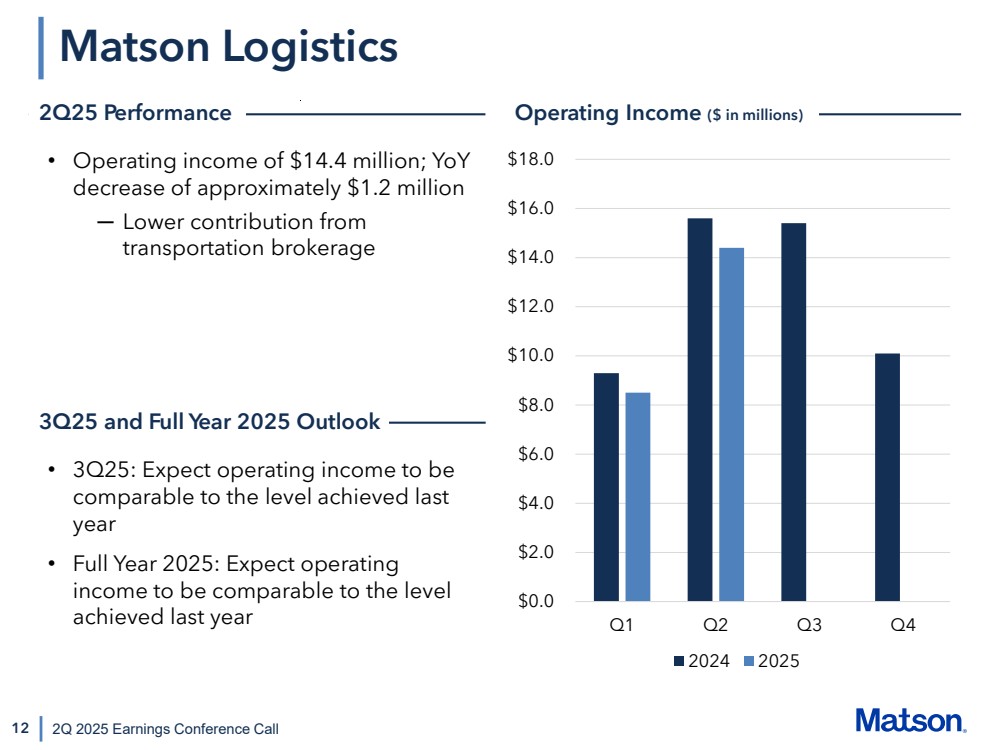
| 12 Matson Logistics 2Q 2025 Earnings Conference Call • Operating income of $14.4 million; YoY decrease of approximately $1.2 million ─ Lower contribution from transportation brokerage $0.0 $2.0 $4.0 $6.0 $8.0 $10.0 $12.0 $14.0 $16.0 $18.0 Q1 Q2 Q3 Q4 2024 2025 • 3Q25: Expect operating income to be comparable to the level achieved last year • Full Year 2025: Expect operating income to be comparable to the level achieved last year 2Q25 Performance Operating Income ($ in millions) 3Q25 and Full Year 2025 Outlook |
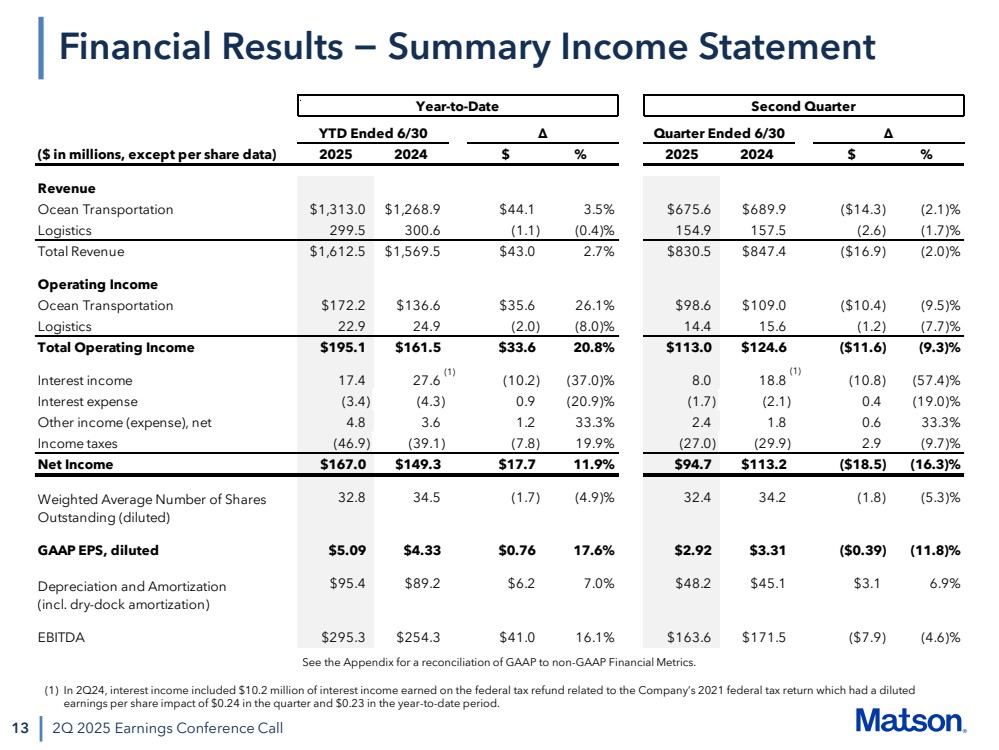
| 13 2Q 2025 Earnings Conference Call Financial Results − Summary Income Statement (1) In 2Q24, interest income included $10.2 million of interest income earned on the federal tax refund related to the Company’s 2021 federal tax return which had a diluted earnings per share impact of $0.24 in the quarter and $0.23 in the year-to-date period. (1) (1) See the Appendix for a reconciliation of GAAP to non-GAAP Financial Metrics. Year-to-Date Second Quarter YTD Ended 6/30 Δ Quarter Ended 6/30 Δ ($ in millions, except per share data) 2025 2024 $ % 2025 2024 $ % Revenue Ocean Transportation $1,313.0 $1,268.9 $44.1 3.5% $675.6 $689.9 ($14.3) (2.1)% Logistics 299.5 300.6 (1.1) (0.4)% 154.9 157.5 (2.6) (1.7)% Total Revenue $1,612.5 $1,569.5 $43.0 2.7% $830.5 $847.4 ($16.9) (2.0)% Operating Income Ocean Transportation $172.2 $136.6 $35.6 26.1% $98.6 $109.0 ($10.4) (9.5)% Logistics 22.9 24.9 (2.0) (8.0)% 14.4 15.6 (1.2) (7.7)% Total Operating Income $195.1 $161.5 $33.6 20.8% $113.0 $124.6 ($11.6) (9.3)% Interest income 17.4 27.6 (10.2) (37.0)% 8.0 18.8 (10.8) (57.4)% Interest expense (3.4) (4.3) 0.9 (20.9)% (1.7) (2.1) 0.4 (19.0)% Other income (expense), net 4.8 3.6 1.2 33.3% 2.4 1.8 0.6 33.3% Income taxes (46.9) (39.1) (7.8) 19.9% (27.0) (29.9) 2.9 (9.7)% Net Income $167.0 $149.3 $17.7 11.9% $94.7 $113.2 ($18.5) (16.3)% 32.8 34.5 (1.7) (4.9)% 32.4 34.2 (1.8) (5.3)% GAAP EPS, diluted $5.09 $4.33 $0.76 17.6% $2.92 $3.31 ($0.39) (11.8)% $95.4 $89.2 $6.2 7.0% $48.2 $45.1 $3.1 6.9% EBITDA $295.3 $254.3 $41.0 16.1% $163.6 $171.5 ($7.9) (4.6)% Depreciation and Amortization (incl. dry-dock amortization) Weighted Average Number of Shares Outstanding (diluted) |
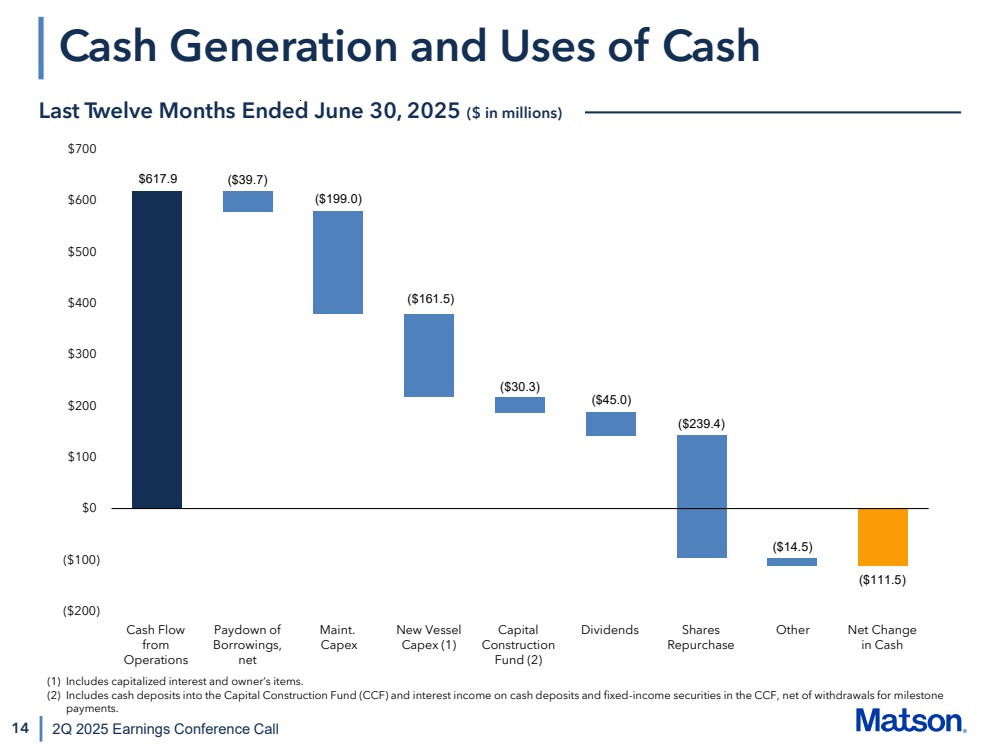
| ($200) ($100) $0 $100 $200 $300 $400 $500 $600 $700 Cash Flow from Operations Paydown of Borrowings, net Maint. Capex New Vessel Capex (1) Capital Construction Fund (2) Dividends Share Repurchase Other Net change in cash $617.9 ($39.7) ($199.0) ($30.3) ($161.5) ($45.0) ($239.4) ($14.5) ($111.5) 14 Cash Generation and Uses of Cash 2Q 2025 Earnings Conference Call (1) Includes capitalized interest and owner’s items. (2) Includes cash deposits into the Capital Construction Fund (CCF) and interest income on cash deposits and fixed-income securities in the CCF, net of withdrawals for milestone payments. Last Twelve Months Ended June 30, 2025 ($ in millions) Cash Flow from Operations Paydown of Borrowings, net Maint. Capex New Vessel Capex (1) Capital Construction Fund (2) Dividends Shares Repurchase Other Net Change in Cash |
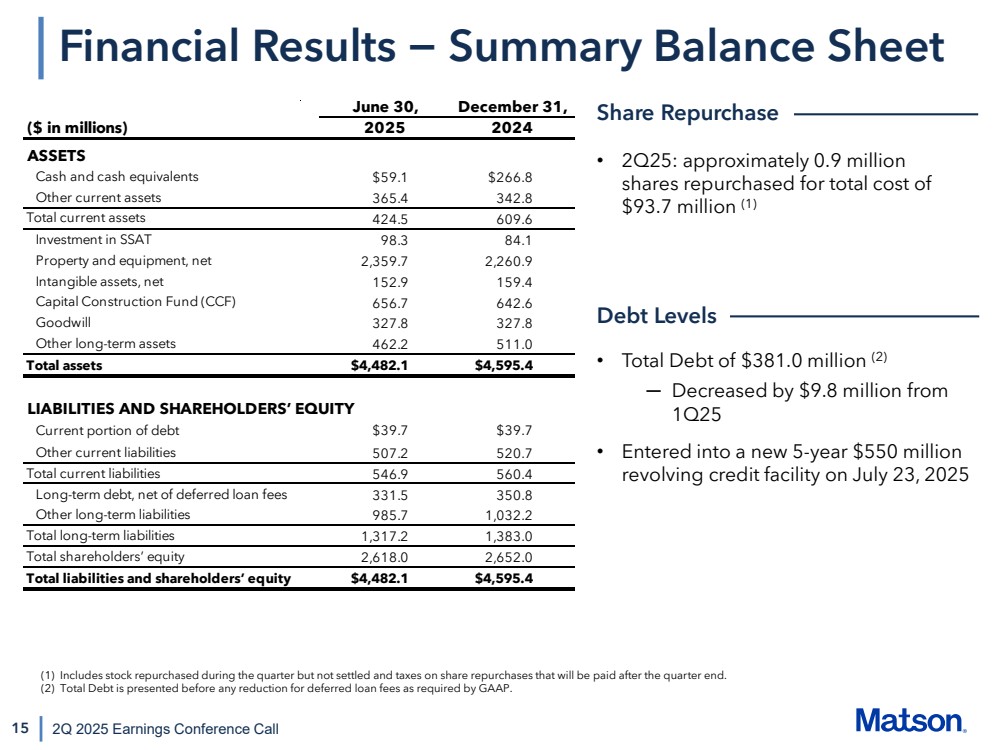
| 15 Financial Results − Summary Balance Sheet 2Q 2025 Earnings Conference Call • 2Q25: approximately 0.9 million shares repurchased for total cost of $93.7 million (1) • Total Debt of $381.0 million (2) ─ Decreased by $9.8 million from 1Q25 • Entered into a new 5-year $550 million revolving credit facility on July 23, 2025 Share Repurchase Debt Levels (1) Includes stock repurchased during the quarter but not settled and taxes on share repurchases that will be paid after the quarter end. (2) Total Debt is presented before any reduction for deferred loan fees as required by GAAP. ($ in millions) ASSETS Cash and cash equivalents $59.1 $266.8 Other current assets 365.4 342.8 Total current assets 424.5 609.6 Investment in SSAT 98.3 84.1 Property and equipment, net 2,359.7 2,260.9 Intangible assets, net 152.9 159.4 Capital Construction Fund (CCF) 656.7 642.6 Goodwill 327.8 327.8 Other long-term assets 462.2 511.0 Total assets $4,482.1 $4,595.4 LIABILITIES AND SHAREHOLDERS’ EQUITY Current portion of debt $39.7 $39.7 Other current liabilities 507.2 520.7 Total current liabilities 546.9 560.4 Long-term debt, net of deferred loan fees 331.5 350.8 Other long-term liabilities 985.7 1,032.2 Total long-term liabilities 1,317.2 1,383.0 Total shareholders’ equity 2,618.0 2,652.0 Total liabilities and shareholders’ equity $4,482.1 $4,595.4 June 30, December 31, 2025 2024 |
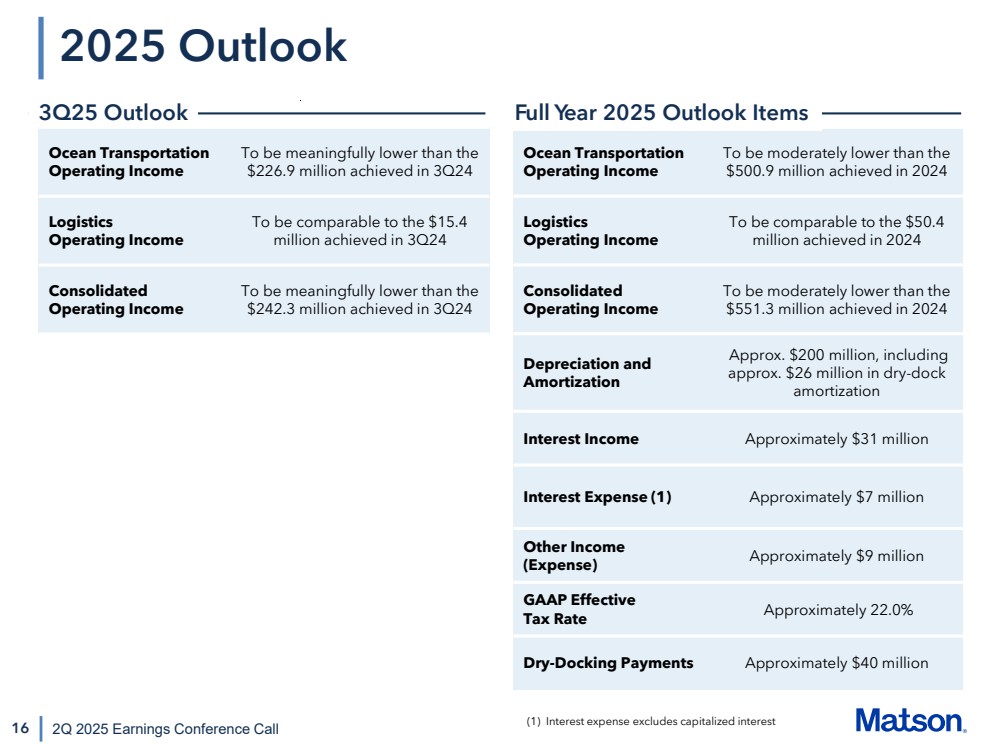
| 16 2025 Outlook 2Q 2025 Earnings Conference Call Ocean Transportation Operating Income To be moderately lower than the $500.9 million achieved in 2024 Logistics Operating Income To be comparable to the $50.4 million achieved in 2024 Consolidated Operating Income To be moderately lower than the $551.3 million achieved in 2024 Depreciation and Amortization Approx. $200 million, including approx. $26 million in dry-dock amortization Interest Income Approximately $31 million Interest Expense (1) Approximately $7 million Other Income (Expense) Approximately $9 million GAAP Effective Tax Rate Approximately 22.0% Dry-Docking Payments Approximately $40 million 3Q25 Outlook Full Year 2025 Outlook Items Ocean Transportation Operating Income To be meaningfully lower than the $226.9 million achieved in 3Q24 Logistics Operating Income To be comparable to the $15.4 million achieved in 3Q24 Consolidated Operating Income To be meaningfully lower than the $242.3 million achieved in 3Q24 (1) Interest expense excludes capitalized interest |
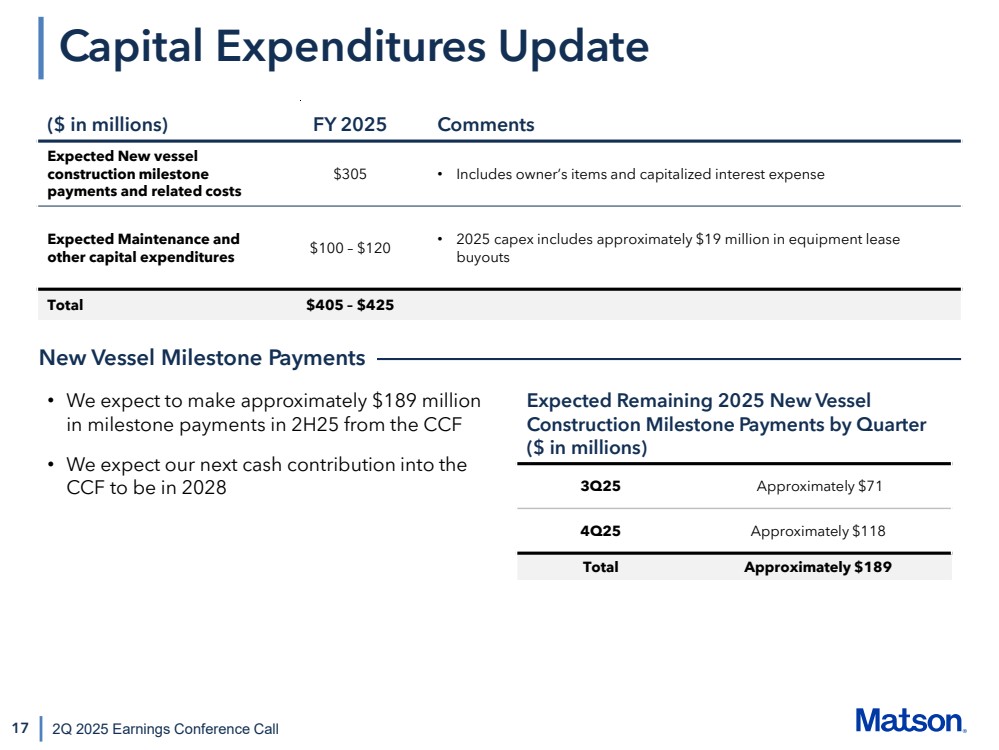
| 17 2Q 2025 Earnings Conference Call Capital Expenditures Update ($ in millions) FY 2025 Comments Expected New vessel construction milestone payments and related costs $305 • Includes owner’s items and capitalized interest expense Expected Maintenance and other capital expenditures $100 – $120 • 2025 capex includes approximately $19 million in equipment lease buyouts Total $405 – $425 • We expect to make approximately $189 million in milestone payments in 2H25 from the CCF • We expect our next cash contribution into the CCF to be in 2028 New Vessel Milestone Payments Expected Remaining 2025 New Vessel Construction Milestone Payments by Quarter ($ in millions) 3Q25 Approximately $71 4Q25 Approximately $118 Total Approximately $189 |
| 18 Closing Thoughts 2Q 2025 Earnings Conference Call • We are well-positioned in our tradelanes and in logistics as we manage through this period of market uncertainty and volatility ─ It is during uncertain times like these that Matson demonstrates its unique capabilities and service qualities across our organization • With our China service, we are focused on maintaining the two fastest and most reliable Transpacific services • We are also focused on being there for our customers, looking for additional opportunities to support them with world-class services and customer support as they diversify their manufacturing base and grow in an evolving marketplace |
| Appendix |
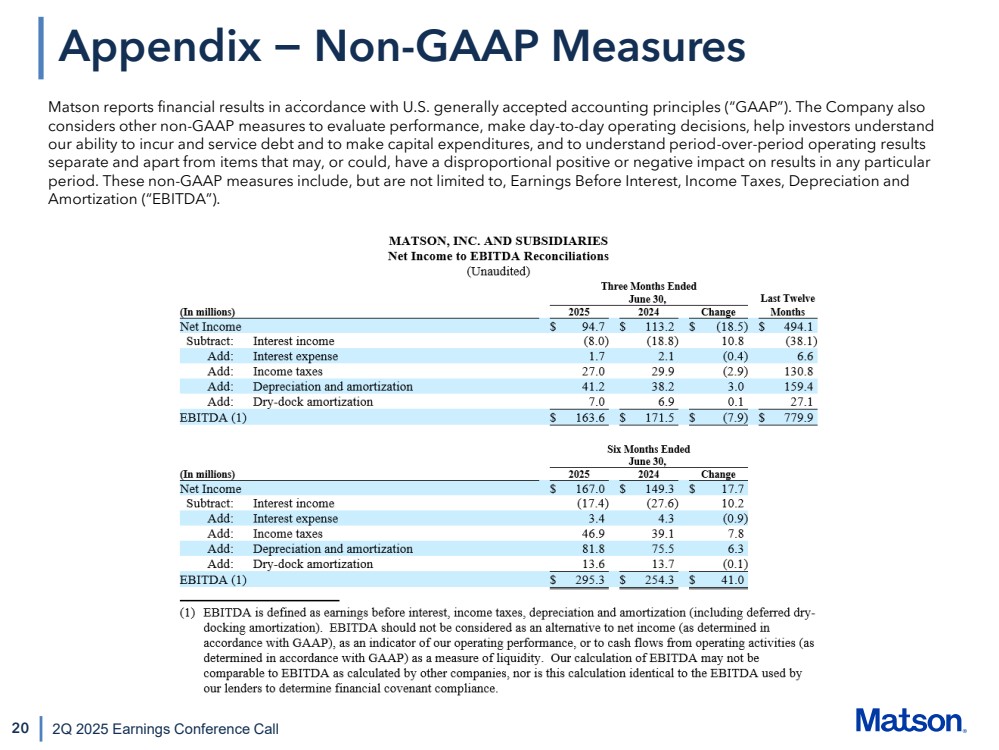
| 20 2Q 2025 Earnings Conference Call Appendix − Non-GAAP Measures Matson reports financial results in accordance with U.S. generally accepted accounting principles (“GAAP”). The Company also considers other non-GAAP measures to evaluate performance, make day-to-day operating decisions, help investors understand our ability to incur and service debt and to make capital expenditures, and to understand period-over-period operating results separate and apart from items that may, or could, have a disproportional positive or negative impact on results in any particular period. These non-GAAP measures include, but are not limited to, Earnings Before Interest, Income Taxes, Depreciation and Amortization (“EBITDA”). |