| GreenPower Motor Company Inc. Management's Discussion and Analysis For the year ended March 31, 2025 Discussion dated: July 30, 2025 |
Introduction
This Management's Discussion and Analysis ("MD&A") is dated July 30, 2025 unless otherwise indicated and should be read in conjunction with the audited consolidated financial statements of GreenPower Motor Company Inc. ("GreenPower", "the Company", "we", "our" or "us") for the year ended March 31, 2025 and the related notes, and the Company's filings through the U.S. Securities and Exchange Commission, as filed on EDGAR. This MD&A was written to comply with the requirements of National Instrument 51-102 - Continuous Disclosure Obligations. Results are reported in US dollars, unless otherwise noted. In the opinion of management, all adjustments considered necessary for a fair presentation have been included. The results presented for the three months and year ended March 31, 2025 are not necessarily indicative of the results that may be expected for any future period. These consolidated financial statements, including comparatives, have been prepared using accounting policies consistent with International Financial Reporting Standards and International Accounting Standards as issued by the International Accounting Standards Board (IASB) and Interpretations (collectively IFRS Accounting Standards). The Company's IFRS accounting policies are set out in Note 2 of the audited consolidated financial statements.
For the purposes of preparing this MD&A, management, in conjunction with the Board of Directors, considers the materiality of information. Information is considered material if: (i) such information results in, or would reasonably be expected to result in, a significant change in the market price or value of the Company's common shares; or (ii) there is a substantial likelihood that a reasonable investor would consider it important in making an investment decision; or (iii) if it would significantly alter the total mix of information available to investors. Management, in conjunction with the Board of Directors, evaluates materiality with reference to all relevant circumstances, including potential market sensitivity.
Further information about the Company and its operations can be obtained from the offices of the Company or from www.sedarplus.com. Information in these websites do not form part of this report and are not incorporated by reference.
Cautionary Note Regarding Forward-Looking Information
Certain statements contained in the following MD&A may contain forward-looking statements within the meaning of certain securities laws, including the "safe harbour" provisions of the United States Private Securities Litigation Reform Act of 1995 and applicable Canadian securities legislation. Forward-looking statements in this MD&A may include, but are not limited to statements involving estimates, assumptions or judgements, and these statements may be identified by words such as "believe", "expect", "expectation", "aim", "achieve", "intend", "commit", "goal", "plan", "strive" and "objective", and similar expressions of future or conditional verbs such as "will", "may", "might", "should", "could" or "would". By their very nature, forward-looking statements require us to make assumptions and are subject to inherent risks and uncertainties, which give rise to the possibility that our expectations or conclusions will not prove to be accurate, that our assumptions may not be correct, and that our plans, goals, expectations and objectives will not be achieved. We caution readers not to place undue reliance on these statements as a number of risk factors could cause our actual results to differ materially from the expectations expressed in such forward-looking statements.
Non-IFRS Measures and Other Supplementary Performance Metrics
This MD&A includes certain non-IFRS measures and other supplementary performance metrics, which are defined below. These measures do not have any standardized meaning prescribed by IFRS and are therefore unlikely to be comparable to similar measures presented by other companies. Investors are cautioned that non-GAAP financial measures should not be construed as an alternative to IFRS measures. Rather, these measures are provided as additional information to complement those IFRS measures by providing further understanding of the Company's results of operations from management's perspective. Accordingly, they should not be considered in isolation nor as a substitute for analysis of the Company's financial information reported under IFRS.
| GreenPower Motor Company Inc. Management's Discussion and Analysis For the year ended March 31, 2025 Discussion dated: July 30, 2025 |
Readers should not rely on any single financial measure to evaluate GreenPower's business.
This MD&A refers to Adjusted EBITDA "Adjusted EBITDA", a non-IFRS measure, which is defined as loss for the year (for annual periods) or loss for the period (for quarterly periods), plus depreciation, plus interest and accretion, plus share-based payments, plus / (less) the allowance / (recovery) for credit losses, plus / (less) the increase / (decrease) in the warranty liability, plus taxes. Adjusted EBITDA is a measure used by management as an indicator of profitability since it excludes the impact of movements in working capital items, certain non-cash charges, and financing costs. Therefore, Adjusted EBITDA gives the investor information as to the profitability of the business. However, Adjusted EBITDA is not a measure of financial performance under IFRS and should not be considered a substitute for other financial measures of performance. Adjusted EBITDA as calculated by GreenPower may not be comparable to Adjusted EBITDA as calculated and reported by other companies. The most comparable IFRS measure to Adjusted EBITDA is net loss.
This MD&A also makes reference to "Total Cash Expenses", a non-IFRS measure, which is defined as sales, general and administrative costs plus interest and accretion, plus/(less) foreign exchange loss/(gain), less depreciation, less share-based payments less amortization of deferred financing fees, plus/(less) the decrease/(increase) in warranty liability, plus / (less) the (allowance) / recovery for credit losses. Total Cash Expenses is a measure used by management as an indicator of sales, general and administrative, interest and accretion, and foreign exchange costs that excludes the impact of certain non-cash charges. Management believes that Total Cash Expenses provides a measure of cash expenses from the operations of the business. However, Total Cash Expenses is not a measure of financial performance under IFRS and should not be considered a substitute for other financial measures of performance. Total Cash Expenses as calculated by GreenPower may not be comparable to Total Cash Expenses as calculated and reported by other companies.
This MD&A also makes reference to "Vehicle Deliveries", a supplementary performance metric, that management believes provides useful information regarding the business activity of the Company during a quarter or year. Vehicle Deliveries is vehicles that have been sold or leased to a customer during a quarter or a year, as determined by management. The models of vehicles included in Vehicle Deliveries will vary over time, such that Vehicle Deliveries in one period may not be comparable to Vehicle Deliveries in another period. Vehicle Deliveries is not a financial metric, and vehicle deliveries is not an indication of the Company's financial performance in a given period. While management considers Vehicle Deliveries to be a useful supplementary performance metric, users are cautioned to consider other factors to evaluate GreenPower's business.
Description of Business
GreenPower designs, builds and distributes a full suite of high-floor and low-floor all-electric medium and heavy-duty vehicles, including transit buses, school buses, shuttles, cargo vans and a cab and chassis. GreenPower employs a clean-sheet design to manufacture all-electric buses that are purpose built to be battery powered with zero emissions while integrating global suppliers for key components. This Original Equipment Manufacturer ("OEM") platform allows GreenPower to meet the specifications of various operators while providing standard parts for ease of maintenance and accessibility for warranty requirements. GreenPower was founded in Vancouver, British Columbia, Canada with primary operational facilities in southern California and a manufacturing facility in West Virginia. Listed on the TSX Venture Exchange since November 2015, GreenPower completed its U.S. IPO and NASDAQ listing in August 2020. For further information go to www.greenpowermotor.com.
| GreenPower Motor Company Inc. Management's Discussion and Analysis For the year ended March 31, 2025 Discussion dated: July 30, 2025 |
Operations
The following is a description of GreenPower's business activities during the year ended March 31, 2025. During the year, the Company delivered a total of 84 vehicles, which were comprised of 23 EV star Cargo and Cargo plus, 25 EV Stars, 34 BEAST Type D school buses, and 2 Nano BEAST Type A school buses. During the year GreenPower generated annual revenue of $19.8 million, which was a decline of 49.5% from the prior year.
During the year GreenPower sales mix continued to transition towards all-electric school buses, with the sale and delivery of 34 BEASTs and 2 Nano BEASTs during the year. Going forward, GreenPower anticipates that the sales mix within the school bus segment will transition from sales of BEASTs to sales of Nano BEASTs due to expected cost increases on BEAST production from recently imposed tariffs on imports to the United States.
In addition to school bus sales, GreenPower completed the sale of 23 EV Star Cargo and Cargo Plus vehicles, and 25 EV Stars during the year. Importantly, demand for GreenPower's EV Star line of products is geographically dispersed, with sales in the US West Coast, mid-west and East Coast, as well as Canadian sales in Western provinces, and the province of Ontario. GreenPower is actively working on completion of commercial vehicle orders that are expected to deliver in the current quarter, and continues to expand sales into new states and provinces.
The Company continues to access the capital markets, with the completion of two securities offerings during the year, and the completion of an ATM filing in March 2025 for the issuance of up to $850,000 of equity through open market sales on the Nasdaq stock market from time to time. The Company completed an underwritten offering of common shares for gross proceeds of $3 million in October 2024, which included 150,000 warrants issued to the underwriter, with a three-year term and exercise price of $1.25 per share. In May 2024 the Company completed a unit offering in which it issued 1,500,000 common shares and warrants to purchase 1,575,000 common shares for gross proceeds of $2,325,750 before deducting underwriting discounts and offering expenses. The warrants have an exercise price of $1.82 per share and expire on May 9, 2027.
GreenPower began a process of reducing its operating costs at the end of the fiscal year, and will continue to take steps to reduce its costs in the current year. During the fourth quarter of the year GreenPower began the process of consolidating its California operations into a new manufacturing facility in Riverside California. This facility offers a location that is close to its major customers in the LA area, and is conveniently located near the Long Beach port and major transportation routes. The movement of GreenPower's manufacturing facility led to an immediate reduction in rent expense, and additional savings in areas such as transportation, travel, salaries and other administrative expenses are expected to continue from these changes over the next several quarters.
As at March 31, 2025, the Company had:
| GreenPower Motor Company Inc. Management's Discussion and Analysis For the year ended March 31, 2025 Discussion dated: July 30, 2025 |
Trends
The Company does not know of any trends, commitments, events, or uncertainty that are expected to have a material effect on the Company's business, financial condition, or results of operations other than as disclosed herein under "Risk Factors".
Annual Results of Operations
Year ended March 31, 2025
For the year ended March 31, 2025 the Company generated revenue of $19,847,279 compared to $39,271,839 for the previous year, a decrease of 49.5%. Cost of sales of $17,650,661 yielding a gross profit of $2,196,618 or 11.1% of revenue. Revenue for the year was generated from the sale of 23 EV star Cargo and Cargo plus, 25 EV Stars, 34 BEAST Type D school buses, 2 Nano BEAST Type A school buses, as well as revenue from truck body manufacturing, revenue from the sale of vehicle parts and service, from vehicle transportation, from finance income, and revenue from finance and operating leases. Operating costs consist of salaries and administration of $9,912,495 relating to salaries, employee benefits, and administrative services; transportation costs of $264,344 which relate to the use of trucks, trailers, tractors as well as other operational costs needed to transport company products around North America; insurance expense of $1,727,831; travel, accommodation, meals and entertainment costs of $397,749 related to travel for project management, demonstration of company products, and trade shows; product development costs of $1,339,200; sales and marketing costs of $997,772; interest and accretion of $2,176,337; professional fees of $1,672,938 consisting of legal and audit fees; as well as non-cash expenses including $897,468 of share-based compensation expense, depreciation of $1,662,113, and an allowance for credit losses of $(12,277). The remaining operating costs for the period amounted to $1,256,499 in office expenses, other income of $1,391,746, and a foreign exchange gain of $40,657, resulting in a consolidated net loss of $18,663,448. The consolidated total comprehensive loss for the year of $18,511,895 was impacted by $151,553 of other comprehensive income as a result of the translation of the entities with a different functional currency than presentation currency.
Year ended March 31, 2024
For the year ended March 31, 2024 the Company generated revenue of $39,271,839 compared to $39,695,890 for the previous year, a decrease of 1.1%. Cost of sales of $33,914,237 yielding a gross profit of $5,357,602 or 13.6% of revenue. Revenue for the year was generated from the sale of EV Star CC's, EV Star 22 foot cargo, EV Star Cargo Plus, EV Stars, 29 BEAST Type D school buses, 12 Nano BEAST Type A school buses, and 2 EV 250's, as well as revenue from truck body manufacturing, revenue from the sale of vehicle parts and service, from vehicle transportation, from finance income, and revenue from finance and operating leases. Operating costs consist of salaries and administration of $8,814,561 relating to salaries, employee benefits, and administrative services; transportation costs of $212,263 which relate to the use of trucks, trailers, tractors as well as other operational costs needed to transport company products around North America; insurance expense of $1,716,157; travel, accommodation, meals and entertainment costs of $599,169 related to travel for project management, demonstration of company products, and trade shows; product development costs of $1,811,472; sales and marketing costs of $661,426 interest and accretion of $1,554,858; professional fees of $1,925,938 consisting of legal and audit fees; as well as non-cash expenses including $1,502,112 of share-based compensation expense, depreciation of $1,858,458, and an allowance for credit losses of $1,450,962. The remaining operating costs for the period amounted to $1,607,459 in office expenses, other income of $306,288, a foreign exchange gain of $131,416 and a write down of $423,267 on finance lease receivables, resulting in a consolidated net loss of $18,342,796. The consolidated total comprehensive loss for the year of $18,313,249 was impacted by $29,547 of other comprehensive income as a result of the translation of the entities with a different functional currency than presentation currency.
| GreenPower Motor Company Inc. Management's Discussion and Analysis For the year ended March 31, 2025 Discussion dated: July 30, 2025 |
Year ended March 31, 2023
For the year ended March 31, 2023 the Company generated revenue of $39,695,890 compared to $17,236,773 for the previous year, an increase of 130.3%. Cost of sales of $32,445,836 yielding a gross profit of $7,250,054 or 18.3% of revenue. Revenue for the year was generated from the sale of 226 EV Star CC's, 40 EV Star 22 foot cargo, 3 EV Star Cargo Plus, 19 EV Stars, 7 BEAST Type D school buses, 2 Nano BEAST Type A school buses, and 2 EV 250's, as well as revenue from truck body manufacturing, revenue from the sale of vehicle parts and service, from vehicle transportation, from finance income, and revenue from finance and operating leases. Operating costs consist of salaries and administration of $7,394,085 relating to salaries, employee benefits, and administrative services; transportation costs of $324,773 which relate to the use of trucks, trailers, tractors as well as other operational costs needed to transport company products around North America; insurance expense of $1,801,665; travel, accommodation, meals and entertainment costs of $748,299 related to travel for project management, demonstration of company products, and trade shows; product development costs of $2,090,338; sales and marketing costs of $818,289 interest and accretion of $1,549,769; professional fees of $1,477,094 consisting of legal and audit fees; as well as non-cash expenses including $3,645,893 of share-based compensation expense, depreciation of $1,219,223, and an allowance for credit losses of $95,153. The remaining operating costs for the period amounted to $920,468 in office expenses, other income of $72,867 from the gain on sale of property in California, a foreign exchange loss of $30,897 and a write down of $250,832 of goodwill recognized on the acquisition of Lion Truck Body, resulting in a consolidated net loss of $15,043,857.The consolidated total comprehensive loss for the year of $15,056,864 was impacted by $13,007 of other comprehensive loss as a result of the translation of the entities with a different functional currency than presentation currency.
The consolidated total comprehensive loss for the year was impacted by $39,413 of other comprehensive loss as a result of the translation of the entities with a different functional currency than presentation currency.
| GreenPower Motor Company Inc. Management's Discussion and Analysis For the year ended March 31, 2025 Discussion dated: July 30, 2025 |
Comparison of Annual Results
The following table compares the annual results of GreenPower for the years ended March 31, 2025, 2024 and 2023:
| For the years ended | Percentage Change | $ Change | |||||||||||||||||||
| March 31, | March 31, | March 31, | 2025 to | 2024 to | 2025 to | 2024 to | |||||||||||||||
| 2025 | 2024 | 2023 | 2024 | 2023 | 2024 | 2023 | |||||||||||||||
| Revenue | $ | 19,847,279 | $ | 39,271,839 | $ | 39,695,890 | -49.5% | -1.1% | $ | (19,424,560 | ) | $ | (424,051 | ) | |||||||
| Cost of sales | 17,650,661 | 33,914,237 | 32,445,836 | -48.0% | 4.5% | (16,263,576 | ) | 1,468,401 | |||||||||||||
| Gross Profit | 2,196,618 | 5,357,602 | 7,250,054 | -59.0% | -26.1% | (3,160,984 | ) | (1,892,452 | ) | ||||||||||||
| Gross profit margin1 | 11.1% | 13.6% | 18.3% | -2.6% | -4.6% | ||||||||||||||||
| Sales, general and administrative costs | |||||||||||||||||||||
| Salaries and administration | 9,912,495 | 8,814,561 | 7,394,085 | 12.5% | 19.2% | 1,097,934 | 1,420,476 | ||||||||||||||
| Depreciation | 1,662,113 | 1,858,458 | 1,219,223 | -10.6% | 52.4% | (196,345 | ) | 639,235 | |||||||||||||
| Product development costs | 1,339,200 | 1,811,472 | 2,090,338 | -26.1% | -13.3% | (472,272 | ) | (278,866 | ) | ||||||||||||
| Office expense | 1,256,499 | 1,607,459 | 920,468 | -21.8% | 74.6% | (350,960 | ) | 686,991 | |||||||||||||
| Insurance | 1,727,831 | 1,716,157 | 1,801,665 | 0.7% | -4.7% | 11,674 | (85,508 | ) | |||||||||||||
| Professional fees | 1,672,938 | 1,925,938 | 1,477,094 | -13.1% | 30.4% | (253,000 | ) | 448,844 | |||||||||||||
| Sales and marketing | 997,772 | 661,426 | 818,289 | 50.9% | -19.2% | 336,346 | (156,863 | ) | |||||||||||||
| Share-based payments | 897,468 | 1,502,112 | 3,645,893 | -40.3% | -58.8% | (604,644 | ) | (2,143,781 | ) | ||||||||||||
| Transportation costs | 264,344 | 212,263 | 324,773 | 24.5% | -34.6% | 52,081 | (112,510 | ) | |||||||||||||
| Travel, accomodation, meals and entertainment | 397,749 | 599,169 | 748,299 | -33.6% | -19.9% | (201,420 | ) | (149,130 | ) | ||||||||||||
| Allowance for credit losses | (12,277 | ) | 1,450,962 | 95,153 | -100.8% | 1424.9% | (1,463,239 | ) | 1,355,809 | ||||||||||||
| Total sales, general and administrative costs | 20,116,132 | 22,159,977 | 20,535,280 | -9.2% | 7.9% | (2,043,845 | ) | 1,624,697 | |||||||||||||
| Loss from operations before interest, accretion and foreign exchange | (17,919,514 | ) | (16,802,375 | ) | (13,285,226 | ) | 6.6% | 26.5% | (1,117,139 | ) | (3,517,149 | ) | |||||||||
| Interest and accretion | (2,176,337 | ) | (1,554,858 | ) | (1,549,769 | ) | 40.0% | 0.3% | (621,479 | ) | (5,089 | ) | |||||||||
| Other Income | 1,391,746 | 306,288 | 72,867 | 354.4% | 320.3% | 1,085,458 | 233,421 | ||||||||||||||
| Foreign exchange gain / (loss) | 40,657 | 131,416 | (30,897 | ) | -69.1% | -525.3% | (90,759 | ) | 162,313 | ||||||||||||
| Loss from operations for the year | (18,663,448 | ) | (17,919,529 | ) | (14,793,025 | ) | 4.2% | 21.1% | (743,919 | ) | (3,126,504 | ) | |||||||||
| Other item | - | - | |||||||||||||||||||
| Write down of assets | - | (423,267 | ) | (250,832 | ) | -100.0% | NM | 423,267 | (172,435 | ) | |||||||||||
| Loss for the year | (18,663,448 | ) | (18,342,796 | ) | (15,043,857 | ) | 1.7% | 21.9% | (320,652 | ) | (3,298,939 | ) | |||||||||
| Other comprehensive income / (loss) | |||||||||||||||||||||
| Cumulative translation reserve | 151,553 | 29,547 | (13,007 | ) | NM | NM | 122,006 | 42,554 | |||||||||||||
| Total comprehensive loss for the year | $ | (18,511,895 | ) | $ | (18,313,249 | ) | $ | (15,056,864 | ) | 1.1% | 21.6% | $ | (198,646 | ) | $ | (3,256,385 | ) | ||||
| Loss per common share, basic and diluted | $ | (0.68 | ) | $ | (0.74 | ) | $ | (0.64 | ) | -8.1% | 15.6% | $ | 0.06 | $ | (0.10 | ) | |||||
| Weighted average number of common shares outstanding, basic and diluted | 27,580,203 | 24,950,961 | 23,522,755 | 10.5% | 6.1% | 2,629,242 | 1,428,206 | ||||||||||||||
(1) Gross profit margin, a supplementary financial metric, is calculated as gross profit divided by revenue. Gross profit margin is not a defined term under IFRS.
| GreenPower Motor Company Inc. Management's Discussion and Analysis For the year ended March 31, 2025 Discussion dated: July 30, 2025 |
Change in Revenue
The annual decrease in revenue for the year ended March 31, 2025 compared to the year ended March 31, 2024 was $ 19,424,560 or 49.5%. This decrease was the result of 138 fewer vehicles delivered during the year ended March 31, 2025 compared to the prior year due primarily to no sales of EV Star CC's to Workhorse during the year ended March 31, 2025 compared to sales of 105 EV Star CC's in the year ended March 31, 2024, as Workhorse requested that GreenPower pause deliveries of EV Star CC's which Workhorse ordered from GreenPower.
The annual decrease in revenue for the year ended March 31, 2024 compared to the year ended March 31, 2023 was $424,051 or 1.1%. This decrease was the result of 77 fewer vehicles delivered during the year ended March 31, 2024 compared to the prior year, which was almost entirely offset by sales of a higher number of vehicles with a higher per unit price, including Type D BEAST and Type A Nano BEAST.
Change in Cost of Sales and Gross Profit and Gross Profit Margin
The annual decrease in cost of sales for the year ended March 31, 2025 compared to the year ended March 31, 2024 was $16,263,576 or 48.0%, resulting in a decrease in gross profit of $3,160,984 or 59.0%. During the year ended March 31, 2025 GreenPower delivered a total of 84 vehicles compared to 222 in the prior year, a decrease of 138 vehicle deliveries, which caused the reduction in cost of sales. The reduction in gross profit over the year was primarily due to lower sales year over year, and due to negative gross profit at GP Truck Body, an inventory writedown of $530,675 included in cost of sales, and a low gross profit margin at GreenPower West Virginia.
The annual increase in cost of sales for the year ended March 31, 2024 compared to the year ended March 31, 2023 was $1,468,401 or 4.5%, resulting in a decrease in gross profit of $1,892,452 or 26.1%. During the year ended March 31, 2024 GreenPower delivered a total of 222 vehicles compared to 299 in the prior year, a decrease of 77 vehicle deliveries. The increase in cost of sales and reduction in gross profit over the year was due to an increase of inventory writedowns included in cost of sales of $886,854, and due to the application of overhead costs from our West Virginia facility. The application of overhead costs in West Virginia was applied to levels of production that are below capacity, and it is anticipated that allocated costs on a per unit basis will decline as production at the facility increases.
Gross profit margin (defined as gross profit over sales) for the years ended March 2025, 2024 and 2023 was 11.1%, 13.6%, and 18.3% respectively. Gross profit margin declined by 2.6% between March 31, 2025 and March 31, 2024 due to negative gross profit at GP Truck Body, combined with a writedown of inventory of $530,675, and a low gross profit margin at GreenPower West Virginia. The low gross profit margin at GP West Virginia, though slightly improved from the prior year, remained below expectations due to the application of overhead costs in West Virginia applied to levels of production that are below capacity. Gross profit margin declined by 4.6% between March 31, 2024 and March 31, 2023 due to an increase of inventory writedowns included in cost of sales of $886,854, which accounted for 2.3% of the decline, due to the application of overhead costs from our West Virginia facility, and due to below target gross margins at GP Truck Body.
Change in Salaries and Administration
The annual increase in salaries and administration expense for the year ended March 31, 2025 compared to the year ended March 31, 2024 was $1,097,934 or 12.5%. The increase over the period was due to salary increases for existing employees, and due to increased labor costs in West Virginia due to the increased number of employees in that subsidiary. The annual increase in salaries and administration expense for the year ended March 31, 2024 compared to the year ended March 31, 2023 was $1,420,476 or 19.2%. The increase over the period was due to salary increases for executive officers and existing employees, and an increase in the number of employees over the period to 116 employees at March 31, 2024 compared to 112 employees at March 31, 2023.
| GreenPower Motor Company Inc. Management's Discussion and Analysis For the year ended March 31, 2025 Discussion dated: July 30, 2025 |
Change in Depreciation
Depreciation expense declined for the year ended March 31, 2025 compared to the year ended March 31, 2024 by $196,345 or 10.6%. This reduction was primarily due to a reduction in depreciation on right of use assets due to several property leases being re-classified from right of use assets to short term leases with no depreciation driven by non-renewal of expiring contracts, and from certain fixed assets which were fully depreciated during the year ended March 31, 2025, for which depreciation expense was recorded during the year ended March 31, 2024.
The annual increase in depreciation for the year ended March 31, 2024 compared to the year ended March 31, 2023 was $639,235 or 52.4%. Approximately $210,000 of this increase was from an increase in depreciation on right of use assets, with the remainder from an increase in depreciation expense on GreenPower's property, plant and equipment acquired during the year and depreciation expense on assets transferred to property, plant and equipment from inventory during the year.
Change in Product Development Costs
Product development costs declined by $472,272 or 26.1% between March 31, 2025 and March 31, 2024. The decrease was primarily attributable to a significant reduction in warranty accrual, resulting from the decline in sales during the year, as the accrual is determined based on a fixed percentage of revenue. In addition, the decrease reflected lower other product development costs, mainly consisting of vehicle parts and related development expenses.
Product development costs declined by $278,866 or 13.3% between March 31, 2024 and March 31, 2023. This decrease was primarily due to a reduction in other product development costs primarily comprised of vehicle parts and related expenses used in product development activities and to a small reduction in warranty accrual, which is a fixed percentage of sales.
Change in Share-Based Payments
Share-based payment expense for the year ended March 31, 2025 compared to the year ended March 31, 2024 declined by $604,644 or 40.2%, and declined by $2,143,781 or 58.8% for the year ended March 31, 2024 compared to March 31, 2023.
Share based payment expense is for non-cash stock option grants, where the value of stock option grants are calculated on the date of the grant using the Black Scholes method and recognized in earnings over the stock option's vesting period. The reduction in share-based payment expense during the years ended March 31, 2025 and March 31, 2024 compared to the prior years was due to a lower stock option expense recognized during each year and due to forfeited stock options during both periods.
Change in Transportation Costs
The annual increase in transportation costs for the year ended March 31, 2025 compared to the year ended March 31, 2024 was $52,081 or 24.5%, primarily due to additional non-sales-related transportation expenses incurred as a result of the company's relocation to the Riverside facility, which took place at the end of the fiscal year.
The annual decrease in transportation costs for the year ended March 31, 2024 compared to the year ended March 31, 2023 was $112,510 or 34.6%. This decrease was due to a reduction in costs related to shipping vehicles for non-sales purposes.
| GreenPower Motor Company Inc. Management's Discussion and Analysis For the year ended March 31, 2025 Discussion dated: July 30, 2025 |
Change in Interest and Accretion
Interest and accretion expense increased in the year ended March 31, 2025 compared to the year ended March 31, 2024 by $621,479 or 40.0%, and increased in the year ended March 31, 2024 compared to the year ended March 31, 2023 by $5,089 or 0.3%. The change in interest and accretion expense in the year ended March 31, 2025 compared to the prior year was primarily attributable to higher interest incurred on related party loans, as well as increased utilization of the line of credit facility.
The change in interest and accretion expense in the year ended March 31, 2024 compared to the prior year was due to a reduction in interest and accretion on loans from related parties, which was partially offset by interest expense incurred on the term loan facility during the final quarter of the year.
Change in Other Income
Other income of $1,391,746 during the year ended March 31, 2025 was the result of the derecognition of a contingent liability related to the dissolution of Lion Truck Body. Other Income of $306,288 during the year ended March 31, 2024 was the result of a non cash gain from loans from related parties. Changes in other income during each of these years was due to these unrelated non-recurring events.
Change in Office Expense
Office expense decreased by $350,960 or 21.8% during the year ended March 31, 2025 compared to the prior year, and increased by $686,991 or 74.6% during the year ended March 31, 2024 compared to the prior year. The decrease in office expense during the year ended March 31, 2025 was primarily due to cost-saving initiatives, a reduction in maintenance and utility expenses at facilities, and lower spending as the West Virginia office location transitioned into stable, routine operations. The increase in office expense during the year ended March 31, 2024 was due to general inflation increases in maintenance and utilities expense, as well as full year of expense associated with the West Virginia property during the current year.
Change in Insurance Expense
Insurance expense increased by $11,674 or 0.7% during the year ended March 31, 2025 compared to the prior year, primarily due to slightly higher premiums on renewed insurance policies. Insurance expense decreased by $85,508 or 4.7% during the year ended March 31, 2024 compared to the prior year primarily due to a reduction in premiums charged on the Company's insurance policies.
Change in Professional Fees
Professional fees decreased by $253,000 or 13.1% during the year ended March 31, 2025 compared to the prior year, and increased by $448,844 or 30.4% during the year ended March 31, 2024 compared to the prior year. The decrease in the year ended March 31, 2025 was primarily due to a reduction in legal fees and other professional services supporting operations, partially offset by an accrual of $310,000 for potential legal judgements. The increase in the year ended March 31, 2024 was primarily due to increased legal costs associated with general corporate matters and litigation.
Change in Sales and Marketing and Travel, Accommodation, Meals and Entertainment
Sales and marketing expense for the year ended March 31, 2025 increased by $336,346 or 50.9%, and travel, accommodation, meals and entertainment expenses decreased by $201,420 or 33.6% compared to the prior year. The increase in sales and marketing expense was due to greater investment in promotional activities and campaigns, while the decrease in travel-related expenses was due to fewer in-person events and continued cost control over discretionary spending.
| GreenPower Motor Company Inc. Management's Discussion and Analysis For the year ended March 31, 2025 Discussion dated: July 30, 2025 |
Sales and marketing expense for the year ended March 31, 2024 decreased by $156,863 or 19.2% and travel, accommodation, meals and entertainment expenses decreased by $149,130 or 19.9% compared to the prior year. The decrease in both of these expenses was due to a general reduction in the Company's attendance at trade shows and sales and marketing events compared to the prior year.
Change in Other Costs
The allowance for credit losses in the year ended March 31, 2025 decreased by $1,463,239 or 100.8% compared to the prior year, primarily due to the collection of prior year allowances related to certain overdue customer accounts. The allowance for credit losses in the year ended March 31, 2024 increased by $1,355,809 or 1,424.9% compared to the prior year primarily due to allowances associated with accounts receivable and a promissory note receivable owed by a single lease customer, and to accounts receivable from other customers that was over 90 days past due. Annual changes in foreign exchange gain / (loss) is caused by the Company's exposure to changes in foreign currency exchange rates due to financial assets and liabilities in foreign currency. The Company is exposed to foreign currency risk from assets and liabilities in CDN dollars, as described in the Market risks section.
Change in Write Down of Assets
During the year ended March 31, 2025, the Company had a write down of assets of $nil. During the year ended March 31, 2024, the Company had a write down of assets of $423,267 from the write down of finance lease receivables with overdue lease payments.
Change in Loss for the Year and Loss per Common Share
The loss for the year ended March 31, 2025 increased by $320,652 or 1.7% compared to the prior year. The slight increase in loss was primarily due to a $3,160,984 reduction in gross profit, partially offset by a decrease in selling, general and administrative costs and an increase in other income.
The loss for the year ended March 31, 2024 increased by $3,298,939 or 21.9% compared to the prior year. The majority of this loss was due to a reduction of $1,892,452 in gross profit earned in the current year, with the remainder caused by an increase in selling, general and administrative costs, partially offset by a reduction in interest and accretion.
The loss for the year ended March 31, 2023 increased by $33,937, or 0.2% compared to the prior year, and was due to an increase in the Company's gross profit, which more than offset increases in the Company's selling, general and administrative costs and other expenses.
| GreenPower Motor Company Inc. Management's Discussion and Analysis For the year ended March 31, 2025 Discussion dated: July 30, 2025 |
Changes in Consolidated Statements of Financial Position
The table below illustrates changes in selected components of GreenPower's consolidated financial position as of March 31, 2025 and March 31, 2024, and an explanation of changes in these components.
| (Expressed in US Dollars) |
March 31, 2025 |
March 31, 2024 |
Annual Change ($) |
Explanation | ||||||
| Cash and restricted cash | $ | 344,244 | $ | 1,150,891 | (806,647 | ) | See liquidity and capital resources sections of this report. | |||
| Accounts receivable, net of allowances | 541,793 | 2,831,942 | (2,290,149 | ) | Decrease due to accounts receivable collected during the year and reduced AR due to lower sales. | |||||
| Inventory | 25,601,888 | 32,010,631 | (6,408,743 | ) | Reduction due to sales of finished goods inventory and a write down of inventory during the year, and lower work in process at March 31, 2025. | |||||
| Current assets | 27,775,068 | 36,853,355 | (9,078,287 | ) | Primarily due to reductions in accounts receivable and inventory. | |||||
| Finance lease receivables | 136,928 | 1,158,384 | (1,021,456 | ) | Reduction due to de-recognition of finance leases, impairment on finance leases, and lease payments received during the year ended March 31, 2025. | |||||
| Right of use assets | 5,479,555 | 4,124,563 | 1,354,992 | Due to a new right of use asset recognized from the lease of a production facility in Riverside, CA. | ||||||
| Property and equipment | 1,310,581 | 2,763,525 | (1,452,944 | ) | Reduction due to property and equipment transferred to inventory that was subsequently sold. | |||||
| Total assets | 35,071,725 | 45,203,284 | (10,131,559 | ) | Due to reductions in cash, accounts receivable, inventory, finance lease receivables and property and equipment. | |||||
| Line of credit | 5,983,572 | 7,463,206 | (1,479,634 | ) | See liquidity and capital resources sections of this report. | |||||
| Accounts payable and accrued liabilities | 3,719,716 | 2,977,251 | 742,465 | Due to payments to suppliers and for investments in inventory. | ||||||
| Deferred revenue | 10,138,356 | 9,942,385 | 195,971 | Due to additional deposits received from customers. | ||||||
| Loans payable to related parties | 4,184,045 | 2,432,180 | 1,751,865 | New loans from related parties advanced during the year. | ||||||
| Term loan facility | 3,591,354 | 2,267,897 | 1,323,457 | Term loan facility entered into during the year. | ||||||
| Current liabilities | 19,668,259 | 21,291,590 | (1,623,331 | ) | Due to a reduction in line of credit and other current liabilities. | |||||
| Lease liabilities | 6,168,086 | 4,636,211 | 1,531,875 | Due to a new right of use asset recognized from the lease of a production facility in Riverside, CA. | ||||||
| Contingent liability | 310,000 | 1,391,746 | (1,081,746 | ) | Due to the dissolution of Lion Truck Body, offset by contingent liability for legal matters. | |||||
| Warranty liability | 2,565,429 | 2,499,890 | 65,539 | Increase due to warranty accrual on sales, net of warranty disbursements, during the year ended March 31, 2025. | ||||||
| Total liabilities | 36,677,691 | 33,636,465 | 3,041,226 | Due to the increases in accounts payable, deferred revenue, term loan facility, lease liabilities, warranty liability and loans to related parties, partially offset by reductions in other liabilities. | ||||||
| Shareholder's equity | (1,605,966 | ) | $ | 11,566,819 | (13,172,785 | ) | Due to increase in accumulated deficit, partially offset by increases in share capital from shares sold through the At the Market Equity offering and increases in reserves from stock options. |
| GreenPower Motor Company Inc. Management's Discussion and Analysis For the year ended March 31, 2025 Discussion dated: July 30, 2025 |
Cash flows
The following table summarizes cash flows from, and used in, operations, investing, financing, as well as the effect of foreign exchange, for the years ended March 31, 2025, 2024, and 2023:
| For the years ended | |||||||||
| March 31, | March 31, | March 31, | |||||||
| 2025 | 2024 | 2023 | |||||||
| Cash flow (used in) operations | $ | (5,988,173 | ) | $ | (1,132,248 | ) | $ | (14,757,939 | ) |
| Cash flow from (used in) investing | (83,172 | ) | (761,533 | ) | 303,191 | ||||
| Cash flow from financing | 5,100,272 | 2,323,833 | 8,189,280 | ||||||
| Foreign exchange on cash and restricted cash | 164,426 | 120,437 | (22,452 | ) | |||||
| Net (decrease) increase in cash and restricted cash | $ | (806,647 | ) | $ | 550,489 | $ | (6,287,920 | ) | |
Operating activities
Cash flow used in operating activities amounted to $6.0 million for the year ended March 31, 2025. The Company generated a loss for the year of $18.7 million, which included approximately $1.8 million in non-cash depreciation, share based payments, accretion and accrued interest, foreign exchange gain, allowance for credit losses, and other income. In addition, cash flow was generated from changes in working capital, including inventory of $7.9 million, and accounts receivable of $2.3 million, and other factors.
Cash flow used in operating activities amounted to $1.1 million for the year ended March 31, 2024. The Company generated a loss for the year of $18.3 million, which included approximately $6.6 million in non-cash depreciation, share based payments, accretion and accrued interest, foreign exchange gain, allowance for credit losses, other income, and write down of assets. In addition, cash flow was generated from changes in working capital, including inventory of $8.8 million, and accounts receivable of $6.3 million, which were partially offset by a decrease in accounts payable of $4.3 million, and other factors.
Cash flow used in operating activities amounted to $14.8 million for the year ended March 31, 2023. The Company generated a loss for the year of $15.0 million, which included approximately $5.5 million in non-cash depreciation, share based payments, accretion and accrued interest, amortization of deferred financing fees, foreign exchange loss, allowance for credit losses, and write down of assets. In addition, we made investments in working capital, including inventory of $8.9 million, accounts receivable of $7.3 million, which were partially offset by an increase in accounts payable of $5.8 million, and an increase in deferred revenue of $3.2 million.
Investing activities
Cash flow used in investing activities was $83,172 for the year ended March 31, 2025 resulting from $72,892 investments in property, plant and equipment.
Cash flow used in investing activities was $761,533 for the year ended March 31, 2024 resulting from a $400,000 restricted deposit investment for a surety bond and the purchase of $361,533 of property, plant and equipment.
| GreenPower Motor Company Inc. Management's Discussion and Analysis For the year ended March 31, 2025 Discussion dated: July 30, 2025 |
Cash flow from investing activities was $303,191 for the year ended March 31, 2023. During the year the Company received proceeds from the disposal of property totaling $874,184, net of fees, purchases of property and equipment totaled $355,993, and the Company's cash investment in the acquisition of Lion Truck Body totaled $215,000.
Financing activities
Cash flow from financing activities amounted to $5.1 million for the year-ended March 31, 2025. During the year the Company received gross proceeds from the issuance of common shares of $5.3 million, received loans from related parties that totaled $1.4 million, drew $1.3 million on its term loan facility, and these amounts were offset by repayment on the Company's line of credit of $1.5 million, payments on the Company's lease liabilities of $0.6 million, and equity issuance costs of $0.9M.
Cash flow from financing activities amounted to $2.3 million for the year-ended March 31, 2024. During the year the Company received gross proceeds from the issuance of shares on its ATM program of $0.5 million, drew $850,974 on the Company's line of credit, drew $2.2 million on its term loan facility, and these amounts were partially offset by $0.4 million repayments on loans to related parties, and principal payments on the Company's lease liabilities.
Cash flow from financing activities amounted to $8.2 million for the year-ended March 31, 2023. During the year the Company received gross proceeds from the issuance of shares on its ATM program of $4.9 million, received loans from related parties that totaled $3.0 million, drew $845,853 on the Company's line of credit, which were partially offset by equity offering costs and principal payments on the Company's lease liabilities.
Quarterly Results of Operations
Three months ended March 31, 2025
For the three-month period ended March 31, 2025 the Company generated revenues of $4,284,134, cost of sales of $3,823,052 yielding a gross profit of $461,082 or 10.8%, from the sale of 12 EV Star Cargo/ Cargo Plus, 2 EV Stars, 7 BEAST Type D school bus, and 1 Type A Nano BEAST, as well as revenue from truck body manufacturing, revenue from the sale of vehicle parts and service, from vehicle transportation, and revenue from finance and operating leases. Operating costs consist of administrative fees of $2,654,757 relating to salaries, project management, finance, and administrative services; transportation costs of $109,925 which is related to the use of trucks, trailers, contractors as well as other operational costs needed to transport company products around North America; insurance expense of $480,385; travel, accommodation, meals and entertainment costs of $124,950 related to travel for project management, demonstration of company products, and trade shows; product development costs of $329,798; interest and accretion of $518,752; professional fees of $750,894 consisting of legal and audit fees and an accrual for legal judgements of $310,000; as well as non-cash expenses including $63,893 of share-based compensation expense, a recovery of allowance for credit losses of $(134,295), other income of $1,391,746 and depreciation of $376,937. Excluding a foreign exchange gain of $1,836, the remaining operating costs for the period amounted to $122,288 in general corporate expenses, resulting in a consolidated net loss of $3,833,914.
| GreenPower Motor Company Inc. Management's Discussion and Analysis For the year ended March 31, 2025 Discussion dated: July 30, 2025 |
Three months ended March 31, 2024
For the three-month period ended March 31, 2024 the Company generated revenues of $5,092,890, cost of sales of $5,110,399 yielding a gross loss of $17,509 or 0.3%, from the sale of 12 EV Star CC's, 4 EV Star Cargos, 4 EV Star Cargo Plus, 2 EV Stars, 3 BEAST Type D school bus, and 1 Type A Nano BEAST, as well as revenue from truck body manufacturing, revenue from the sale of vehicle parts and service, from vehicle transportation, and revenue from finance and operating leases. Cost of Sales during the period includes an inventory write-down of $478,203, and without this write-down the gross profit margin would have been 9.0%. Operating costs consist of administrative fees of $2,410,230 relating to salaries, project management, finance, and administrative services; transportation costs of $37,439 which related to the use of trucks, trailers, contractors as well as other operational costs needed to transport company products around North America; insurance expense of $461,954; travel, accommodation, meals and entertainment costs of $184,571 related to travel for project management, demonstration of company products, and trade shows; product development costs of $233,986; interest and accretion of $668,282; professional fees of $642,734 consisting of legal and audit fees; as well as non-cash expenses including $124,227 of share-based compensation expense, allowance for credit losses of $1,136,852, other income of $306,288 and depreciation of $504,225. Excluding a foreign exchange gain of $119,272, the remaining operating costs for the period amounted to $635,128 in general corporate expenses, resulting in a consolidated net loss of $6,631,577.
Three months ended March 31, 2023
For the three-month period ended March 31, 2023 the Company generated revenues of $15,304,288, cost of sales of $12,954,808 yielding a gross profit of $2,349,480, related to the sale of 108 EV Star CC's, 6 EV Star Cargos, 3 EV Star Cargo Plus, 3 EV Stars, 1 BEAST Type D school bus, 2 EV 250's, as well as revenue from truck body manufacturing, revenue from the sale of vehicle parts and service, from vehicle transportation, and revenue from finance and operating leases. Operating costs consist of administrative fees of $2,231,376 relating to salaries, project management, finance, and administrative services; transportation costs of $153,682 which related to the use of trucks, trailers, contractors as well as other operational costs needed to transport company products around North America; insurance expense of $544,371; travel, accommodation, meals and entertainment costs of $227,118 related to travel for project management, demonstration of company products, and trade shows; product development costs of $719,906; interest and accretion of $437,284; professional fees of $406,407 consisting of legal and audit fees; as well as non-cash expenses including $468,444 of share-based compensation expense, recovery of an allowance for credit losses of $114,842 and depreciation of $402,673. Excluding a foreign exchange loss of $30,861, the remaining operating costs for the period amounted to $451,287 in general corporate expenses and a write down of goodwill of $250,832, resulting in a consolidated net loss of $3,859,919.
| GreenPower Motor Company Inc. Management's Discussion and Analysis For the year ended March 31, 2025 Discussion dated: July 30, 2025 |
A summary of selected information for each of the last eight quarters is presented below:
| Three Months Ended | ||||||||||||
| March 31, | December 31, | September 30, | June 30, | |||||||||
| 2025 | 2024 | 2024 | 2024 | |||||||||
| Financial results | ||||||||||||
| Revenues | $ | 4,284,134 | $ | 7,218,897 | $ | 5,347,190 | $ | 2,997,058 | ||||
| Loss for the period | (3,833,914 | ) | (4,739,022 | ) | (4,701,864 | ) | (5,388,648 | ) | ||||
| Basic and diluted earnings/(loss) per share | $ | (0.13 | ) | $ | (0.17 | ) | $ | (0.18 | ) | $ | (0.21 | ) |
| Balance sheet data | ||||||||||||
| Working capital (Note 1) | 8,106,809 | 12,835,583 | 10,090,572 | 13,919,050 | ||||||||
| Total assets | 35,071,725 | 37,367,033 | 39,374,461 | 43,464,519 | ||||||||
| Shareholders' equity / deficiency | (1,605,966 | ) | 2,138,161 | 4,153,826 | 8,600,047 | |||||||
| Three Months Ended | ||||||||||||
| March 31, | December 31, | September 30, | June 30, | |||||||||
| 2024 | 2023 | 2023 | 2023 | |||||||||
| Financial results | ||||||||||||
| Revenues | $ | 5,092,890 | $ | 8,157,931 | $ | 8,440,010 | $ | 17,581,008 | ||||
| Loss for the period | (6,631,577 | ) | (4,641,720 | ) | (4,257,643 | ) | (2,811,856 | ) | ||||
| Basic and diluted earnings/(loss) per share | $ | (0.27 | ) | $ | (0.19 | ) | $ | (0.17 | ) | $ | (0.11 | ) |
| Balance sheet data | ||||||||||||
| Working capital (Note 1) | 15,561,765 | 19,428,489 | 24,212,127 | 26,452,106 | ||||||||
| Total assets | 45,203,284 | 50,164,330 | 55,382,608 | 54,059,697 | ||||||||
| Shareholders' equity | 11,566,819 | 18,052,671 | 22,349,985 | 26,204,408 | ||||||||
1) - Working capital defined as Total Current Assets minus Total Current Liabilities
Changes in Quarterly Results
GreenPower's quarterly revenues for the current fiscal year reached a peak in the third quarter ended December 31, 2024, and was largely the result of 28 vehicle deliveries, the highest of the year, including 14 BEAST and Nano BEAST school bus deliveries, as these vehicles generate a higher revenue per vehicle than other models. Revenue ranged between $3 million and $5.4 million in the other three quarters, and variances were due to differences in vehicle deliveries and product mix of sales. There was a reduction in quarterly losses from a loss of $5.4 million in the first quarter to a loss of $3.8 million in the fourth quarter. The reduction in quarterly losses in the fourth quarter was primarily the result of a reduction in selling, general and administrative expenses over the period and the inclusion of other income of $1,391,746 related to the de-recognition of a contingent liability. Management has implemented a number of initiatives to reduce costs across the organization, and this is expected to continue over the next year.
GreenPower's quarterly revenues for the year ended March 31, 2024 reached a peak in the first quarter ended June 30, 2023, and were largely driven by 131 vehicle deliveries including 95 EV Star CC's delivered to Workhorse. Revenues declined in each of the subsequent three quarters, with quarterly vehicle deliveries ranging between 26 and 34 per quarter, including 10 EV Star CC's to Workhorse in the fourth quarter ended March 31, 2024. Losses for each of the four quarters ranged between $2.8 million in the first quarter and $6.4 million in the fourth quarter and were largely driven by differences in revenue in each of the four quarters and was further negatively impacted by inventory and asset writedowns in the third and fourth quarters.
| GreenPower Motor Company Inc. Management's Discussion and Analysis For the year ended March 31, 2025 Discussion dated: July 30, 2025 |
The following tables summarize Vehicle Deliveries pursuant to vehicle leases and vehicle sales for the last eight quarters:
| For the three months ended | ||||||||||||
| March 31, | December 31, | September 30, | June 30, | |||||||||
| 2025 | 2024 | 2024 | 2024 | |||||||||
| Vehicle Sales | ||||||||||||
| EV Star (Note 1, 2) | 14 | 14 | 11 | 9 | ||||||||
| EV Star CC's Sold to Workhorse | 0 | 0 | 0 | 0 | ||||||||
| Nano BEAST and BEAST school bus | 8 | 14 | 11 | 3 | ||||||||
| EV 250 | 0 | 0 | 0 | 0 | ||||||||
| Vehicle Deliveries (Note 3) | 22 | 28 | 22 | 12 | ||||||||
| For the three months ended | ||||||||||||
| March 31, | December 31, | September 30, | June 30, | |||||||||
| 2024 | 2023 | 2023 | 2023 | |||||||||
| Vehicle Sales | ||||||||||||
| EV Star (Note 1) | 12 | 19 | 15 | 28 | ||||||||
| EV Star CC's Sold to Workhorse | 10 | 0 | 0 | 95 | ||||||||
| Nano BEAST and BEAST school bus | 4 | 13 | 16 | 8 | ||||||||
| EV 250 | 0 | 2 | 0 | 0 | ||||||||
| Vehicle Deliveries (Note 3) | 26 | 34 | 31 | 131 | ||||||||
1) Includes various models of EV Stars
2) EV Stars delivered in the quarter ended December 31, 2023 include 2 EV Stars accounted for as finance leases, and 3 EV Stars accounted for as operating leases.
3) "Vehicle Deliveries", as reflected above, is a supplementary performance metric, that management believes provides useful information regarding the business activity of the Company during a quarter or year. Vehicle Deliveries is vehicles that have been sold or leased to a customer during a quarter or a year, as determined by management. The models of vehicles included in Vehicle Deliveries will vary over time, such that Vehicle Deliveries in one period may not be comparable to Vehicle Deliveries in another period. Vehicle Deliveries is not a financial metric, and vehicle deliveries is not an indication of the Company's financial performance in a given period. While management considers Vehicle Deliveries to be a useful supplementary performance metric, users are cautioned to consider other factors to evaluate GreenPower's business.
| GreenPower Motor Company Inc. Management's Discussion and Analysis For the year ended March 31, 2025 Discussion dated: July 30, 2025 |
The following tables summarize Total Cash Expenses for the last eight quarters:
| For the three months ended | ||||||||||||
| March 31, | December 31, | September 30, | June 30, | |||||||||
| 2025 | 2024 | 2024 | 2024 | |||||||||
| Total sales, general and administrative costs | $ | 5,169,826 | $ | 5,234,644 | $ | 4,584,730 | $ | 5,126,932 | ||||
| Plus: | ||||||||||||
| Interest and accretion | 518,752 | 562,360 | 572,472 | 522,753 | ||||||||
| Foreign exchange loss/(gain) | (1,836 | ) | (3,945 | ) | 4,297 | (39,173 | ) | |||||
| Less: | ||||||||||||
| Depreciation | (376,937 | ) | (399,440 | ) | (427,978 | ) | (457,758 | ) | ||||
| Share-based payments | (63,893 | ) | (135,677 | ) | (289,893 | ) | (408,005 | ) | ||||
| (Increase)/decrease in warranty liability | (28,507 | ) | (172,996 | ) | (84,307 | ) | 220,271 | |||||
| (Allowance) / recovery for credit losses | 134,295 | (240,396 | ) | 126,348 | (7,970 | ) | ||||||
| Total Cash Expenses (Note 1) | $ | 5,351,700 | $ | 4,844,550 | $ | 4,485,669 | $ | 4,957,050 | ||||
| For the three months ended | ||||||||||||
| March 31, | December 31, | September 30, | June 30, | |||||||||
| 2024 | 2023 | 2023 | 2023 | |||||||||
| Total sales, general and administrative costs | $ | 6,371,346 | $ | 5,677,814 | $ | 5,215,894 | $ | 5,318,190 | ||||
| Plus: | ||||||||||||
| Interest and accretion | 668,282 | 342,590 | 266,035 | 277,951 | ||||||||
| Foreign exchange loss/(gain) | (119,272 | ) | (23,718 | ) | 5,083 | 6,491 | ||||||
| Less: | ||||||||||||
| Depreciation | (504,225 | ) | (466,763 | ) | (444,703 | ) | (442,767 | ) | ||||
| Share-based payments | (124,227 | ) | (259,188 | ) | (405,470 | ) | (713,227 | ) | ||||
| (Increase)/decrease in warranty liability | (93,361 | ) | 216,538 | 10,705 | (556,023 | ) | ||||||
| (Allowance) / recovery for credit losses | (1,136,852 | ) | (121,097 | ) | (193,004 | ) | (9 | ) | ||||
| Impairment of assets | - | (423,267 | ) | - | - | |||||||
| Total Cash Expenses (Note 1) | $ | 5,061,691 | $ | 4,942,909 | $ | 4,454,540 | $ | 3,890,606 | ||||
1) Total Cash Expenses", as reflected above, is a non-IFRS measure which is defined as sales, general and administrative costs plus interest and accretion, plus/(less) foreign exchange loss/(gain), less depreciation, less share-based payments, plus/(less) the decrease/(increase) in warranty liability, plus / (less) the (allowance) / recovery for credit losses, less impairment of assets. Total Cash Expenses is a measure used by management as an indicator of sales, general and administrative, interest and accretion, and foreign exchange costs that excludes the impact of certain non-cash charges. Management believes that Total Cash Expenses provides a measure of cash expenses from the operations of the business. However, Total Cash Expenses is not a measure of financial performance under IFRS and should not be considered a substitute for other financial measures of performance. Total Cash Expenses as calculated by GreenPower may not be comparable to Total Cash Expenses as calculated and reported by other companies.
| GreenPower Motor Company Inc. Management's Discussion and Analysis For the year ended March 31, 2025 Discussion dated: July 30, 2025 |
The following tables summarize Adjusted EBITDA for the last eight quarters:
| For the three months ended | ||||||||||||
| March 31, | December 31, | September 30, | June 30, | |||||||||
| 2025 | 2024 | 2024 | 2024 | |||||||||
| Loss for the period | $ | (3,833,914 | ) | $ | (4,739,022 | ) | $ | (4,701,864 | ) | $ | (5,388,648 | ) |
| Plus: | ||||||||||||
| Depreciation | 376,937 | 399,440 | 427,978 | 457,758 | ||||||||
| Interest and accretion | 518,752 | 562,360 | 572,472 | 522,753 | ||||||||
| Share-based payments | 63,893 | 135,677 | 289,893 | 408,005 | ||||||||
| Allowance / (recovery) for credit losses | (134,295 | ) | 240,396 | (126,348 | ) | 7,970 | ||||||
| Increase/(decrease) in warranty liability | 28,507 | 172,996 | 84,307 | (220,271 | ) | |||||||
| Impairment of assets | - | - | - | - | ||||||||
| Adjusted EBITDA (Note 1) | $ | (2,980,120 | ) | $ | (3,228,153 | ) | $ | (3,453,562 | ) | $ | (4,212,433 | ) |
| For the three months ended | ||||||||||||
| March 31, | December 31, | September 30, | June 30, | |||||||||
| 2024 | 2023 | 2023 | 2023 | |||||||||
| Loss for the period | $ | (6,631,577 | ) | $ | (4,641,720 | ) | $ | (4,257,643 | ) | $ | (2,811,856 | ) |
| Plus: | ||||||||||||
| Depreciation | 504,225 | 466,763 | 444,703 | 442,767 | ||||||||
| Interest and accretion | 668,282 | 342,590 | 266,035 | 277,951 | ||||||||
| Share-based payments | 124,227 | 259,188 | 405,470 | 713,227 | ||||||||
| Allowance / (recovery) for credit losses | 1,136,852 | 121,097 | 193,004 | 9 | ||||||||
| Increase/(decrease) in warranty liability | 93,361 | (216,538 | ) | 10,705 | 556,023 | |||||||
| Impairment of assets | - | 423,267 | - | - | ||||||||
| Adjusted EBITDA (Note 1) | $ | (4,104,630 | ) | $ | (3,245,353 | ) | $ | (2,937,726 | ) | $ | (821,879 | ) |
1) "Adjusted EBITDA", as reflected above, is a non-IFRS measure, which is defined as loss for the period (for quarterly periods), or loss for the year (for annual periods) plus depreciation, plus interest and accretion, plus share-based payments, plus / (less) the increase / (decrease) in the warranty liability, plus taxes, plus impairment of assets. Adjusted EBITDA is a measure used by management as an indicator of profitability since it excludes the impact of movements in working capital items, certain non-cash charges, and financing costs. Therefore, Adjusted EBITDA gives the investor information as to the cash generated from the operations of a business. However, Adjusted EBITDA is not a measure of financial performance under IFRS and should not be considered a substitute for other financial measures of performance. Adjusted EBITDA as calculated by GreenPower may not be comparable to Adjusted EBITDA as calculated and reported by other companies. The most comparable IFRS measure to Adjusted EBITDA is net income.
| GreenPower Motor Company Inc. Management's Discussion and Analysis For the year ended March 31, 2025 Discussion dated: July 30, 2025 |
Liquidity and Capital Resources
As at March 31, 2025, the Company had a cash balance of $344,244 and working capital, defined as current assets minus current liabilities, of $8,106,809. The Company's line of credit has a maximum credit limit of up to $6,000,000 and amounts available in excess of $5,000,000 are subject to margining requirements. As at March 31, 2025, the line of credit had a drawn balance of $5,983,572. In addition, the Company had a revolving term loan facility of up to $5 million, which can be used to fund payments to suppliers to build inventory pursuant to customer orders.
Subsequent to the year ended March 31, 2025,
• the Company received loans totaling $1.75 million in aggregate, and as an inducement to enter into the loans issued to lenders 1,086,956 warrants exercisable at $0.46 per share, 909,090 warrants exercisable at $0.44 per share, 304,878 warrants exercisable at $0.41 per share, and 263,157 warrants exercisable at $0.38 per share, each with a term of 24 months, and 295,422 common shares of the Company;
• sold a total of 216,007 common shares under the 2025 ATM for gross proceeds of $97,964.
The Company manages its capital structure and makes adjustments to it based on available funds. The Company may continue to rely on additional financings and the sale of its inventory to further its operations and meet its capital requirements to manufacture EV vehicles, expand its production capacity, and further develop its sales, marketing, engineering, and technical resources.
The Company's ability to achieve its business objectives is subject to material uncertainty which casts substantial doubt upon its ability to continue as a going concern. The Company will continue to rely on additional financings to support its operations and fulfill its capital requirements.
Capital Resources
Authorized
Unlimited number of common shares without par value Unlimited number of preferred shares without par value
Issued
During October 2024 the Company issued 3,000,000 common shares in an underwritten offering of common shares (the "Share Offering") for gross proceeds of $3,000,000. The Company also issued 150,000 warrants (the "Underwriter Warrants") to the underwriter of the Share Offering to purchase up to 150,000 common shares of the company. The Underwriter Warrants have an exercise price of $1.25 per share and expire three years from the date of issuance. The Company assessed and concluded that the warrants should be recorded as equity investments. The Company incurred $483,434 in professional fees and other direct expenses in connection with the offering, which were included in the share issuance costs for the year ended March 31, 2025. The Company determined that the fair value of the warrants issued was $79,955, and after allocating $12,884 in professional fees, the net amount was booked to reserves, with the remainder booked to share capital in the Company's statement of financial position.
During May 2024 the Company issued 1,500,000 units in an underwritten Unit offering (the "Unit Offering") comprised of 1,500,000 common shares and warrants to purchase 1,575,000 common shares for gross proceeds of $2,325,750 before deducting underwriting discounts and offering expenses. The warrants have an exercise price of $1.82 per share and expire three years from the date of issuance, and the Company assessed and concluded that the Warrants should be recorded as equity investments. None of the warrants have been cancelled, forfeited or exercised as of March 31, 2025. The Company incurred $400,774 in professional fees and other direct expenses in connection with the Unit Offering, which was included in share issuance costs for the year ended March 31, 2025.
| GreenPower Motor Company Inc. Management's Discussion and Analysis For the year ended March 31, 2025 Discussion dated: July 30, 2025 |
The Company determined that the fair value of warrants issued in the Unit Offering was $278,250, and this amount, net of allocated professional fees of $48,040 was booked to reserves, with the remainder booked to share capital.
During the year ended March 31, 2024, the Company issued a total of 274,534 common shares, including 188,819 shares issued under the At the Market Offering (ATM), and 85,715 shares from the exercise of options.
During the year ended March 31, 2023 the Company issued a total of 1,568,590 common shares, including 1,565,268 shares issued under the At the Market Offering (ATM) and 3,322 shares from the exercise of options.
Subsequent to the year ended March 31, 2025, the Company sold a total of 216,007 common shares under the 2025 ATM for gross proceeds of $97,964.
At the Market Offering
On March 7, 2025 the Company filed a prospectus supplement to its short form base shelf prospectus, pursuant to which the Company may, at its discretion and from time to time, sell common shares of the Company on the NASDAQ stock exchange for aggregate gross proceeds of up to US$850,000 (the "2025 ATM"). The Company did not sell any shares under the 2025 ATM during the year ended March 31, 2025. Subsequent to the year ended March 31, 2025, the Company sold a total of 216,007 common shares under the 2025 ATM for gross proceeds of $97,964.
In September 2022, the Company filed a prospectus supplement to its short form base shelf prospectus, pursuant to which the Company may, at its discretion and from time to time, sell common shares of the Company on the NASDAQ stock exchange for aggregate gross proceeds of up to US$20,000,000 (the "2022 ATM"). The 2022 ATM expired in November 2023 due to the expiry of the then effective short form base shelf prospectus.
During the year ended March 31, 2024, the Company sold 188,819 common shares under the 2022 ATM for gross proceeds of $520,892 before transaction fees. The Company incurred approximately $14,904 in professional fees and other direct expenses in connection with the 2022 ATM, which was included in share issuance costs for the year ended March 31, 2024 (2023 - $216,803).
2023 Plan
Effective February 21, 2023 GreenPower adopted the 2023 Plan which was approved by shareholders at our AGM on March 28, 2023 in order to grant stock options or non-stock option awards to people in the United States. Under the 2023 Plan GreenPower can issue stock options that are considered incentive stock options, which are stock options that qualify for certain favorable tax treatment under U.S. tax laws. Nonqualified stock options are stock options that are not incentive stock options. The aggregate fair market value on the date of grant of Shares with respect to which incentive stock options are exercisable for the first time by an optionee subject to tax in the United States during any calendar year must not exceed US$100,000, or such other limit as may be prescribed by the Internal Revenue Code. Non-stock option awards mean a right granted to an award recipient under the 2023 Plan, which may include the grant of stock appreciation rights, restricted awards or other equity-based awards. The aggregative number of Shares issuable under the 2023 will not exceed 2,467,595 (and all of the Company's other Security-Based Compensation Arrangements. The Company received final approval of the 2023 plan on April 18, 2024.
| GreenPower Motor Company Inc. Management's Discussion and Analysis For the year ended March 31, 2025 Discussion dated: July 30, 2025 |
2022 Plan
Effective April 19, 2022 GreenPower adopted the 2022 Equity Incentive Plan (the "2022 Plan"), which was further ratified and re-approved by shareholders at our AGM on May 23, 2025, and which replaced the 2019 Plan. Under the 2022 Plan the Company can grant equity-based incentive awards in the form of stock options ("Options"), restricted share units ("RSUs"), performance share units ("PSUs") and deferred share units ("DSUs"). RSU's, DSU's and PSU's are collectively referred to as "Performance Based Awards". The 2022 Plan is a Rolling Plan for Options and a fixed-plan for Performance-Based Awards such that the aggregate number of Shares that: (i) may be issued upon the exercise or settlement of Options granted under the 2022 Plan (and all of the Company's other Security-Based Compensation Arrangements), shall not exceed 10% of the Company's issued and outstanding Shares from time to time, and (ii) may be issued in respect of Performance-Based Awards granted under the 2022 Plan (and all of the Company's other Security-Based Compensation Arrangements) shall not exceed 2,949,116. No performance-based awards have been issued as at March 31, 2025 or as at March 31, 2024. The 2022 Plan is considered an "evergreen" plan, since Options which have been exercised, cancelled, terminated, surrendered, forfeited or expired without being exercised shall be available for subsequent grants under the 2022 Plan and the number of awards available to grant increases as the number of issued and outstanding Shares increases.
Stock Option Plans from Prior Periods
On May 14, 2019, the Company replaced the 2016 Plan with a Rolling Stock Option Plan (the "2019 Plan"). Under the terms of the 2019 Plan, the aggregate number of Options that can be granted under the 2019 Plan cannot exceed ten (10%) of the total number of issued and outstanding Shares, calculated on a non-diluted basis. The exercise price of options granted under the 2019 Plan may not be less than the minimum prevailing price permitted by the TSXV policies with a maximum term of 10 years. On March 9, 2016, the shareholders approved the previous stock option plan which initially allowed for the issuance of up to 1,491,541 shares and which was subsequently further increased to allow up to 2,129,999 shares to be issued under the plan (the "2016 Plan").
The Company had the following incentive stock options granted under the 2023 Plan, 2022 Plan, and the 2019 Plan, that are issued and outstanding as at March 31, 2025:
| Exercise | Balance | Forfeited | Balance | |||||||||||||||||||
| Expiry Date | Price | March 31, 2024 | Granted | Exercised | or Expired | March 31, 2025 | ||||||||||||||||
| January 30, 2025 | CDN | $ | 2.59 | 238,212 | - | - | (238,212 | ) | - | |||||||||||||
| February 11, 2025 | CDN | $ | 8.32 | 50,000 | - | - | (50,000 | ) | - | |||||||||||||
| July 3, 2025 | CDN | $ | 4.90 | 14,999 | - | - | (8,571 | ) | 6,428 | |||||||||||||
| November 19, 2025 | US | $ | 20.00 | 300,000 | - | - | - | 300,000 | ||||||||||||||
| December 4, 2025 | US | $ | 20.00 | 20,000 | - | - | (5,000 | ) | 15,000 | |||||||||||||
| May 18, 2026 | CDN | $ | 19.62 | 63,700 | - | - | (31,250 | ) | 32,450 | |||||||||||||
| December 10, 2026 | CDN | $ | 16.45 | 523,250 | - | - | (103,250 | ) | 420,000 | |||||||||||||
| July 4, 2027 | CDN | $ | 4.25 | 15,000 | - | - | (15,000 | ) | - | |||||||||||||
| November 2, 2027 | US | $ | 2.46 | 10,000 | - | - | (10,000 | ) | - | |||||||||||||
| February 14, 2028 | CDN | $ | 3.80 | 632,500 | - | - | (130,000 | ) | 502,500 | |||||||||||||
| March 27, 2029 | CDN | $ | 2.72 | 605,000 | - | - | (113,750 | ) | 491,250 | |||||||||||||
| June 28, 2029 | CDN | $ | 1.40 | - | 20,000 | - | - | 20,000 | ||||||||||||||
| March 14, 2030 | CDN | $ | 0.78 | - | 800,000 | - | (5,000 | ) | 795,000 | |||||||||||||
| Total outstanding | 2,472,661 | 820,000 | - | (710,033 | ) | 2,582,628 | ||||||||||||||||
| Total exercisable | 1,711,798 | 1,681,378 | ||||||||||||||||||||
| Weighted Average | ||||||||||||||||||||||
| Exercise Price (CDN$) | $ | 9.62 | $ | 0.80 | $ | - | $ | 6.25 | $ | 7.95 | ||||||||||||
| Weighted Average Remaining Life | 3.2 years | 3.2 years | ||||||||||||||||||||
As at March 31, 2025, there were 366,488 stock options available for issuance under the 2023 and 2022 plan and 2,949,116 performance-based awards available for issuance under the 2023 Plan and the 2022 Plan.
| GreenPower Motor Company Inc. Management's Discussion and Analysis For the year ended March 31, 2025 Discussion dated: July 30, 2025 |
On March 14, 2025, the Company granted 800,000 options with a term of five years and an exercise price of CDN $0.78 per share, comprised of:
During the year ended March 31, 2025, nil common shares were issued pursuant to the exercise of stock options and 710,033 options were forfeited or expired.
During the year ended March 31, 2025, the Company incurred share-based compensation expense with a measured fair value of $897,468. The fair value of the options granted and vested were recorded as share-based payments on the Consolidated Statements of Operations.
As at March 31, 2025 the company had the following warrants outstanding:
| Exercise | Balance | Forfeited | Balance | ||||||||||||||||
| Issue date | Expiry date | price (US$) | 31-Mar-24 | Granted | Exercised | or expired | 31-Mar-25 | ||||||||||||
| May 9, 2024 | May 9, 2027 | 1.82 | - | 1,575,000 | - | - | 1,575,000 | ||||||||||||
| Oct 30, 2024 | Oct 30, 2027 | 1.25 | - | 150,000 | - | - | 150,000 | ||||||||||||
| Total | - | 1,725,000 | - | - | 1,725,000 |
As at March 31, 2024 the Company had an outstanding warrant balance of nil.
Subsequent to the end of the reporting period:
| GreenPower Motor Company Inc. Management's Discussion and Analysis For the year ended March 31, 2025 Discussion dated: July 30, 2025 |
Investing Activities
For the year ended March 31, 2025
See the Operations and Capital Resources sections above for a summary of the Company activities during the year ended March 31, 2025.
Off-Balance Sheet Arrangements
As of the date of this filing, the Company does not have any off-balance sheet arrangements that have, or are reasonably likely to have, a current or future effect on the results of operations or financial condition of the Company including, without limitation, such considerations as liquidity and capital resources that have not previously been discussed.
Related Party Transactions
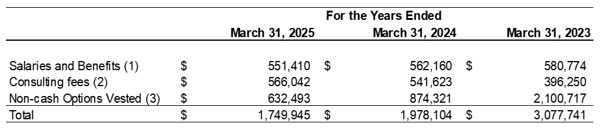
A summary of compensation for directors, officers and key management personnel is as follows:
1) Salaries and benefits incurred with directors and officers are included in Salaries and administration on the Consolidated Statements of Operations and Comprehensive Loss.
2) Consulting fees included in Salaries and administration on the Consolidated Statements of Operations and Comprehensive Loss are paid to the Chairman and CEO for management consulting services, and includes Director's Fees paid to GreenPower's four independent directors.
3) Amounts recognized for related party stock-based compensation are included in Share-based payments on the Consolidated Statements of Operations.
Accounts payable and accrued liabilities at March 31, 2025 includes $454,894 (March 31, 2024 - $105,676) owed to officers, directors, and companies controlled by officers and directors, and shareholders, which is non-interest bearing, unsecured and has no fixed terms of repayment.
During the year ended March 31, 2025, the Company received loans totaling CAD $475,000 from FWP Holdings LLC ("FWP Holdings"), USD$250,000 from Koko Financial Services Inc. ("Koko"), and CAD$675,000 from 0851433 BC Ltd. FWP Holdings, Koko, and 08551433 BC Ltd. are all beneficially owned by the CEO and Chairman of the Company. The loans bear interest at 12.0% per annum plus such additional bonus interest, if any, as may be agreed to and approved by GreenPower's Board of Directors at a later date. Loans from FWP Holdings with a principal balance of CAD $3,670,000 matured on March 31, 2023
however the principal balance remains outstanding as at March 31, 2025. The Company has agreed to grant FWP Holdings a general security assignment on the assets of GreenPower Motor Company Inc., which will be subordinated to any security assignment of senior lenders. The Company and FWP Holdings entered into a postponement and subordination agreement with the term loan facility lender under which the parties agreed that the loans from FWP Holdings would be subordinate to the lender's security interests and that no payment will be made on the loans from FWP Holdings before the full repayment of the term loan facility.
| GreenPower Motor Company Inc. Management's Discussion and Analysis For the year ended March 31, 2025 Discussion dated: July 30, 2025 |
As a result, loans from related parties that are covered under the postponement and subordination agreement are considered non-current liabilities. This determination required the Company to revalue these loans as at the date of the subordination agreement, which resulted in a non-cash gain of $306,288 that was included in Other Income during the year ended March 31, 2024 (2025 - nil, 2023 - nil).
During the quarter ended March 31, 2025 the Company received advances of $150,000 from Koko and CAD$50,000 from FWP Acquisition Corp. that were unsecured and non-interest bearing and were repaid subsequent to the year-end. In addition, the Company received a further advance of $100,000 from Brendan Riley, President of the Company, that is unsecured and non-interest bearing. These amounts are included in loans payable to related parties on the Company's Consolidated Statements of Financial Position.
During the year ended March 31, 2024 no additional related party loans were received by the Company. The CAD $250,000 loan plus accrued interest from Countryman Investments Ltd., a Company wholly owned by David Richardson, a director of the Company, was repaid, and the US$25,000 loan from FWP Holdings LLC was repaid.
A director of the Company, David Richardson, and the Company's CEO and Chairman Fraser Atkinson, have each provided personal guarantees of $2,510,000, or $5,020,000 in total to support the Company's operating line of credit.
Subsequent to the year ended March 31, 2025, on May 13, 2025, the Company announced a term loan offering of up to $2,000,000 from several related party lenders. The loan will be advanced in tranches, have a term of 2 years, will bear interest at 12% per annum and as an inducement for entering into the loan the lenders will receive either loan bonus warrants or loan bonus shares. As of the date of this report the Company has entered into three tranches of the loan, as follows:
| GreenPower Motor Company Inc. Management's Discussion and Analysis For the year ended March 31, 2025 Discussion dated: July 30, 2025 |
New and Amended Standards
Adoption of accounting standards
Certain new accounting standards have been published by the IASB or the IFRS Interpretations Committee that are effective for annual reporting periods beginning on or after January 1, 2025. These changes were reviewed by management and did not cause a change to the Company's financial statements.
Future accounting pronouncements
Certain new accounting standards and interpretations have been published by the IASB that are not mandatory for the March 31, 2025 reporting period, as summarized in the following table:
| Mandatorily effective for periods beginning on or after January 1, 2025 | Mandatorily effective for periods beginning on or after January 1, 2026 |
| IAS 21 - The effect of changes in Foreign Exchange Rates | IFRS 7 and IFRS 9 - Amendments to the Classification and measurement of Financial Instruments (effective Jan 1, 2026) |
| IFRS 1, IFRS 7, IFRS 9, IFRS 10, IAS 7 - Annual improvements to IFRS accounting standards (effective Jan 1, 2026) | |
| IFRS 7 and IFRS 9 - Contracts referencing nature-dependent electricity (effective Jan 1, 2026) | |
| IFRS 19 - Subsidiaries without Public Disclosures (effective Jan 1, 2027) | |
| IFRS 18 - Presentation and Disclosure in Financial Statements (effective Jan 1, 2027) |
The Company has reviewed new and revised accounting pronouncements that have been issued but are not yet effective. The Company has not early adopted any of these standards and is currently evaluating the impact, if any, that these standards might have on its consolidated financial statements.
| GreenPower Motor Company Inc. Management's Discussion and Analysis For the year ended March 31, 2025 Discussion dated: July 30, 2025 |
Internal Controls over Financial Reporting
Evaluation of Disclosure Controls and Procedures
Management, with the participation of our Chief Executive Officer and Chief Financial Officer, are responsible for establishing and maintaining disclosure controls and procedures (DC&P) (as such term is defined in Exchange Act Rules 13a-15(f) and 15d-15(f) under the U.S. Securities and Exchange Act of 1934 and under National Instrument 52-109). Management evaluated the effectiveness of our disclosure controls and procedures as of March 31, 2025.
Based on the evaluation performed as of March 31, 2025, as a result of the material weaknesses in internal control over financial reporting that are described below in Management's Report on Internal Control Over Financial Reporting, our Chief Executive Officer and Chief Financial Officer determined that our disclosure controls and procedures were not effective as of such date.
Management's Report on Internal Control Over Financial Reporting
Management is responsible for establishing and maintaining adequate internal control over financial reporting, as such term is defined in Exchange Act Rules 13a-15(f) and 15d-15(f) under the U.S. Securities and Exchange Act of 1934 and under National Instrument 52-109.
A company's internal control over financial reporting is a process designed by, or under the supervision of, its Chief Executive Officer and Chief Financial Officer, and effected by such company's board of directors, management and other personnel to provide reasonable assurance regarding the reliability of financial reporting and the preparation of financial statements for external purposes in accordance with generally accepted accounting principles and includes those policies and procedures that:
Because of its inherent limitations, internal control over financial reporting may not prevent or detect misstatements. Also, projections of any evaluation of effectiveness to future periods are subject to the risk that controls may become inadequate because of changes in conditions, or that the degree of compliance with the policies or procedures may deteriorate. A material weakness is a deficiency, or a combination of deficiencies, in internal control over financial reporting, such that there is a reasonable possibility that a material misstatement of a company's annual or interim consolidated financial statements will not be prevented or detected on a timely basis.
Management, with the participation of our Chief Executive Officer and Chief Financial Officer, has conducted an evaluation of the effectiveness of our internal control over financial reporting as of March 31, 2025, based on the framework set forth in Internal Control-Integrated Framework (2013) issued by the Committee of Sponsoring Organizations of the Treadway Commission (COSO). Based on this assessment, management has concluded that the Company did not maintain effective internal control over financial reporting as of March 31, 2025 due to the following material weaknesses in its internal control over financial reporting:
| GreenPower Motor Company Inc. Management's Discussion and Analysis For the year ended March 31, 2025 Discussion dated: July 30, 2025 |
• We did not design and maintain effective controls to account for transactions related to inventory including providing documented evidence of costing, existence and verification of inventories;
• We did not design and maintain effective controls relating to revenue recognition, including consistent and complete maintenance of supporting documentation for revenue transactions;
• We did not design and maintain effective controls to ensure complex and/or unusual transactions are appropriately accounted for and disclosed; and
• We did not design and maintain effective controls to prevent and/or detect errors in the accounting for and/or the disclosure of transactions.
Accordingly, management has concluded that the foregoing control deficiencies constitute material weaknesses.
Remediation Efforts
Management is focused on developing, designing and implementing effective internal controls measures to improve our internal control over financial reporting and remediate the material weaknesses we identified. Our internal control remediation efforts include the following:
Management intends to focus on the internal control remediation efforts identified above in order to address and resolve the material weaknesses in internal controls over financial reporting that existed as at March 31, 2025.
Attestation Report of the Registered Public Accounting Firm
This MD&A does not include an attestation report of the Company's registered public accounting firm regarding internal control over financial reporting. Management's report is not subject to attestation by the Company's registered public accounting firm pursuant to rules of the SEC that permit the Company to provide only management's report in this Annual Report.
Changes In Internal Control Over Financial Reporting
During our fourth quarter and year ended March 31, 2025, other than changes to certain controls related to there were no changes in our internal control over financial reporting (as defined in Rules 13a-15(f) and 15d-15(f) of the Exchange Act and NI 52-109) that have materially affected, or are reasonably likely to materially affect, our internal control over financial reporting.
Limitation on Effectiveness Controls and Procedures
The effectiveness of any system of internal control over financial reporting, including ours, is subject to inherent limitations, including the exercise of judgment in designing, implementing, operating, and evaluating the controls and procedures, and the inability to eliminate misconduct completely. Accordingly, any system of internal control over financial reporting, including ours, no matter how well designed and operated, can only provide reasonable, not absolute assurances. In addition, projections of any evaluation of effectiveness to future periods are subject to the risk that controls may become inadequate because of changes in conditions, or that the degree of compliance with the policies or procedures may deteriorate. We intend to continue to monitor and upgrade our internal controls as necessary or appropriate for our business, but there can be no assurance that such improvements will be sufficient to provide us with effective internal control over financial reporting.
| GreenPower Motor Company Inc. Management's Discussion and Analysis For the year ended March 31, 2025 Discussion dated: July 30, 2025 |
Critical Accounting Estimates and Judgements
The preparation of these consolidated financial statements requires management to make certain estimates, judgments and assumptions that affect the reported amounts of assets and liabilities at the date of the financial statements and reported amounts of expenses during the reporting period. Actual outcomes could differ from these estimates. These consolidated financial statements include estimates which, by their nature, are uncertain. The impacts of such estimates are pervasive throughout the consolidated financial statements and may require accounting adjustments based on future occurrences. Revisions to critical accounting estimates are recognized in the period in which the estimate is revised and future periods if the revision affects both current and future periods. These estimates are based on historical experience, current and future economic conditions, and other factors, including expectations of future events that are believed to be reasonable under the circumstance.
Critical accounting judgements
i. The determination of the functional currency of the Company and of each entity within the consolidated Company.
ii. The Company's ability to achieve its business objectives is subject to material uncertainty which casts substantial doubt upon the Company's ability to continue as a going concern.
iii. The determination to de-recognize the loan amounts representing the term loan that would be assumed from the acquisition of Lion Truck Body, which was subject to the seller obtaining the required consents for the assumption. The consents for the assumption were not received, and Lion Truck Body was dissolved during the year, so the contingent liability was written off as at March 31, 2025.
iv. The determination that a portion of loans payable to related parties outstanding as at March 31, 2025 is a non-current liability.
Critical accounting estimates and assumptions
i. The determination of the discount rates used to discount finance lease receivables and lease liabilities.
ii. The estimated accrual rate for the warranty provision on the sale of all-electric vehicles.
iii. The classification of leases as either financial leases or operating leases.
iv. The determination that the Company should record of $310,000 for potential judgements for legal matters.
v. The determination of an allowance for doubtful accounts on the Company's trade receivables.
vi. The estimate of the useful life of equipment.
vii. The estimate of the net realizable value of inventory.
viii. Estimates underlying the recognition of proceeds from government vouchers and grants.
ix. Estimates underlying the determination of the carrying value of the West Virginia lease liability and right of use asset.
x. Estimates underlying the calculation of deferred income tax assets and deferred income tax recovery.
xi. The determination of overheads to be allocated to inventory and charged to cost of sales.
| GreenPower Motor Company Inc. Management's Discussion and Analysis For the year ended March 31, 2025 Discussion dated: July 30, 2025 |
Financial Instruments
The Company's financial instruments consist of cash, accounts receivable, promissory note receivable, finance lease receivables, line of credit, loans payable to related parties, term loan, accounts payable and accrued liabilities, other liabilities, and lease liabilities.
Financial instruments measured at fair value are classified into one of three levels in the fair value hierarchy according to the relative reliability of the inputs used to estimate the fair values. The three levels of the fair value hierarchy are:
Level 1: Unadjusted quoted prices in active markets for identical assets and liabilities;
Level 2: Inputs other than quoted prices that are observable for the asset or liabilities either directly or indirectly; and
Level 3: Inputs that are not based on observable market data
The fair value of the Company's financial instruments approximates their carrying value, unless otherwise noted.
The Company has exposure to the following financial instrument related risks.
Credit risk
The Company's exposure to credit risk is on its cash, accounts receivable, promissory note receivable, and on its finance lease receivables. The maximum exposure to credit risk is their carrying amounts in the consolidated statement of Financial Position.
Cash consists of cash bank balances held in major financial institutions in Canada and the United States with a high credit quality and therefore the Company is exposed to minimal risk. The Company assesses the credit risk of its account receivable, finance lease receivables and promissory note receivable at each reporting period end and on an annual basis. During the year ended March 31, 2025 the Company recognized an allowance / (recovery) for doubtful accounts, net of payments collected, of ($12,277) (2024 - $1,319,873 as summarized in the table below:
| March 31, 2025 | March 31, 2024 | |||||
| Allowance for doubtful accounts, beginning of year | $ | 1,459,243 | $ | 139,370 | ||
| plus: new allowance recognized | 261,686 | 1,459,243 | ||||
| less: AFDA written off as uncollectible | (883,814 | ) | - | |||
| less: allowance collected | (273,963 | ) | (139,370 | ) | ||
| Allowance for doubtful accounts, end of year | $ | 563,153 | $ | 1,459,243 | ||
Liquidity risk
The Company tries to ensure that there is sufficient capital in order to meet short-term business requirements, after taking into account the Company's cash balances and available liquidity on the Company's $6 million operating line of credit. The Company's cash is invested in bank accounts at major financial institutions in Canada and the United States and is available on demand. The continuation of the Company as a going concern is dependent on future cash flows from operations including the successful sale and manufacture of electric vehicles to achieve a profitable level of operations and obtaining necessary financing to fund ongoing operations. The Company's ability to achieve its business objectives is subject to material uncertainty which casts substantial doubt upon the Company's ability to continue as a going concern. The Company will continue to rely on additional financings to further its operations and meet its capital requirements.
| GreenPower Motor Company Inc. Management's Discussion and Analysis For the year ended March 31, 2025 Discussion dated: July 30, 2025 |
The following table summarizes the Company's undiscounted financial commitments by maturity as at March 31, 2025:
| March 31, 2025 | Less than 3 months | 3 to 12 months | One to five years | Thereafter | ||||||||
| Line of credit (Note 1) | $ | 5,983,572 | $ | - | $ | - | $ | - | ||||
| Accounts payable and accrued liabilities | 3,719,716 | - | - | - | ||||||||
| Loans payable to related parties | - | 1,334,720 | 2,849,325 | - | ||||||||
| Lease liabilities | 127,105 | 597,248 | 3,952,393 | 2,000,901 | ||||||||
| Term loan facility | - | 3,591,354 | - | - | ||||||||
| Other liabilities | - | - | 17,133 | - | ||||||||
| $ | 9,830,393 | $ | 5,523,322 | $ | 6,818,851 | $ | 2,000,901 |
(1) GreenPower's operating line of credit with the Bank of Montreal is repayable on demand. GreenPower remains in compliance with the financial covenant under the facility and since inception of the loan the Bank of Montreal has not demanded repayment of the facility, however there is no guarantee that the Bank of Montreal will not do so in the future.
Market Risk
Market risk is the risk of loss that may arise from changes in market factors such as interest rates and foreign exchange. The Company is exposed to interest rate risk with respect to its Line of Credit. The Company is exposed to foreign exchange risk as it conducts business in both the United States and Canada. Management monitors its foreign currency balances, but the Company does not engage in any hedging activities to reduce its foreign currency risk.
As at March 31, 2025, the Company was exposed to currency risk through the following financial assets and liabilities in CDN Dollars.
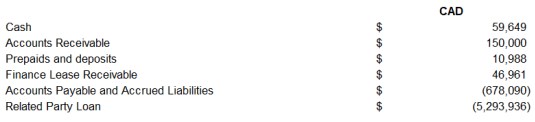
The CDN/USD exchange rate as at March 31, 2025 was $0.6956 (March 31, 2024 - $0.738). Based on the net exposure and assuming all other variables remain constant, a 10% change in the appreciation or depreciation of the Canadian dollar relative to the US dollar would result in a change of approximately
$396,800 to comprehensive income/loss.
Outlook
For the immediate future, the Company intends to:
Complete production and delivery of several models of EV Stars and BEAST school buses currently in various stages of production;
Deliver the remaining vehicles in finished goods inventory;
Evaluate and consider entering into new sources of financing to fund the business;
Search for ways to reduce costs in the Company's operations;
| GreenPower Motor Company Inc. Management's Discussion and Analysis For the year ended March 31, 2025 Discussion dated: July 30, 2025 |
Capitalization and Outstanding Security Data
The total number of common shares issued and outstanding is 29,491,162 as of March 31, 2025. There are no preferred shares issued and outstanding.
An incentive stock option plan was established for the benefit of directors, officers, employees and consultants of the Company. As of March 31, 2025, there are 2,582,628 options outstanding, and there are 1,725,000 common share warrants outstanding.
As at July 30, 2025 the Company had 30,002,591 issued shares, 2,458,000 options outstanding, and 4,289,081 warrants outstanding.
Risk Factors
Investing in the common shares of the Company involves risk. Prospective investors should carefully consider the risks described below, together with all of the other information included in this MD&A before making an investment decision. If any of the following risks actually occurs, the business, financial condition or results of operations of the Company could be harmed. In such an event, the trading price of the common shares could decline and prospective investors may lose part or all of their investment.
Operational Risk
The Company is exposed to many types of operational risks that affect all companies. Operational risk is the risk of loss resulting from inadequate or failed internal processes, people and/or systems. Operational risk is present in all of the Company's business activities, and incorporates exposure relating to fiduciary breaches, product liability claims, product recalls, regulatory compliance failures, legal disputes, business disruption, technology failures, business integration, damage to physical assets, employee safety, dependence on suppliers, foreign exchange fluctuations, insurance coverage and rising insurance costs. Such risks also include the risk of misconduct, theft or fraud by employees or others, unauthorized transactions by employees, operational or human error or not having sufficient levels or quality of staffing resources to successfully achieve the Company's strategic or operational objectives. The occurrence of an event caused by an operational risk that is material could have a material adverse effect on the Company's business, financial condition, liquidity and operating results.
Reliance on Management
The Company is relying solely on the past business success of its directors and officers. The success of the Company is dependent upon the efforts and abilities of its directors, officers and employees. The loss
of any of its directors, officers or employees could have a material adverse effect upon the business and prospects of the Company.
Competition in the Industry
The Company faces competition from a number of existing manufacturers of all-electric medium and heavy-duty vehicles and buses, as well as manufacturers of traditional medium and heavy-duty vehicles. The Company competes in the zero-emission, or alternative fuel segment of this market. Several of the company's competitors, both publicly listed and privately owned, have raised or have access to a significant amount of capital to invest in the growth and development of their businesses which has increased the competitive threat from several well-capitalized competitors. In addition to existing competitors in various market segments, there is the potential for future competitors to enter the market.
| GreenPower Motor Company Inc. Management's Discussion and Analysis For the year ended March 31, 2025 Discussion dated: July 30, 2025 |
Reliance on Key Suppliers
Our products contain numerous purchased parts which we source globally directly from suppliers, some of which are single-source suppliers, although we attempt to qualify and obtain components from multiple sources whenever feasible. Any significant increases in our production may require us to procure additional components in a short amount of time, and in the past we have also replaced certain suppliers because of their failure to provide components that met our quality control standards or our timing requirements. There is no assurance that we will be able to secure additional or alternate sources of supply for our components or develop our own replacements in a timely manner, if at all. If we encounter unexpected difficulties with key suppliers, and if we are unable to fill these needs from other suppliers, we could experience production delays and potential loss of access to important technology and parts for producing, servicing and supporting our products.
No Dividend Payment History
The Company has not paid any dividends and may not produce earnings or pay dividends in the immediate or foreseeable future.
Tariffs on Imported Goods
GreenPower sources components and parts to build its all-electric vehicles from suppliers globally, utilizes contract manufacturers located outside of North America for a portion of its all-electric vehicle production, and the importation of these parts, components and vehicles to North America are subject to tariffs which have recently increased and may increase further. The current US administration has significantly increased tariffs on US imports from virtually every country in the world. These tariffs have been in many cases amended, postponed, or changed in other ways since their initial announcements, and this has resulted in uncertainty over the quantum and duration of tariffs, and this lack of clarity has made it difficult to manage and mitigate the impacts of tariffs. The increase in and lack of clarity regarding tariffs on electric vehicles and certain parts and components used in the manufacture of electric vehicles that are imported to the United States from suppliers globally has increased costs for GreenPower, and led to delays on the processing and inspection of imported goods to the United States. The increased tariffs and importation delays has increased GreenPower's costs and has negatively impacted the financial results of the Company. While GreenPower's management is taking steps to mitigate the impact of planned tariff increases, including sourcing new manufacturers and contract manufacturers for certain products, this transition will take time, is subject to a number of risks, and GreenPower may not be able to mitigate the impact of any change in tariffs due to these risks.
Sales, Marketing, Government Grants and Subsidies
Presently, the initial price of the Company's products are higher than a traditional diesel bus and certain grants and subsidies are available to offset these higher prices. These grants and subsidies include but are not limited to the Hybrid and Zero-Emission Truck and Bus Voucher Incentive Project ("HVIP") from the California Air Resources Board ("CARB") in partnership with Calstart, the New Jersey Zero Emission Incentive Program ("NJZIP") operated by the New Jersey Economic Development Authority ("NJEDA") the Specialty-Use Vehicle Incentive ("SUVI") Program funded by the Province of British Columbia, Canada, the Incentives for Medium and Heavy-Duty Zero Emission Vehicles ("iMHZEV") program operated by the Canadian federal government, the clean trucks NYSERDA program and the New York Voucher Incentive Program in the state of New York, the South Coast AQMD funding in California, Federal Transit Authority funding for eligible transit properties across the US, and VW Mitigation Trust Funds allocated to programs throughout the US. The ability for potential purchasers to receive funding from these programs is subject to the risk of the programs being funded by governments, and the risk of the delay in the timing of advancing funds to the specific programs. To the extent that program funding is not approved, or if the funding is approved but timing of advancing of funds is delayed, subject to cancellation, or is otherwise uncertain, this could have a material adverse effect on our business, financial condition, operating results and prospects.
| GreenPower Motor Company Inc. Management's Discussion and Analysis For the year ended March 31, 2025 Discussion dated: July 30, 2025 |
Litigation and Legal Proceedings
The Company has filed a civil claim against the prior CEO and Director of the Company in the Province of British Columbia, and the prior CEO and Director of the Company has filed a response with a counterclaim for wrongful dismissal in the Province of British Columbia. The prior CEO and Director of the Company also filed a similar claim in the state of California in regards to this matter, and this claim has been stayed pending the outcome of the claim in British Columbia. There has not been a resolution on the British Columbia claim or counterclaim, or the California claim as at March 31, 2025. In addition, a company owned and controlled by a former employee who provided services to a subsidiary company of GreenPower until August 2013 filed a claim for breach of confidence against GreenPower in July 2020, and this claim has not been resolved as at March 31, 2024. During April 2023 the Company repossessed 27 EV Stars and 10 EV Star CC's after a lease termination due to non-payment. In addition, the Company repossessed 1 EV Star from the same customer due to non-payment. During May 2023 this customer filed a claim in the state of California against the Company and a subsidiary, and this matter has not been resolved as at March 31, 2025. As at March 31, 2025 the Company booked a contingent liability of $310,000 for potential judgements for legal matters. Any actual judgement may range from no liability to the Company, to an amount that is higher than the provision booked as at March 31, 2025. In addition, Management believes that there is an additional potential liability of $437,500 related to legal matters. Any actual liability may range from $nil to an amount higher than this amount. The Company has not booked a provision for potential liabilities related to legal matters as management considers it less than probable that these claims will not be successfully defended by the Company.
Current requirements and regulations may change or become more onerous
The Company's products must comply with local regulatory and safety requirements in order to be allowed to operate within the relevant jurisdiction or to qualify for funding. These requirements are subject to change and one regulatory environment is not indicative of another.
Cybersecurity risks
Significant disruptions of our information technology systems or breaches of our data security could adversely affect our business. The Company has not experienced a cybersecurity incident and has therefore not been affected by its exposure to cybersecurity risks. However, our business and operations may be materially adversely affected in the event of computer system failures or security or breaches due to cyber-attacks or cyber intrusions, including ransomware, phishing attacks and other malicious intrusions.
Provision for Warranty Costs
The Company offers warranties on the medium and heavy-duty vehicles and buses it sells. Management estimates the related provision for future warranty claims based on historical warranty claim information as well as recent trends that might suggest past cost information may differ from future claims. Factors that could impact future warranty claims include the success of the Company's productivity and quality initiatives as well as parts and labor costs. Actual warranty expense could differ from the provisions which are estimated by management, and these differences could be material and may negatively impact the company's financial results and financial position.
Reliance on Shipping
We rely on global shipping for vehicles that we produce at contract manufacturers, and for certain parts and components sourced from our global network of suppliers. Shipping costs can be volatile, and the Company has experienced shipping delays which has delayed deliveries in parts and components from our global suppliers, and deliveries of vehicles arriving from our contract manufacturers. While these delays and cost increases are not currently at a level that they have caused a material disruption or negative impact to our profitability, these delays and costs may increase to a point that they may negatively impact our financial results and ability to grow our business.
| GreenPower Motor Company Inc. Management's Discussion and Analysis For the year ended March 31, 2025 Discussion dated: July 30, 2025 |
Events after the reporting period
Subsequent to the end of the reporting period:
Further information about the Company and its operations can be obtained from www.sedarplus.com and www.sec.gov/edgar/search/