| Class name | Costs of a $10,000 investment | Costs paid as a percentage of a $10,000 investment (annualized) |
|---|---|---|
| Class A | $60 | 1.25% |
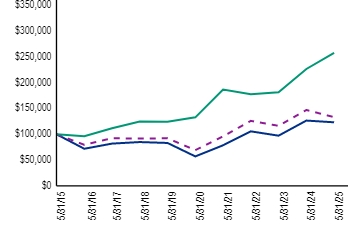
The share class had a -8.04% total return in the six months ended May 31, 2025, compared with the Linked Index,1 which returned -13.05%, and the MSCI World Index - net, which returned 2.21%.
Stock selection in the exploration & production sector helped the Fund's relative performance in the period compared with the Linked Index,1 in part due to the timing of an overweight allocation to Expand Energy Corp., which rose significantly while held in the portfolio. A non-investment in Texas Pacific Land also contributed to relative performance, as the stock had a sizable decline. An underweight and stock selection in the oilfield services & equipment sector aided performance as well, as did an out-of-index allocation to gas utilities.
The Fund's out-of-index allocation to renewable energy equipment companies detracted from relative performance, as these holdings underperformed as a group. Stock selection in the refining & marketing sector also hindered performance, mostly due to the timing of an allocation to Valero Energy. An out-of-index position in electrical power equipment companies further detracted from performance.
The Fund used derivatives in the form of forward foreign currency exchange contracts to manage currency risk on certain Fund positions denominated in foreign currencies. The currency exchange contracts significantly detracted from the Fund's total return for the six months ended May 31, 2025.
Top contributors |
Top detractors |
Exploration & production |
Renewable Energy Equipment |
Oilfield Services & Equipment |
Refining & Marketing |
Gas Utilities |
Electrical Power Equipment |

(as of May 31, 2025)
| 1 Year | 5 Years | 10 Years | |
|---|---|---|---|
| With sales charge2 | -7.34% | 15.16% | 1.28% |
| Without sales charge | -2.98% | 16.23% | 1.75% |
| Linked Index1 | -9.41% | 14.00% | 2.91% |
| MSCI World Index - net | 13.72% | 14.18% | 9.93% |
| Net assets | $117,210,700 |
| Number of portfolio holdings (excluding derivatives) | |
| Portfolio turnover rate3 | 76% |
| Top ten holdings4,5 | (%) |
|---|---|
| Energy Transfer LP | |
| Hess Corp. | |
| TC Energy Corp. | |
| Exxon Mobil Corp. | |
| Marathon Petroleum Corp. | |
| ConocoPhillips | |
| Canadian Natural Resources Ltd. | |
| Phillips 66 | |
| Shell PLC | |
| First Solar, Inc. |
| Sector diversification4,6 | (%) |
|---|---|
| Exploration & Production | |
| Midstream - Oil & Gas | |
| Integrated Oils | |
| Refining & Marketing | |
| Integrated Electric Utilities | |
| Power Generation | |
| Renewable Energy Equipment | |
| Oilfield Services & Equipment | |
| Base Metals | |
| Other (includes short-term Investments) |
| Country diversification4,6 | (%) |
|---|---|
| United States | |
| Canada | |
| Germany | |
| Denmark | |
| Italy | |
| Portugal | |
| Netherlands | |
| Other (includes short-term Investments) |
| Top ten holdings4,5 | (%) |
|---|---|
| Energy Transfer LP | |
| Hess Corp. | |
| TC Energy Corp. | |
| Exxon Mobil Corp. | |
| Marathon Petroleum Corp. | |
| ConocoPhillips | |
| Canadian Natural Resources Ltd. | |
| Phillips 66 | |
| Shell PLC | |
| First Solar, Inc. |
| Class name | Costs of a $10,000 investment | Costs paid as a percentage of a $10,000 investment (annualized) |
|---|---|---|
| Class C | $91 | 1.90% |
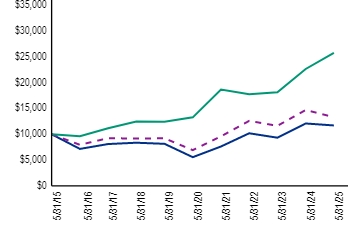
The share class had a -8.37% total return in the six months ended May 31, 2025, compared with the Linked Index,1 which returned -13.05%, and the MSCI World Index - net, which returned 2.21%.
Stock selection in the exploration & production sector helped the Fund's relative performance in the period compared with the Linked Index,1 in part due to the timing of an overweight allocation to Expand Energy Corp., which rose significantly while held in the portfolio. A non-investment in Texas Pacific Land also contributed to relative performance, as the stock had a sizable decline. An underweight and stock selection in the oilfield services & equipment sector aided performance as well, as did an out-of-index allocation to gas utilities.
The Fund's out-of-index allocation to renewable energy equipment companies detracted from relative performance, as these holdings underperformed as a group. Stock selection in the refining & marketing sector also hindered performance, mostly due to the timing of an allocation to Valero Energy. An out-of-index position in electrical power equipment companies further detracted from performance.
The Fund used derivatives in the form of forward foreign currency exchange contracts to manage currency risk on certain Fund positions denominated in foreign currencies. The currency exchange contracts significantly detracted from the Fund's total return for the six months ended May 31, 2025.
Top contributors |
Top detractors |
Exploration & production |
Renewable Energy Equipment |
Oilfield Services & Equipment |
Refining & Marketing |
Gas Utilities |
Electrical Power Equipment |

(as of May 31, 2025)
| 1 Year | 5 Years | 10 Years | |
|---|---|---|---|
| With sales charge | -4.63%2 | 15.46% | 1.09% |
| Without sales charge | -3.67% | 15.46% | 1.09% |
| Linked Index1 | -9.41% | 14.00% | 2.91% |
| MSCI World Index - net | 13.72% | 14.18% | 9.93% |
| Net assets | $117,210,700 |
| Number of portfolio holdings (excluding derivatives) | |
| Portfolio turnover rate3 | 76% |
| Top ten holdings4,5 | (%) |
|---|---|
| Energy Transfer LP | |
| Hess Corp. | |
| TC Energy Corp. | |
| Exxon Mobil Corp. | |
| Marathon Petroleum Corp. | |
| ConocoPhillips | |
| Canadian Natural Resources Ltd. | |
| Phillips 66 | |
| Shell PLC | |
| First Solar, Inc. |
| Sector diversification4,6 | (%) |
|---|---|
| Exploration & Production | |
| Midstream - Oil & Gas | |
| Integrated Oils | |
| Refining & Marketing | |
| Integrated Electric Utilities | |
| Power Generation | |
| Renewable Energy Equipment | |
| Oilfield Services & Equipment | |
| Base Metals | |
| Other (includes short-term Investments) |
| Country diversification4,6 | (%) |
|---|---|
| United States | |
| Canada | |
| Germany | |
| Denmark | |
| Italy | |
| Portugal | |
| Netherlands | |
| Other (includes short-term Investments) |
| Top ten holdings4,5 | (%) |
|---|---|
| Energy Transfer LP | |
| Hess Corp. | |
| TC Energy Corp. | |
| Exxon Mobil Corp. | |
| Marathon Petroleum Corp. | |
| ConocoPhillips | |
| Canadian Natural Resources Ltd. | |
| Phillips 66 | |
| Shell PLC | |
| First Solar, Inc. |
| Class name | Costs of a $10,000 investment | Costs paid as a percentage of a $10,000 investment (annualized) |
|---|---|---|
| Class I | $43 | 0.90% |
The share class had a -7.88% total return in the six months ended May 31, 2025, compared with the Linked Index,1 which returned -13.05%, and the MSCI World Index - net, which returned 2.21%.
Stock selection in the exploration & production sector helped the Fund's relative performance in the period compared with the Linked Index,1 in part due to the timing of an overweight allocation to Expand Energy Corp., which rose significantly while held in the portfolio. A non-investment in Texas Pacific Land also contributed to relative performance, as the stock had a sizable decline. An underweight and stock selection in the oilfield services & equipment sector aided performance as well, as did an out-of-index allocation to gas utilities.
The Fund's out-of-index allocation to renewable energy equipment companies detracted from relative performance, as these holdings underperformed as a group. Stock selection in the refining & marketing sector also hindered performance, mostly due to the timing of an allocation to Valero Energy. An out-of-index position in electrical power equipment companies further detracted from performance.
The Fund used derivatives in the form of forward foreign currency exchange contracts to manage currency risk on certain Fund positions denominated in foreign currencies. The currency exchange contracts significantly detracted from the Fund's total return for the six months ended May 31, 2025.
Top contributors |
Top detractors |
Exploration & production |
Renewable Energy Equipment |
Oilfield Services & Equipment |
Refining & Marketing |
Gas Utilities |
Electrical Power Equipment |
(as of May 31, 2025)
| 1 Year | 5 Years | 10 Years | |
|---|---|---|---|
| Class I2 | -2.67% | 16.66% | 2.11% |
| Linked Index1 | -9.41% | 14.00% | 2.91% |
| MSCI World Index - net | 13.72% | 14.18% | 9.93% |
| Net assets | $117,210,700 |
| Number of portfolio holdings (excluding derivatives) | |
| Portfolio turnover rate3 | 76% |
| Top ten holdings4,5 | (%) |
|---|---|
| Energy Transfer LP | |
| Hess Corp. | |
| TC Energy Corp. | |
| Exxon Mobil Corp. | |
| Marathon Petroleum Corp. | |
| ConocoPhillips | |
| Canadian Natural Resources Ltd. | |
| Phillips 66 | |
| Shell PLC | |
| First Solar, Inc. |
| Sector diversification4,6 | (%) |
|---|---|
| Exploration & Production | |
| Midstream - Oil & Gas | |
| Integrated Oils | |
| Refining & Marketing | |
| Integrated Electric Utilities | |
| Power Generation | |
| Renewable Energy Equipment | |
| Oilfield Services & Equipment | |
| Base Metals | |
| Other (includes short-term Investments) |
| Country diversification4,6 | (%) |
|---|---|
| United States | |
| Canada | |
| Germany | |
| Denmark | |
| Italy | |
| Portugal | |
| Netherlands | |
| Other (includes short-term Investments) |
| Top ten holdings4,5 | (%) |
|---|---|
| Energy Transfer LP | |
| Hess Corp. | |
| TC Energy Corp. | |
| Exxon Mobil Corp. | |
| Marathon Petroleum Corp. | |
| ConocoPhillips | |
| Canadian Natural Resources Ltd. | |
| Phillips 66 | |
| Shell PLC | |
| First Solar, Inc. |
| Class name | Costs of a $10,000 investment | Costs paid as a percentage of a $10,000 investment (annualized) |
|---|---|---|
| Class R | $67 | 1.40% |
The share class had a -8.09% total return in the six months ended May 31, 2025, compared with the Linked Index,1 which returned -13.05%, and the MSCI World Index - net, which returned 2.21%.
Stock selection in the exploration & production sector helped the Fund's relative performance in the period compared with the Linked Index,1 in part due to the timing of an overweight allocation to Expand Energy Corp., which rose significantly while held in the portfolio. A non-investment in Texas Pacific Land also contributed to relative performance, as the stock had a sizable decline. An underweight and stock selection in the oilfield services & equipment sector aided performance as well, as did an out-of-index allocation to gas utilities.
The Fund's out-of-index allocation to renewable energy equipment companies detracted from relative performance, as these holdings underperformed as a group. Stock selection in the refining & marketing sector also hindered performance, mostly due to the timing of an allocation to Valero Energy. An out-of-index position in electrical power equipment companies further detracted from performance.
The Fund used derivatives in the form of forward foreign currency exchange contracts to manage currency risk on certain Fund positions denominated in foreign currencies. The currency exchange contracts significantly detracted from the Fund's total return for the six months ended May 31, 2025.
Top contributors |
Top detractors |
Exploration & production |
Renewable Energy Equipment |
Oilfield Services & Equipment |
Refining & Marketing |
Gas Utilities |
Electrical Power Equipment |
(as of May 31, 2025)
| 1 Year | 5 Years | 10 Years | |
|---|---|---|---|
| Class R2 | -3.17% | 16.08% | 1.59% |
| Linked Index1 | -9.41% | 14.00% | 2.91% |
| MSCI World Index - net | 13.72% | 14.18% | 9.93% |
| Net assets | $117,210,700 |
| Number of portfolio holdings (excluding derivatives) | |
| Portfolio turnover rate3 | 76% |
| Top ten holdings4,5 | (%) |
|---|---|
| Energy Transfer LP | |
| Hess Corp. | |
| TC Energy Corp. | |
| Exxon Mobil Corp. | |
| Marathon Petroleum Corp. | |
| ConocoPhillips | |
| Canadian Natural Resources Ltd. | |
| Phillips 66 | |
| Shell PLC | |
| First Solar, Inc. |
| Sector diversification4,6 | (%) |
|---|---|
| Exploration & Production | |
| Midstream - Oil & Gas | |
| Integrated Oils | |
| Refining & Marketing | |
| Integrated Electric Utilities | |
| Power Generation | |
| Renewable Energy Equipment | |
| Oilfield Services & Equipment | |
| Base Metals | |
| Other (includes short-term Investments) |
| Country diversification4,6 | (%) |
|---|---|
| United States | |
| Canada | |
| Germany | |
| Denmark | |
| Italy | |
| Portugal | |
| Netherlands | |
| Other (includes short-term Investments) |
| Top ten holdings4,5 | (%) |
|---|---|
| Energy Transfer LP | |
| Hess Corp. | |
| TC Energy Corp. | |
| Exxon Mobil Corp. | |
| Marathon Petroleum Corp. | |
| ConocoPhillips | |
| Canadian Natural Resources Ltd. | |
| Phillips 66 | |
| Shell PLC | |
| First Solar, Inc. |
| Class name | Costs of a $10,000 investment | Costs paid as a percentage of a $10,000 investment (annualized) |
|---|---|---|
| Class Z | $43 | 0.90% |
The share class had a -7.87% total return in the six months ended May 31, 2025, compared with the Linked Index,1 which returned -13.05%, and the MSCI World Index - net, which returned 2.21%.
Stock selection in the exploration & production sector helped the Fund's relative performance in the period compared with the Linked Index,1 in part due to the timing of an overweight allocation to Expand Energy Corp., which rose significantly while held in the portfolio. A non-investment in Texas Pacific Land also contributed to relative performance, as the stock had a sizable decline. An underweight and stock selection in the oilfield services & equipment sector aided performance as well, as did an out-of-index allocation to gas utilities.
The Fund's out-of-index allocation to renewable energy equipment companies detracted from relative performance, as these holdings underperformed as a group. Stock selection in the refining & marketing sector also hindered performance, mostly due to the timing of an allocation to Valero Energy. An out-of-index position in electrical power equipment companies further detracted from performance.
The Fund used derivatives in the form of forward foreign currency exchange contracts to manage currency risk on certain Fund positions denominated in foreign currencies. The currency exchange contracts significantly detracted from the Fund's total return for the six months ended May 31, 2025.
Top contributors |
Top detractors |
Exploration & production |
Renewable Energy Equipment |
Oilfield Services & Equipment |
Refining & Marketing |
Gas Utilities |
Electrical Power Equipment |

(as of May 31, 2025)
| 1 Year | 5 Years | 10 Years | |
|---|---|---|---|
| Class Z2 | -2.67% | 16.64% | 2.12% |
| Linked Index1 | -9.41% | 14.00% | 2.91% |
| MSCI World Index - net | 13.72% | 14.18% | 9.93% |
| Net assets | $117,210,700 |
| Number of portfolio holdings (excluding derivatives) | |
| Portfolio turnover rate3 | 76% |
| Top ten holdings4,5 | (%) |
|---|---|
| Energy Transfer LP | |
| Hess Corp. | |
| TC Energy Corp. | |
| Exxon Mobil Corp. | |
| Marathon Petroleum Corp. | |
| ConocoPhillips | |
| Canadian Natural Resources Ltd. | |
| Phillips 66 | |
| Shell PLC | |
| First Solar, Inc. |
| Sector diversification4,6 | (%) |
|---|---|
| Exploration & Production | |
| Midstream - Oil & Gas | |
| Integrated Oils | |
| Refining & Marketing | |
| Integrated Electric Utilities | |
| Power Generation | |
| Renewable Energy Equipment | |
| Oilfield Services & Equipment | |
| Base Metals | |
| Other (includes short-term Investments) |
| Country diversification4,6 | (%) |
|---|---|
| United States | |
| Canada | |
| Germany | |
| Denmark | |
| Italy | |
| Portugal | |
| Netherlands | |
| Other (includes short-term Investments) |
| Top ten holdings4,5 | (%) |
|---|---|
| Energy Transfer LP | |
| Hess Corp. | |
| TC Energy Corp. | |
| Exxon Mobil Corp. | |
| Marathon Petroleum Corp. | |
| ConocoPhillips | |
| Canadian Natural Resources Ltd. | |
| Phillips 66 | |
| Shell PLC | |
| First Solar, Inc. |