Pay vs Performance Disclosure - USD ($)
|
5 Months Ended |
7 Months Ended |
12 Months Ended |
Dec. 31, 2024 |
Jul. 31, 2024 |
Dec. 31, 2024 |
Dec. 31, 2023 |
| Pay vs Performance Disclosure [Table] |
|
|
|
|
|
| Pay vs Performance [Table Text Block] |
|
|
|
| Year | | |
PEO Name and Tenure (1) | |
Summary
compensation table total CEO ($)(1)(2) | | |
Compensation
actually paid to CEO ($)(1)(3) | | |
Average
summary compensation table total for non-CEO NEOs ($) (2)(4) | | |
Average
compensation actually paid to non-CEO NEOs(3)(4) | | |
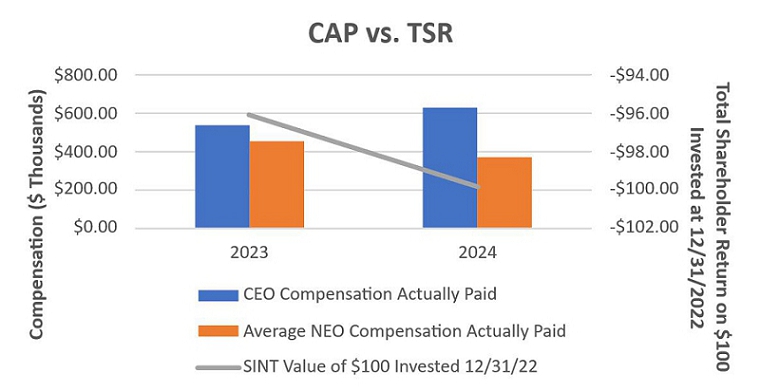
Value of Initial Fixed $100 Investment based on Total shareholder return($) | | |
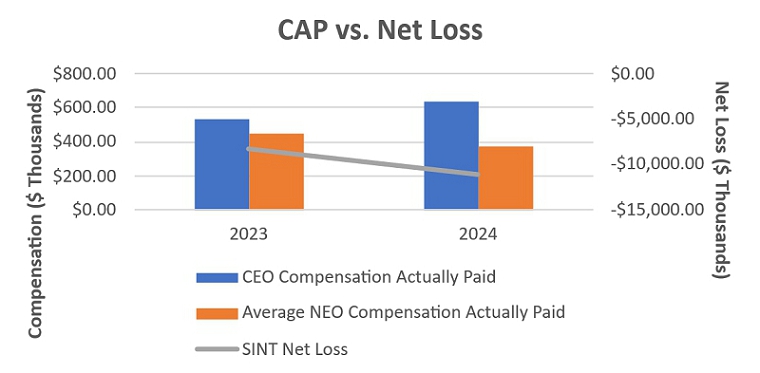
Net Income (in thousands) ($) | |
| (1) | 2024 | | |
B. Sonny Bal (Jan 1 – July, 31,2024 | |
| 440,651 | | |
| 411,267 | | |
| 369,824 | | |
| 355,191 | | |
| | | |
| | |
| (1) | 2024 | | |
Eric Olson (Aug 1 – Dec 31, 2024) | |
| 194,594 | | |
| 194,594 | | |
| | | |
| | | |
| (99.82 | ) | |
| (11,024 | ) |
| (1) | 2023 | | |
B. Sonny Bal | |
| 537,312 | | |
| 461,682 | | |
| 453,602 | | |
| 403,331 | | |
| (96.06 | ) | |
| (8,259 | ) |
|
|
| Named Executive Officers, Footnote [Text Block] |
|
|
|
| (1) |
B. Sonny Bal served as our CEO from January 1, 2024, until July 31, 2024. Eric Olson has served
as our CEO since August 1, 2024. In accordance with Instruction 3 to Item 402(v)(2)(i), we
have reported separate rows for each individual who served as PEO during the fiscal year
2024.
The
dollar amounts reported represent the actual total compensation for each CEO for their respective service periods during fiscal year
2024, as reported in the Summary Compensation Table. No averaging of compensation has been applied, in compliance with SEC Compliance
and Disclosure Interpretation 128D.01. |
|
|
| PEO Total Compensation Amount |
[1],[2] |
$ 194,594
|
$ 440,651
|
|
$ 537,312
|
| PEO Actually Paid Compensation Amount |
[2],[3] |
194,594
|
411,267
|
|
461,682
|
| Adjustment To PEO Compensation, Footnote [Text Block] |
|
|
|
| | |
Eric Olson | | |
B. Sonny Bal | | |
Average Non-CEO NEOs | | |
B. Sonny Bal | | |
Average Non-CEO NEOs | |
| | |
2024 |
|
|
2023 | |
| | |
Eric Olson | | |
B. Sonny Bal | | |
Average Non-CEO NEOs | | |
B. Sonny Bal | | |
Average Non-CEO NEOs | |
| Total Compensation from Summary Compensation Table | |
$ | 194,594 | | |
$ | 440,651 | | |
| 369,824 | | |
$ | 537,312 | | |
$ | 453,602 | |
| | |
| | | |
| | | |
| | | |
| | | |
| | |
| Adjustments for Equity Awards | |
| | | |
| | | |
| | | |
| | | |
| | |
| Adjustment for grant date values in the Summary Compensation Table | |
$ | - | | |
$ | (27,338 | ) | |
| (13,264 | ) | |
$ | (76,139 | ) | |
$ | (51,140 | ) |
| Year-end fair value of unvested awards granted in the current year | |
$ | - | | |
$ | - | | |
| - | | |
$ | 615 | | |
$ | 739 | |
| Year-over-year difference of year-end fair values for unvested awards granted in prior years | |
$ | - | | |
$ | (17 | ) | |
| (11 | ) | |
$ | (19 | ) | |
$ | (13 | ) |
| Fair values at vest date for awards granted and vested in current year | |
$ | - | | |
| - | | |
$ | - | | |
$ | - | | |
$ | - | |
| Difference in fair values between prior year-end fair values and vest date fair values for awards granted in prior years | |
$ | - | | |
$ | (2,029 | ) | |
| (1,358 | ) | |
$ | (87 | ) | |
$ | (58 | ) |
| Forfeitures during current year equal to prior year-end fair value | |
$ | - | | |
| - | | |
$ | - | | |
$ | - | | |
$ | - | |
| Dividends or dividend equivalents not otherwise included in total compensation | |
$ | - | | |
| - | | |
$ | - | | |
$ | - | | |
$ | - | |
| Total Adjustments for Equity Awards | |
$ | - | | |
$ | (14,633 | ) | |
| (14,633 | ) | |
$ | (75,630 | ) | |
$ | (50,472 | ) |
| | |
| | | |
| | | |
| | | |
| | | |
| | |
| Compensation Actually Paid (as calculated) | |
$ | 194,594 | | |
$ | 411,267 | | |
| 355,191 | | |
$ | 461,682 | | |
$ | 403,130 | |
|
|
| Non-PEO NEO Average Total Compensation Amount |
[1],[4] |
|
369,824
|
|
453,602
|
| Non-PEO NEO Average Compensation Actually Paid Amount |
[3],[4] |
|
$ 355,191
|
|
403,331
|
| Compensation Actually Paid vs. Total Shareholder Return [Text Block] |
|
|
|
|
|
| Compensation Actually Paid vs. Net Income [Text Block] |
|
|
|
|
|
| Total Shareholder Return Amount |
|
(99.82)
|
|
|
(96.06)
|
| Net Income (Loss) Attributable to Parent |
|
$ (11,024,000)
|
|
|
$ (8,259,000)
|
| PEO Name |
|
Eric Olson
|
B. Sonny Bal
|
|
B. Sonny Bal
|
| Additional 402(v) Disclosure [Text Block] |
|
|
|
The
dollar amounts reported in these columns represent the amounts of “compensation actually paid.” The Amounts are computed
in accordance with Item 402(v) of Regulation S-K by deducting and adding the following amounts from the “Total” column
of the SCT (pursuant to SEC rules, fair value at each measurement date is computed in a manner consistent with the fair value methodology
used to account for share-based payments in our financial statements under GAAP).
|
|
| Eric Olson [Member] |
|
|
|
|
|
| Pay vs Performance Disclosure [Table] |
|
|
|
|
|
| PEO Total Compensation Amount |
|
|
$ 194,594
|
|
|
| PEO Actually Paid Compensation Amount |
|
|
194,594
|
|
|
| Eric Olson [Member] | Adjustment for Grant Date Values in the Summary Compensation Table [Member] |
|
|
|
|
|
| Pay vs Performance Disclosure [Table] |
|
|
|
|
|
| Total Adjustments for Equity Awards |
|
|
|
|
|
| Eric Olson [Member] | Year-End Fair Value of Unvested Awards Granted in the Current Year [Member] |
|
|
|
|
|
| Pay vs Performance Disclosure [Table] |
|
|
|
|
|
| Total Adjustments for Equity Awards |
|
|
|
|
|
| Eric Olson [Member] | Year-Over-Year Difference of Year End Fair Values for Unvested Awards Granted in Prior Years [Member] |
|
|
|
|
|
| Pay vs Performance Disclosure [Table] |
|
|
|
|
|
| Total Adjustments for Equity Awards |
|
|
|
|
|
| Eric Olson [Member] | Fair Values at Vest Date for Awards Granted and Vested in Current Year [Member] |
|
|
|
|
|
| Pay vs Performance Disclosure [Table] |
|
|
|
|
|
| Total Adjustments for Equity Awards |
|
|
|
|
|
| Eric Olson [Member] | Difference in Fair Values Between Prior Year-End Fair Values and Vest Date Fair Values for Awards Granted in Prior Years [Member] |
|
|
|
|
|
| Pay vs Performance Disclosure [Table] |
|
|
|
|
|
| Total Adjustments for Equity Awards |
|
|
|
|
|
| Eric Olson [Member] | Forfeitures During Current Year Equal to Prior Year-End Fair Value [Member] |
|
|
|
|
|
| Pay vs Performance Disclosure [Table] |
|
|
|
|
|
| Total Adjustments for Equity Awards |
|
|
|
|
|
| Eric Olson [Member] | Dividends or Dividend Equivalents not Otherwise Included in Total Compensation [Member] |
|
|
|
|
|
| Pay vs Performance Disclosure [Table] |
|
|
|
|
|
| Total Adjustments for Equity Awards |
|
|
|
|
|
| Eric Olson [Member] | Total Adjustments for Equity Awards [Member] |
|
|
|
|
|
| Pay vs Performance Disclosure [Table] |
|
|
|
|
|
| Total Adjustments for Equity Awards |
|
|
|
|
|
| B Sonny Bal [Member] |
|
|
|
|
|
| Pay vs Performance Disclosure [Table] |
|
|
|
|
|
| PEO Total Compensation Amount |
|
$ 440,651
|
|
|
$ 537,312
|
| PEO Actually Paid Compensation Amount |
|
411,267
|
|
|
461,682
|
| B Sonny Bal [Member] | Adjustment for Grant Date Values in the Summary Compensation Table [Member] |
|
|
|
|
|
| Pay vs Performance Disclosure [Table] |
|
|
|
|
|
| Total Adjustments for Equity Awards |
|
(27,338)
|
|
|
(76,139)
|
| B Sonny Bal [Member] | Year-End Fair Value of Unvested Awards Granted in the Current Year [Member] |
|
|
|
|
|
| Pay vs Performance Disclosure [Table] |
|
|
|
|
|
| Total Adjustments for Equity Awards |
|
|
|
|
615
|
| B Sonny Bal [Member] | Year-Over-Year Difference of Year End Fair Values for Unvested Awards Granted in Prior Years [Member] |
|
|
|
|
|
| Pay vs Performance Disclosure [Table] |
|
|
|
|
|
| Total Adjustments for Equity Awards |
|
(17)
|
|
|
(19)
|
| B Sonny Bal [Member] | Fair Values at Vest Date for Awards Granted and Vested in Current Year [Member] |
|
|
|
|
|
| Pay vs Performance Disclosure [Table] |
|
|
|
|
|
| Total Adjustments for Equity Awards |
|
|
|
|
|
| B Sonny Bal [Member] | Difference in Fair Values Between Prior Year-End Fair Values and Vest Date Fair Values for Awards Granted in Prior Years [Member] |
|
|
|
|
|
| Pay vs Performance Disclosure [Table] |
|
|
|
|
|
| Total Adjustments for Equity Awards |
|
(2,029)
|
|
|
(87)
|
| B Sonny Bal [Member] | Forfeitures During Current Year Equal to Prior Year-End Fair Value [Member] |
|
|
|
|
|
| Pay vs Performance Disclosure [Table] |
|
|
|
|
|
| Total Adjustments for Equity Awards |
|
|
|
|
|
| B Sonny Bal [Member] | Dividends or Dividend Equivalents not Otherwise Included in Total Compensation [Member] |
|
|
|
|
|
| Pay vs Performance Disclosure [Table] |
|
|
|
|
|
| Total Adjustments for Equity Awards |
|
|
|
|
|
| B Sonny Bal [Member] | Total Adjustments for Equity Awards [Member] |
|
|
|
|
|
| Pay vs Performance Disclosure [Table] |
|
|
|
|
|
| Total Adjustments for Equity Awards |
|
$ (14,633)
|
|
|
(75,630)
|
| Non-PEO NEO [Member] |
|
|
|
|
|
| Pay vs Performance Disclosure [Table] |
|
|
|
|
|
| PEO Actually Paid Compensation Amount |
|
|
|
$ 355,191
|
403,130
|
| Non-PEO NEO Average Total Compensation Amount |
|
|
|
369,824
|
453,602
|
| Non-PEO NEO [Member] | Adjustment for Grant Date Values in the Summary Compensation Table [Member] |
|
|
|
|
|
| Pay vs Performance Disclosure [Table] |
|
|
|
|
|
| Total Adjustments for Equity Awards |
|
|
|
(13,264)
|
(51,140)
|
| Non-PEO NEO [Member] | Year-End Fair Value of Unvested Awards Granted in the Current Year [Member] |
|
|
|
|
|
| Pay vs Performance Disclosure [Table] |
|
|
|
|
|
| Total Adjustments for Equity Awards |
|
|
|
|
739
|
| Non-PEO NEO [Member] | Year-Over-Year Difference of Year End Fair Values for Unvested Awards Granted in Prior Years [Member] |
|
|
|
|
|
| Pay vs Performance Disclosure [Table] |
|
|
|
|
|
| Total Adjustments for Equity Awards |
|
|
|
(11)
|
(13)
|
| Non-PEO NEO [Member] | Fair Values at Vest Date for Awards Granted and Vested in Current Year [Member] |
|
|
|
|
|
| Pay vs Performance Disclosure [Table] |
|
|
|
|
|
| Total Adjustments for Equity Awards |
|
|
|
|
|
| Non-PEO NEO [Member] | Difference in Fair Values Between Prior Year-End Fair Values and Vest Date Fair Values for Awards Granted in Prior Years [Member] |
|
|
|
|
|
| Pay vs Performance Disclosure [Table] |
|
|
|
|
|
| Total Adjustments for Equity Awards |
|
|
|
(1,358)
|
(58)
|
| Non-PEO NEO [Member] | Forfeitures During Current Year Equal to Prior Year-End Fair Value [Member] |
|
|
|
|
|
| Pay vs Performance Disclosure [Table] |
|
|
|
|
|
| Total Adjustments for Equity Awards |
|
|
|
|
|
| Non-PEO NEO [Member] | Dividends or Dividend Equivalents not Otherwise Included in Total Compensation [Member] |
|
|
|
|
|
| Pay vs Performance Disclosure [Table] |
|
|
|
|
|
| Total Adjustments for Equity Awards |
|
|
|
|
|
| Non-PEO NEO [Member] | Total Adjustments for Equity Awards [Member] |
|
|
|
|
|
| Pay vs Performance Disclosure [Table] |
|
|
|
|
|
| Total Adjustments for Equity Awards |
|
|
|
$ (14,633)
|
$ (50,472)
|
|
|