Shareholder Report
May 31, 2025
USD ($)
Holding
capitalgroup.com/CCBF-M
(800) 421-4225
.
What were the fund costs for the last year?
(based on a hypothetical $10,000 investment)Share class | Costs of a $10,000 investment | Costs paid as a percentage of a $10,000 investment |
| Class M | $ 0* | 0.00 % † |
*
Amount less than $1.†
Amount less than 0.01%.Management's discussion of fund performance
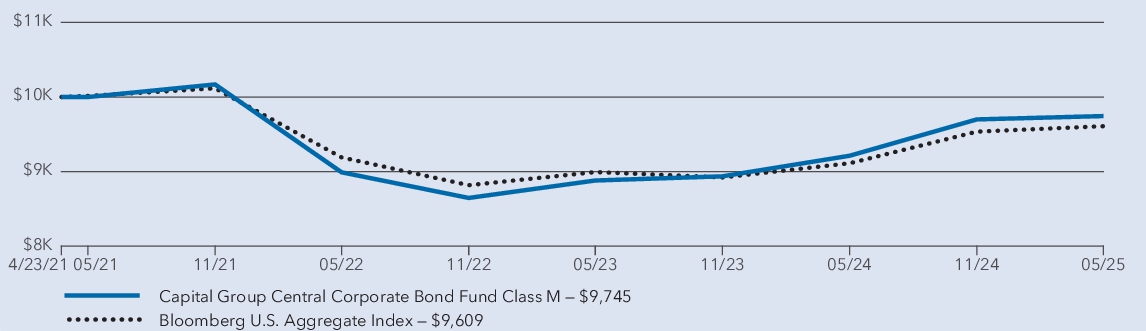
The fund’s Class M shares gained 5.77% for the year ended May 31, 2025. That result compares with a 5.46% gain for the Bloomberg U.S. Aggregate Index.
What factors influenced results
During the fund’s fiscal year, the Bloomberg U.S. Corporate Investment Grade Index outpaced both the Bloomberg U.S. Aggregate Bond Index and Bloomberg U.S. Treasury Index. The U.S. Federal Reserve reduced rates three times in 2024 as inflation eased. U.S. Treasury yields rose following the first rate cut in September, but fluctuated in early 2025 amid concerns over slower economic growth and higher perceived credit risk. Although corporate bond valuations deflated as corporate credit spreads widened, they remain attractive due to solid fundamentals and substantial yield advantage over Treasuries.
Within the fund, each of the major sectors contributed positively to overall returns, with the fund’s holdings in consumer noncyclical and electric utilities debt being particularly additive relative to the benchmark. Duration and curve positioning had little impact.
Holding a smaller portion of investments than the index in consumer cyclical, technology and banking sectors had a relative negative impact on returns. Likewise, exposure to derivatives used to hedge credit and more efficiently execute interest rate positioning negatively impacted returns.
Average annual total returns
1 year | Since inception 1 | |
| Capital Group Central Corporate Bond Fund — Class M 2 | 5.77 % | (0.63 ) % |
| Bloomberg U.S. Aggregate Index 3 | 5.46 % | (0.97 ) % |
1
Class M shares were first offered on April 23, 2021.2
Investment results assume all distributions are reinvested and reflect applicable fees and expenses. When applicable, results
reflect fee waivers and/or expense reimbursements, without which they would have been lower.3
Results assume all distributions are reinvested. Any market index shown is unmanaged, and therefore, has no expenses. Investors cannot invest directly in an index. Source(s): Bloomberg Index Services Ltd.Key fund statistics
| Fund net assets (in millions) | $ 10,593 |
| Total number of portfolio holdings | 789 |
| Total advisory fees paid (in millions) | None |
| Portfolio turnover rate | 205 % |
Portfolio holdings by sector
(percent of net assets)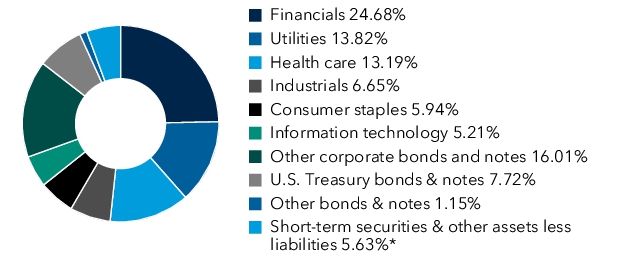
*Includes derivatives.
| [1] | Amount less than $1. |
| [2] | Amount less than 0.01%. |