The following bar chart and table provide some indication of the risks of investing in Small Cap Fund by showing changes in Small Cap Fund’s performance over time. The tables also compare Small Cap Fund’s performance to a broad measure of market performance that reflects the type of securities in which Small Cap Fund invests. Past performance does not necessarily indicate how Small Cap Fund will perform (before and after taxes) in the future. Updated performance information is available at www.peartreefunds.com.
A Note on Performance
Ordinary Shares and Institutional Shares commenced operations on August 3, 1992, and January 6, 1993, respectively. R6 Shares commenced operations on October 31, 2024. Performance information for R6 Shares will be available after the share class has been offered for a full calendar year. Returns for R6 Shares would have been substantially similar to the returns of Institutional Shares because each share class is invested in the same portfolio of securities, and returns would differ only to the extent that expenses of the classes are different. Prior to January 1, 2015, Small Cap Fund had a different sub-adviser and pursued a different principal investment strategy.
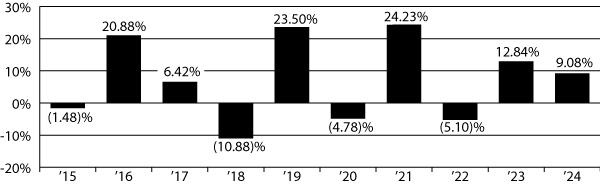
Calendar year-to-date return of the Ordinary Shares of Small Cap Fund as of June 30, 2025 was 0.89% .
| Best Quarter: | 29.07 | % | |||
| Worst Quarter: | (36.99 | )% |
| 1 Year | 5 Years | 10 Years | |||||||
| Ordinary Shares Before Tax | 8.69 | % | 6.60 | % | 6.74 | % | |||
| After Tax on Distributions | 7.90 | % | 5.47 | % | 5.30 | % | |||
| After Tax on Distributions, with Sale | 5.75 | % | 5.01 | % | 5.00 | % | |||
| Institutional Shares Before Tax | 9.08 | % | 7.00 | % | 7.11 | % | |||
| R6 Shares Before Tax | |||||||||
| S&P 500 Index (reflects no deductions for fees, expenses or taxes)(1) | 25.02 | % | 14.53 | % | 13.10 | % | |||
| Russell 2000® Index (reflects no deductions for fees, expenses or taxes)(2) | 11.54 | % | 7.40 | % | 7.82 | % | |||
| (1) | The S&P 500 Index is a widely followed, market-cap-weighted stock market index that includes 500 leading U.S. companies. The index returns do not reflect the deduction of expenses, which have been deducted from the Fund’s returns. The index returns assume reinvestment of all distributions and do not reflect the deduction of taxes and fees. Individuals cannot invest directly in the index. |
| (2) | The Russell 2000 Index is a market capitalization-weighted index of 2,000 small company stocks. It is widely recognized as representative of the general market for small company stocks. Index returns assume the reinvestment of dividends and, unlike Fund returns, do not reflect any fees or expenses. You cannot invest directly in an Index. |
After-Tax Returns. After-tax returns are calculated using the historical highest individual federal marginal income tax rates and do not reflect the impact of state or local taxes. The after-tax returns shown are not relevant if you hold your shares in a retirement account or in another tax-deferred arrangement. After-tax returns are shown only for Ordinary Shares and after-tax returns for Institutional Shares may vary. Actual after-tax returns may differ depending on your individual circumstances.
The following bar chart and table provide some indication of the risks of investing in Quality Fund by showing changes in Quality Fund’s performance over time. The tables also compare Quality Fund’s performance to a broad measure of market performance that reflects the type of securities in which Quality Fund invests. Past performance does not necessarily indicate how Quality Fund will perform (before and after taxes) in the future. Updated performance information is available at www.peartreefunds.com.
Notes on Performance
Ordinary Shares and Institutional Shares commenced operations on May 6, 1985 and March 25, 1991, respectively. R6 Shares commenced operations on October 31, 2024. Performance information for R6 Shares will be available after the share class has been offered for a full calendar year. Returns for R6 Shares would have been substantially similar to the returns of Institutional Shares because each share class is invested in the same portfolio of securities, and returns would differ only to the extent that expenses of the classes are different. Prior to February 15, 2018, Quality Fund had a different sub-adviser. Prior to January 27, 2011, Quality Fund pursued different principal investment strategies.
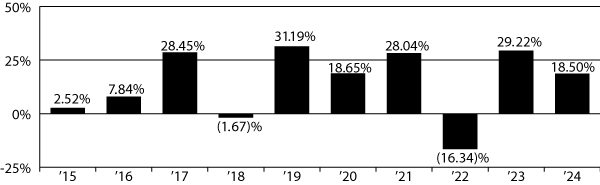
Calendar year-to-date return of the Ordinary Shares of Quality Fund as of June 30, 2025 was 6.37%.
| Best Quarter: | 15.07 | % | |||
| Worst Quarter: | (16.05 | )% |
| 1 Year | 5 Years | 10 Years | |||||||
| Ordinary Shares Before Tax | 18.01 | % | 14.15 | % | 13.51 | % | |||
| After Tax on Distributions | 15.81 | % | 11.88 | % | 10.92 | % | |||
| After Tax on Distributions, with Sale | 12.30 | % | 10.95 | % | 10.40 | % | |||
| Institutional Shares Before Tax | 18.50 | % | 14.60 | % | 13.90 | % | |||
| R6 Shares Before Tax | |||||||||
| S&P 500 Index (reflects no deductions for fees, expenses or taxes)(1) | 25.02 | % | 14.53 | % | 13.10 | % | |||
| (1) | The S&P 500 Index is a widely followed, market-cap-weighted stock market index that includes 500 leading U.S. companies. The index returns do not reflect the deduction of expenses, which have been deducted from the Fund’s returns. The index returns assume reinvestment of all distributions and do not reflect the deduction of taxes and fees. Individuals cannot invest directly in the index. |
After-Tax Returns. After-tax returns are calculated using the historical highest individual federal marginal income tax rates and do not reflect the impact of state or local taxes. The after-tax returns shown are not relevant if you hold your shares in a retirement account or in another tax-deferred arrangement. After-tax returns are shown only for Ordinary Shares and after-tax returns for Institutional Shares may vary. Actual after-tax returns may differ depending on your individual circumstances.
While the Environmental Opportunities Fund’s investment objective, principal investment strategies, and risks are identical to fund’s predecessor (the “Predecessor Fund”) and theoretically would have invested in the same portfolio of securities, the Environmental Opportunities Fund’s performance may be different than the performance of the Predecessor Fund due to, among other things, differences in fees and expenses.
The bar chart and table that follow provide some indication of the risks of investing in the Environmental Opportunities Fund by showing changes in the Predecessor Fund’s performance from year to year and by showing how the Predecessor Fund’s average annual total returns for one year and since inception compare with those of a broad-based securities market index. How the Predecessor Fund has performed in the past (before and after taxes) is not necessarily an indication of how the Environmental Opportunities Fund will perform in the future. Updated performance information is available at www.peartreefunds.com.
Performance information shown prior to the close of business on August 31, 2021 is that of the Predecessor Fund. Accordingly, the returns of the Ordinary Shares in the bar chart and table are the returns of the Predecessor Fund’s Investor Class. Returns of the Institutional Shares shown in the table below reflect the returns of the Predecessor Fund’s Institutional Class.
Notes on Performance
The Predecessor Fund’s Investor Class and Institutional Class commenced operations on September 1, 2017. R6 Shares commenced operations on September 1, 2021.
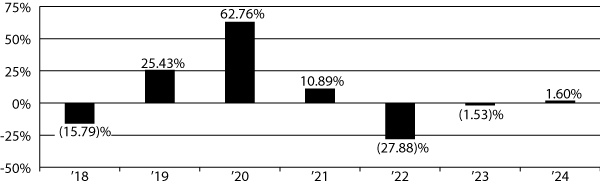
Calendar year-to-date return of the Ordinary Shares of Environmental Opportunities Fund as of June 30, 2025 was 7.42 %.
Highest/Lowest quarterly results during this time period were:
| Best Quarter: | 37.95 | % | |||
| Worst Quarter: | (23.30 | )% |
| 1 Year | 5 Year | Since Inception (9/1/2017) (1) | |||||||
| Ordinary Shares Before Tax | 1.32 | % | 5.36 | % | 4.85 | % | |||
| After Tax on Distributions | 1.32 | % | 4.93 | % | 4.56 | % | |||
| After Tax on Distributions, with Sale | 0.78 | % | 4.25 | % | 3.87 | % | |||
| Institutional Shares Before Tax | 1.60 | % | 5.63 | % | 5.11 | % | |||
| R6 Shares Before Tax | 1.67 | % | - | (10.34) | %(2) | ||||
| MSCI World Index (reflects no deductions for fees, expenses or taxes) (3) | 19.19 | % | 11.70 | % | 11.40 | % | |||
| (1) | Inception of the Predecessor Fund. |
| (2) | Inception 9/1/2021 |
| (3) | The MSCI World Index captures large and mid-cap representation across 23 Developed Markets (DM) countries. With 1,325 constituents as of May 31, 2025, the index covers approximately 85 percent of the free float-adjusted market capitalization in each country. The index returns do not reflect the deduction of expenses, which have been deducted from the Fund’s returns. The index returns assume the reinvestment of all distributions and do not reflect the deduction of taxes and fees. Individuals cannot invest directly in the index. |
After-Tax Returns. After-tax returns are calculated using the historical highest individual federal marginal income tax rates and do not reflect the impact of state or local taxes. The after-tax returns shown are not relevant if you hold your shares in a retirement account or in another tax-deferred arrangement. After-tax returns are shown only for Ordinary Shares and after-tax returns for Institutional Shares may vary. Actual after-tax returns may differ depending on your individual circumstances.
The following bar chart and table provide some indication of the risks of investing in Foreign Value Fund by showing changes in Foreign Value Fund’s performance over time. The tables also compare Foreign Value Fund’s performance to a broad measure of market performance that reflects the type of securities in which Foreign Value Fund invests. Past performance does not necessarily indicate how Foreign Value Fund will perform (before and after taxes) in the future. Updated performance information is available at www.peartreefunds.com.
A Note on Performance
Ordinary Shares and Institutional Shares commenced operations on May 15, 1998 and December 1, 1998, respectively. R6 Shares commenced operations on February 6, 2017.
Calendar year-to-date return of the Ordinary Shares of Foreign Value Fund as of June 30, 2025 was 18.48%.
| Best Quarter: | 27.11 | % | |||
| Worst Quarter: | (33.17 | )% |
1 Year |
5 Years |
10 Years | |||||||
| Ordinary Shares Before Tax | (0.69) | % | 1.89 | % | 3.86 | % | |||
| After Tax on Distributions | (0.93) | % | 1.71 | % | 3.73 | % | |||
| After Tax on Distributions, with Sale | 0.13 | % | 1.64 | % | 3.22 | % | |||
| Institutional Shares Before Tax | (0.35) | % | 2.27 | % | 4.22 | % | |||
| R6 Shares Before Tax | (0.27) | % | 2.34 | % | |||||
| MSCI EAFE Index (reflects no deductions for fees, expenses or taxes)(1) | 4.35 | % | 5.24 | % | 5.71 | % | |||
| (1) | The MSCI EAFE Index captures 695 large- and mid-cap companies across 21 developed markets, excluding the U.S. and Canada, covering approximately 85 percent of the free float-adjusted market capitalization of those developed markets. The index returns do not reflect the deduction of expenses, which have been deducted from the Fund’s returns. The index returns assume reinvestment of all distributions and do not reflect the deduction of taxes and fees. Individuals cannot invest directly in the index. However, an individual may invest in exchange traded funds or other investment vehicles that attempt to track the performance of a benchmark index. |
After-Tax Returns. After-tax returns are calculated using the historical highest individual federal marginal income tax rates and do not reflect the impact of state or local taxes. The after-tax returns shown are not relevant if you hold your shares in a retirement account or in another tax-deferred arrangement. After-tax returns are shown only for Ordinary Shares and after-tax returns for Institutional Shares and R6 Shares may vary. Actual after-tax returns may differ depending on your individual circumstances.
The following bar chart and table provide some indication of the risks of investing in Foreign Value Small Cap Fund by showing changes in Foreign Value Small Cap Fund’s performance over time. The tables also compare Foreign Value Small Cap Fund’s performance to a broad measure of market performance that reflects the type of securities in which Foreign Value Small Cap Fund invests. Past performance does not necessarily indicate how Foreign Value Small Cap Fund will perform (before and after taxes) in the future. Updated performance information is available at www.peartreefunds.com.
A Note on Performance
Ordinary Shares and Institutional Shares each commenced operations on May 1, 2008. R6 Shares commenced operations on February 6, 2017.
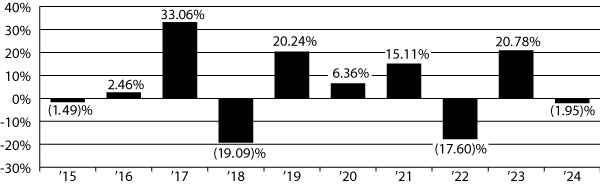
Calendar year-to-date return of the Ordinary Shares of Foreign Value Small Cap Fund as of June 30, 2025 was 22.91%.
| Best Quarter: | 22.95 | % | |||
| Worst Quarter: | (30.70 | )% |
| 1 Year | 5 Years | 10 Years | |||||||
| Ordinary Shares Before Tax | (2.31) | % | 3.55 | % | 4.52 | % | |||
| After Tax on Distributions | (2.68) | % | 3.01 | % | 4.00 | % | |||
| After Tax on Distributions, with Sale | (0.78) | % | 2.88 | % | 3.68 | % | |||
| Institutional Shares Before Tax | (1.95 | % | 3.92 | % | 4.87 | % | |||
| R6 Shares Before Tax | (1.98) | % | 3.97 | % | |||||
| MSCI ACWI ex USA (reflects no deduction for fees, expenses or taxes)(1) | 6.09 | % | 4.61 | % | 5.31 | % | |||
| MSCI ACWI ex USA Small Cap (reflects no deduction for fees, expenses or taxes)(2) | 3.85 | % | 4.77 | % | 6.10 | % | |||
| (1) | MSCI ACWI ex USA Index captures 1,981 large- and mid-cap companies across 22 of 23 developed markets (other the U.S.), and 24 emerging markets countries, and it covers approximately 85 percent of the global equity opportunity set outside the U.S. The index returns do not reflect the deduction of expenses, which have been deducted from the Fund’s returns. The index returns assume reinvestment of all distributions and do not reflect the deduction of taxes and fees. Individuals cannot invest directly in the index. |
| (2) | The MSCI ACWI ex USA Small Cap Index captures small cap representation across 22 of 23 Developed Markets (DM) countries (excluding the United States) and 24 Emerging Markets (EM). With 4,255 constituents as of May 31, 2025, the index covers approximately 14 percent of the global equity opportunity set outside the U.S. The index returns do not reflect the deduction of expenses, which have been deducted from the Fund’s returns. The index returns assume the reinvestment of all distributions and do not reflect the deduction of taxes and fees. Individuals cannot invest directly in the index. |
After-Tax Returns. After-tax returns are calculated using the historical highest individual federal marginal income tax rates and do not reflect the impact of state or local taxes. The after-tax returns shown are not relevant if you hold your shares in a retirement account or in another tax-deferred arrangement. After-tax returns are shown only for Ordinary Shares and after-tax returns for Institutional Shares and R6 Shares may vary. Actual after-tax returns may differ depending on your individual circumstances.
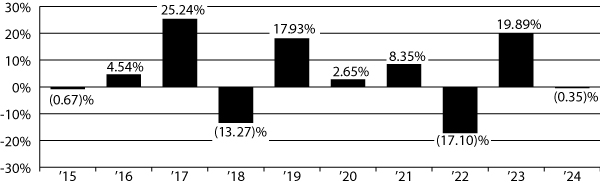
The following bar chart and table provide some indication of the risks of investing in International Opportunities Fund by showing changes in International Opportunities Fund’s performance over time. The tables also compare International Opportunities Fund’s performance to a broad measure of market performance that reflects the type of securities in which International Opportunities Fund invests. Past performance does not necessarily indicate how International Opportunities Fund will perform (before and after taxes) in the future. Updated performance information is available at www.peartreefunds.com.
A Note on Performance
Ordinary Shares, Institutional Shares and R6 Shares commenced operations on January 30, 2019. Prior to November 15, 2019, International Opportunities Fund had a different investment sub-adviser and pursued different principal investment strategies. The current investment sub-adviser began managing the Fund with the current principal investment strategies on January 1, 2020 after a transition period beginning November 15, 2019.
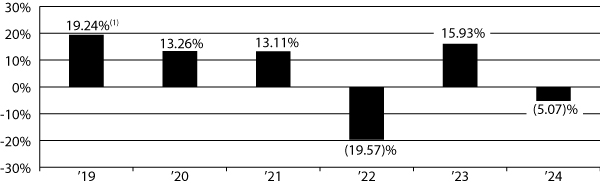
| (1) | Return from January 30, 2019 to December 31, 2019 |
Calendar year-to-date return of the Ordinary Shares of International Opportunities Fund as of June 30, 2025 was 15.45%.
| Best Quarter: | 25.73 | % | ||||
| Worst Quarter: | (32.88 | )% |
| 1 Year | 5 Years | Since Inception |
||||||||
| Ordinary Shares Before Tax | (5.62) | % | 2.43 | % | 5.13% | |||||
| After Tax on Distributions | (5.96) | % | 1.54 | % | 4.35% | |||||
| After Tax on Distributions, with Sale | (3.00) | % | 1.79 | % | 3.94% | |||||
| Institutional Shares Before Tax | (5.07) | % | 2.89 | % | 5.60% | |||||
| R6 Shares Before Tax | (5.14) | % | 2.91 | % | 5.62% | |||||
| MSCI ACWI ex USA (reflects no deduction for fees, expenses or taxes)(1) | 6.09 | % | 4.61 | % | 6.13% | |||||
| (1) | The MSCI ACWI ex USA Index captures large and mid-cap representation across 22 of 23 Developed Markets (DM) countries (excluding the United States) and 24 Emerging Markets (EM) countries. With 1,981 constituents as of June 30, 2025, the index covers approximately 85 percent of the global equity opportunity set outside the United States. The index returns do not reflect the deduction of expenses, which have been deducted from the Fund’s returns. The index returns assume the reinvestment of all distributions and do not reflect the deduction of taxes and fees. Individuals cannot invest directly in the index. |
After-Tax Returns. After-tax returns are calculated using the historical highest individual federal marginal income tax rates and do not reflect the impact of state or local taxes. The after-tax returns shown are not relevant if you hold your shares in a retirement account or in another tax-deferred arrangement. After-tax returns are shown only for Ordinary Shares and after-tax returns for Institutional Shares and R6 Shares may vary. Actual after-tax returns may differ depending on your individual circumstances.