Exhibit 99.1


   LOGO

   Press Release


Brussels – 31 July 2025 - 7:00am CET

   Regulated information1

AB InBev Reports Second Quarter 2025 Results

Consistent execution of our strategy delivered an EBITDA increase of 6.5%, continued margin expansion and high-single digit Underlying EPS growth

“Beer is a passion point for consumers. The resilience of the beer category and the continued momentum of our megabrands delivered another quarter of profitable growth. EBITDA increased by 6.5% and the ongoing optimization of our business drove Underlying EPS growth of 8.7%. While the operating environment remains dynamic, the consistent execution of our strategy by our teams and partners drove a solid first half of the year and reinforces our confidence in delivering on our outlook for 2025.” – Michel Doukeris, CEO, AB InBev


Revenue

+3.0%


Revenue increased by 3.0% in 2Q25 with revenue per hl growth of 4.9% and by 2.3% in HY25 with revenue per hl growth of 4.3%.


Reported revenue decreased by 2.1% in 2Q25 to 15 004 million USD and by 4.2% in HY25 to 28 632 million USD, impacted by unfavorable currency translation.


5.6% increase in combined revenues of our megabrands, led by Corona, which grew by 7.7% outside of its home market in 2Q25.


33% increase in revenue of our no-alcohol beer portfolio in 2Q25.


63% increase in Gross Merchandise Value (GMV) from sales of third-party products through BEES Marketplace to reach 785 million USD in 2Q25.


Volumes

-1.9%


Volumes declined by 1.9% in 2Q25, with beer volumes down by 2.2% and non-beer volumes up by 0.3%.

Volumes declined by 2.0% in HY25, with beer volumes down by 2.3% and non-beer volumes flat.


Normalized EBITDA

+6.5%


Normalized EBITDA increased by 6.5% to 5 301 million USD in 2Q25, with a margin expansion of 116bps to 35.3%. Normalized EBITDA increased by 7.2% to 10 156 million USD in HY25, with a margin expansion of 166bps to 35.5%.


Underlying Profit

1 950 million USD


Underlying Profit was 1 950 million USD in 2Q25 compared to 1 811 million USD in 2Q24 and was 3 556 million USD in HY25 compared to 3 320 million USD in HY24.

Reported profit attributable to equity holders of AB InBev was 1 676 million USD in 2Q25 compared to 1 472 million USD in 2Q24, negatively impacted by non-underlying items, and was 3 824 million in HY25 compared to 2 564 million in HY24, positively impacted by non-underlying items.


Underlying EPS

0.98 USD


Underlying EPS increased by 8.7% to 0.98 USD in 2Q25, compared to 0.90 USD in 2Q24, and increased by 8.0% to 1.79 USD in HY25, compared to 1.66 USD in HY24.

On a constant currency basis, Underlying EPS increased by 17.4% in 2Q25 and by 18.7% in HY25.

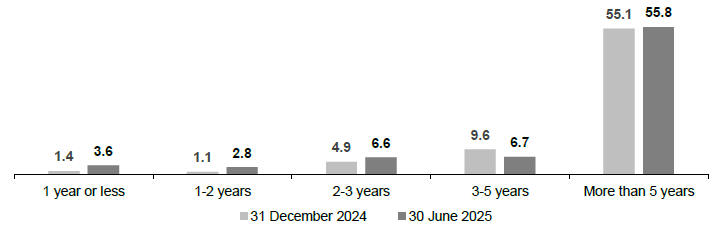
Net Debt to EBITDA

3.27x


Net debt to normalized EBITDA ratio was 3.27x at 30 June 2025 compared to 3.42x at 30 June 2024 and 2.89x at 31 December 24.

The 2025 Half Year Financial Report is available on our website at www.ab-inbev.com

1The enclosed information constitutes regulated information as defined in the Belgian Royal Decree of 14 November 2007 regarding the duties of issuers of financial instruments which have been admitted for trading on a regulated market. For important disclaimers and notes on the basis of preparation, please refer to page 16.


ab-inbev.com

      Press release – 31 July 2025 – 1


LOGO


Management comments


Consistent execution of our strategy delivered an EBITDA increase of 6.5%, continued margin expansion and high-single digit Underlying EPS growth

Our 2Q25 and HY25 results demonstrate the resilience of our strategy and ability of our business to deliver reliable compounding growth. In 2Q25, increased investments in our brands, expansion of our premium portfolio and innovation in balanced choices, combined with our revenue management decisions drove an acceleration in revenue growth, top- and bottom line increases in four of our five operating regions and continued growth in our overall portfolio brand power.

Revenue increased in 70% of our markets and by 3.0% overall, driven by a revenue per hl increase of 4.9%. Volumes declined by 1.9%, impacted by soft industries and performance in China and Brazil. While overall volumes were below potential, underlying momentum continued in the remainder of our footprint, with volume growth of 0.7% outside of these two countries. Top-line growth combined with disciplined resource allocation and overhead management drove an EBITDA increase of 6.5%, margin expansion of 116bps and Underlying EPS growth of 17.4% in constant currency and 8.7% in USD to reach 0.98 USD.

Progressing our strategic priorities

We continue to execute on and invest in three key strategic pillars to deliver consistent growth and long-term value creation.


LOGO


LOGO


LOGO


LOGO


Lead and grow the category:


Our overall portfolio brand power grew in 2Q25 driven by increased marketing investment and effectiveness. In addition, we estimate that we gained or maintained market share in 60% of our markets in HY25.


Digitize and monetize our ecosystem:


BEES Marketplace captured 785 million USD in GMV from sales of third-party products, a 63% increase versus 2Q24. Overall BEES GMV increased by 10% versus 2Q24, reaching 12.2 billion USD.


Optimize our business:


We continued to make progress on deleveraging with net debt to EBITDA reaching 3.27x as of 30 June 2025 versus 3.42x as of 30 June 2024. In HY25, we invested 5.0 billion USD in capex and sales and marketing while delivering free cash flow of approximately 1.4 billion USD, a 0.5 billion USD increase versus HY24.


LOGO


Lead and grow the category

Our performance across each of our category expansion levers drove an estimated increase in the percentage of legal drinking age consumers purchasing our portfolio across our key markets, with increases led by our megabrands and no-alcohol beer portfolio. We continue to invest in our megabrands and mega platforms with our sales and marketing investments increasing to $3.6 billion USD in HY25, a 4% increase versus HY24. According to the Kantar BrandZ 2025 report, our portfolio holds 8 of the top 10 most valuable beer brands in the world, with Corona and Budweiser #1 and #2 respectively. Our marketing effectiveness and creativity were recognized by being named the most effective marketer in the world by both Effies and the World Advertising Research Center for the 4th year in a row.


Core Superiority: Revenue of our mainstream portfolio increased by 0.4% in 2Q25, driven by high-single digit growth in Peru and mid-single digit growth in Colombia and Mexico.


ab-inbev.com


Press release – 31 July 2025 – 2


LOGO


Premiumization: Corona led our premium performance in 2Q25, increasing revenue by 7.7% outside of Mexico with double-digit volume growth in more than 30 markets. Our overall above core beer portfolio delivered a 5.1% revenue increase.


Balanced Choices: Growth in 2Q25 was led by our no-alcohol beer portfolio which delivered a 33% revenue increase and is estimated to have gained share of no-alcohol beer across our footprint, led by Corona Cero which nearly doubled volumes versus 2Q24. Our overall balanced choices portfolio of low carb, sugar free, gluten free and no- and low-alcohol beer brands delivered a revenue increase of 7.9%.


Beyond Beer: The momentum of our Beyond Beer portfolio continued in 2Q25, led by the double-digit revenue growth of Cutwater in the US and Beats in Brazil which drove an overall revenue increase of 6.4%.


LOGO


Digitize and monetize our ecosystem


Digitizing our relationships with more than 6 million customers globally: As of 30 June 2025, BEES was live in 28 markets with 71% of our revenues captured through B2B digital platforms. In 2Q25, BEES captured 12.2 billion USD in GMV, growth of 10% versus 2Q24.


Monetizing our route-to-market: BEES Marketplace GMV growth accelerated in 2Q25, growing by 63% versus 2Q24 to reach 785 million USD from sales of third-party products.


Leading the way in DTC solutions: Our omnichannel DTC ecosystem of digital and physical products generated revenue of approximately 335 million USD in 2Q25. Our DTC megabrands, Zé Delivery, TaDa Delivery and PerfectDraft, generated 18.2 million e-commerce orders and delivered 134 million USD in revenue this quarter, representing 6% growth versus 2Q24.


LOGO


Optimize our business


Maximizing value creation: EBITDA grew by 6.5% and EBIT by 10.2% in 2Q25 as disciplined resource allocation and overhead management drove continued margin expansion. The combination of the optimization of our net finance costs and net working capital, and improved capex efficiency delivered free cash flow of approximately 1.4 billion USD in HY25, a 0.5 billion USD improvement versus HY24. We continued to progress on our deleveraging with our net debt to EBITDA ratio reaching 3.27x versus 3.42x as of 30 June 2024. As is typical, the ratio increased versus FY24 due to the seasonality of our cash flow generation and cash outflow for our increased full year dividend and share buyback program.


Advancing our sustainability priorities: In Climate Action, our Scopes 1 and 2 emissions per hectoliter of production was 4.30 kgCO2e/hl in HY25, a reduction of 47% versus our 2017 baseline. In Water Stewardship, our water use efficiency ratio improved to 2.40 hl per hl in HY25 versus 2.50 hl per hl in HY24.

Delivering reliable compounding growth

In the first half of this year, our business delivered an EBITDA increase of 7.2% with margin expansion of 166bps and Underlying EPS growth of 8.0% in USD. We made strategic choices across revenue management, resource allocation, and increased sales and marketing investments to lead and grow the category. We continued to make progress on deleveraging while paying an increased dividend to our shareholders and completing our 2 billion USD share buyback program. Our footprint has structural tailwinds for long-term volume growth with favorable demographics, ongoing economic development and opportunities to increase category participation. Our consistent performance and the fundamental strengths of our business reinforce our confidence in our ability to deliver our FY25 outlook and long-term value creation.


ab-inbev.com


Press release – 31 July 2025 – 3


LOGO


2025 Outlook


(i)

Overall Performance: We expect our EBITDA to grow in line with our medium-term outlook of between 4-8%. The outlook for FY25 reflects our current assessment of inflation and other macroeconomic conditions.


(ii)

Net Finance Costs: Net pension interest expenses and accretion expenses are expected to be in the range of 190 to 220 million USD per quarter, depending on currency and interest rate fluctuations. We expect the average gross debt coupon in FY25 to be approximately 4%.


(iii)

Effective Tax Rate (ETR): We expect the normalized ETR in FY25 to be in the range of 26% to 28%. The ETR outlook does not consider the impact of potential future changes in legislation.


(iv)

Net Capital Expenditure: We expect net capital expenditure of between 3.5 and 4.0 billion USD in FY25.


ab-inbev.com


Press release – 31 July 2025 – 4


LOGO


 Figure 1. Consolidated performance


 in USD Mio, except EPS in USD per share and Volumes in thousand hls

   2Q24      2Q25      Organic
growth
 

 Volumes

     146 302      143 347      (1.9)%  

Beer

     127 242      124 778      (2.2)%  

Non-Beer

     19 059      18 569      0.3%

 Revenue

     15 333      15 004      3.0%

 Gross profit

     8 567      8 446      4.0%

 Gross margin

     55.9%      56.3%      55bps  

 Normalized EBITDA

     5 302      5 301      6.5%

 Normalized EBITDA margin

     34.6%      35.3%      116bps  

 Normalized EBIT

     3 905      4 013      10.2%

 Normalized EBIT margin

     25.5%      26.7%      179bps  
                            

 Profit attributable to equity holders of AB InBev

     1 472      1 676         

 Underlying Profit

     1 811      1 950         
                            

 Basic EPS

     0.73      0.84         

 Underlying EPS

     0.90      0.98         
     HY24      HY25      Organic
growth
 

 Volumes

     285 837      279 615      (2.0)%  

Beer

     246 767      241 390      (2.3)%  

Non-Beer

     39 070      38 225      0.0%

 Revenue

     29 880      28 632      2.3%

 Gross profit

     16 461      16 029      4.6%

 Gross margin

     55.1%      56.0%      127bps  

 Normalized EBITDA

     10 288      10 156      7.2%

 Normalized EBITDA margin

     34.4%      35.5%      166bps  

 Normalized EBIT

     7 547      7 601      10.3%

 Normalized EBIT margin

     25.3%      26.5%      198bps  
                            

 Profit attributable to equity holders of AB InBev

     2 564      3 824         

 Underlying Profit

     3 320      3 556         
                            

 Basic EPS

     1.28      1.92         

 Underlying EPS

     1.66      1.79         


 Figure 2. Volumes


 in thousand hls

   2Q24      Scope      Organic
growth
     2Q25      Organic growth  
                             Total      Beer  

 North America

     22 639      (330)        68      22 376      0.3%        (0.0)%  

 Middle Americas

     38 381      -        441      38 822      1.1%        1.5%  

 South America

     35 969      -        (1 770)        34 199      (4.9)%        (6.8)%  

 EMEA

     23 852      112      208      24 172      0.9%        0.6%  

 Asia Pacific

     25 399      -        (1 683)        23 716      (6.6)%        (6.5)%  

 Global Export and Holding Companies

     62      (6)        6      62      10.4%        10.4%  

 AB InBev Worldwide

     146 302      (224)        (2 730)        143 347      (1.9)%        (2.2)%  
     HY24      Scope      Organic
growth
     HY25      Organic growth  
                             Total      Beer  

 North America

     43 992      (474)        (1 299)        42 218      (3.0)%        (3.2)%  

 Middle Americas

     74 072      -        (169)        73 903      (0.2)%        0.1%  

 South America

     76 315      -        (1 226)        75 089      (1.6)%        (2.5)%  

 EMEA

     44 882      77      (35)        44 924      (0.1)%        (0.4)%  

 Asia Pacific

     46 444      (93)        (2 987)        43 365      (6.4)%        (6.3)%  

 Global Export and Holding Companies

     132      (9)        (7)        116      (5.7)%        (5.7)%  

 AB InBev Worldwide

     285 837      (498)        (5 724)        279 615      (2.0)%        (2.3)%  


ab-inbev.com


Press release – 31 July 2025 – 5


LOGO


Key Markets Performance


United States: Michelob Ultra momentum drove continued market share gain and top- and bottom-line growth


Operating performance:


o

2Q25: Revenue grew by 2.1% with revenue per hl increasing by 1.8% driven by revenue management initiatives and premiumization. Sales-to-retailers (STRs) declined by 2.1%, estimated to have outperformed a soft industry. Sales-to-wholesalers (STWs) grew by 0.2%. EBITDA increased by 4.2% driven by top-line growth and productivity initiatives, even as we continued to increase our marketing investments to fuel momentum.


o

HY25: Revenue declined by 1.5%, with revenue per hl increasing by 1.8%. STRs declined by 3.5% and STWs were down by 3.2%, and we expect our STRs and STWs to converge on a full year basis. EBITDA increased by 1.4%.


Commercial highlights: Increased investment and consistent execution drove our momentum with our portfolio continuing to gain market share of the beer industry, according to Circana. Our performance was led by Michelob Ultra and Busch Light, which continued to be the #1 and #2 volume share gainers in the industry. We are the leaders in no-alcohol beer, with our portfolio growing volumes in the high-twenties, and we are leading the industry in innovation with Michelob Ultra Zero and Busch Light Apple the top 2 innovations in the beer industry year-to-date. In Beyond Beer, our spirits-based RTD portfolio delivered low-teens volume growth, led by Cutwater and Nütrl.

Mexico: Continued momentum drove mid-single digit top- and bottom-line growth


Operating performance:


o

2Q25: Revenue increased by mid-single digits, with low-single digit revenue per hl growth driven by revenue management initiatives. Volumes increased by low-single digits, slightly outperforming the industry which benefitted from Easter shipment phasing in April but was negatively impacted by adverse weather in June. EBITDA grew by mid-single digits.


o

HY25: Revenue grew by mid-single digits with revenue per hl growth of mid-single digits and volumes increasing by low-single digits. EBITDA grew by high-single digits with margin expansion.


Commercial highlights: Our performance was led by our above core beer portfolio, which grew revenue by high-single digits driven by Modelo and Michelob Ultra, while our core beer brands delivered mid-single digit revenue growth. We are leading the growth in no-alcohol beer with Corona Cero growing volume by strong double-digits and now the #1 no-alcohol beer brand in the country, according to Nielsen. We continued to progress our digital initiatives, with BEES Marketplace growing GMV by 30% versus 2Q24 and our digital DTC platform, TaDa Delivery, fulfilling more than 1.2 million orders, a 6% increase versus 2Q24.

Colombia: Record high volume drove high single-digit top- and bottom-line growth


Operating performance:


o

2Q25: Revenue increased by high-single digits with mid-single digit revenue per hl growth, driven by revenue management initiatives. Volumes grew by low-single digits, with our portfolio estimated to have gained share of total alcohol. EBITDA grew by high-single digits with margin expansion.


ab-inbev.com


Press release – 31 July 2025 – 6


LOGO


o

HY25: Revenue grew by mid-single digits with mid-single digit revenue per hl growth. Volumes increased by low-single digits. EBITDA grew by low-teens with margin expansion.


Commercial highlights: Our above core beer brands led our performance, delivering mid-single digit volume growth and driving record high second quarter volumes. Our core beer portfolio delivered a mid-single digit revenue increase driven by Aguila.

Brazil: Revenue declined by 1.9% impacted by volume; disciplined revenue and cost management drove mid-single digit bottom-line growth with margin expansion


Operating performance:


o

2Q25: Revenue declined by 1.9% with revenue per hl growth of 4.9% driven by revenue management initiatives and premiumization. Total volumes declined by 6.5%, with beer volume decreasing by 9.0%, cycling a strong performance in 2Q24 and underperforming a soft industry, which was primarily impacted by adverse weather. Non-beer volumes grew by 0.3%. EBITDA increased by 5.3% with margin expansion of 216bps as productivity initiatives and SG&A efficiencies more than offset transactional FX headwinds.


o

HY25: Revenue grew by 1.5% with revenue per hl growth of 4.0%. Total volumes declined by 2.4% with beer volumes declining by 4.0% and non-beer volumes increasing by 1.9%. EBITDA increased by 9.7% with margin expansion of 254bps.


Commercial highlights: Our premium and super premium beer brands led our performance in 2Q25, delivering mid-teens volume growth, driven by Corona and Original. Our portfolio of balanced choices drove incremental growth with volumes of our no-alcohol beer brands increasing by mid-teens and Stella Artois Gluten Free more than doubling. We continue to invest to increase the brand power of our portfolio, mainstream volumes however declined this quarter, impacted by a soft industry. Non-beer performance was driven by our low- and no-sugar portfolio, which grew volumes in the low-thirties. We continued to progress our digital initiatives, with BEES Marketplace GMV more than doubling versus 2Q24, and our digital DTC platform, Zé Delivery, reaching 5.3 million monthly active users.

Europe: Improved industry, continued premiumization and margin recovery delivered top- and bottom-line growth


Operating performance:


o

2Q25: Revenue grew by low-single digits with low-single digit revenue per hl growth driven by continued premiumization. Volumes were flat, supported by estimated market share gains in 5 of our 6 key markets and an improved industry as weather normalized. EBITDA grew by low-single digits with margin recovery.


o

HY25: Revenue was flattish with low-single digit revenue per hl growth. Volume declined by low-single digits, estimated to have outperformed the industry in 5 of our 6 key markets. EBITDA grew by mid-single digits with margin recovery.


Commercial highlights: Industry volumes in our footprint were estimated to be flattish this quarter, improving sequentially versus 1Q25, with beer gaining share of total alcohol. We continued to premiumize our portfolio, with our premium and super premium portfolio making up 62% of our 2Q25 revenue. Our performance was driven by our megabrands, led by Corona, which grew volume by double-digits, and Stella Artois, which successfully activated the Perfect Serve campaign at the Roland Garros and Wimbledon tennis tournaments. Our no-alcohol beer portfolio grew volumes by 31%, led by Corona Cero which delivered strong double-digit volume growth.


ab-inbev.com


Press release – 31 July 2025 – 7


LOGO


South Africa: Continued momentum and market share gain delivered mid-single digit top- and bottom-line growth


Operating performance:


o

2Q25: Revenue increased by mid-single digits with revenue per hl growth of low-single digits. Volumes grew by mid-single digits, estimated to have outperformed the industry in both beer and Beyond Beer which was supported by Easter shipment phasing. EBITDA grew by mid-single digits with margin expansion.


o

HY25: Revenue increased by mid-single digits with revenue per hl growth of low-single digits. Volumes grew by low-single digits, estimated to have outperformed the industry in both beer and Beyond Beer. EBITDA grew by mid-single digits.


Commercial highlights: Performance in 2Q25 was led by our premium and super premium beer brands, which grew volumes by mid-teens driven by Corona and Stella Artois, and the continued strength of our core brands which delivered low-single digit volume growth. In Beyond Beer, our portfolio grew volumes by mid-single digits.

China: Revenue declined by 6.2% impacted by volume performance


Operating performance:


o

2Q25: Volumes declined by 7.4%, underperforming the industry according to our estimates, with our performance impacted by continued weakness in our key regions and channels. Revenue per hl increased by 1.3% driven by positive brand mix, resulting in a revenue decline of 6.2%. EBITDA declined by 3.4% as top-line performance was partially offset by productivity initiatives and SG&A efficiencies while we continued to increase marketing investments.


o

HY25: Revenue declined by 9.4% with revenue per hl declining by 1.3% and volumes decreasing by 8.2%. EBITDA declined by 9.6%.


Commercial highlights: Industry volumes were estimated to have declined by low-single digits versus 2Q24. We remain focused on executing our strategy, centered on premiumization, channel and geographic expansion, and digital transformation. We continued to strengthen our execution in the in-home channel, increasing our marketing investments and accelerating our channel expansion. In 2Q25, our marketing activations included a new integrated campaign for Budweiser with the FIFA Club World Cup and updated brand imagery for Harbin. The BEES platform is present in more than 320 cities, enabling us to optimize our route to consumer and strengthen our customer relationships.


ab-inbev.com


Press release – 31 July 2025 – 8


LOGO


Highlights from our other markets


Canada: Volumes grew by low-single digits this quarter, estimated to have outperformed an improved beer industry. Revenue grew by low-single digits with low-single digit revenue per hl growth. Our performance was led by Michelob Ultra, Busch and Corona which were estimated to be three of the top five volume share gainers in the industry.


Peru: Revenue grew by high-single digits in 2Q25 with mid-single digit revenue per hl growth, driven by revenue management initiatives. Volumes grew by mid-single digits, as the beer industry returned to growth supported by normalized weather and Easter shipment phasing.


Ecuador: Revenue grew by mid-single digits in 2Q25 with volumes increasing by low-single digits. Growth was led by our above core beer brands which increased volume by high-teens.


Argentina: Volume trends improved sequentially, declining by low-single digits this quarter. Beer volumes grew by low-single digits as the industry returned to growth, despite overall consumer demand continuing to be impacted by inflationary pressures. Since 1Q24, the definition of organic revenue growth in Argentina has been amended to cap the price growth to a maximum of 2% per month. Revenue grew by mid-twenties on this basis.


Africa excluding South Africa: In Nigeria, revenue grew by strong double-digits in 2Q25, driven by revenue management initiatives in a highly inflationary environment. Beer volumes declined by low-teens, impacted by a soft industry and cycling a strong performance in 2Q24. In our other markets in Africa, we grew volume in aggregate by low-single digits, driven by Tanzania and Mozambique.


South Korea: Revenue declined by high-single digits in 2Q25 with low-single digit revenue per hl growth driven by revenue management initiatives. While we continued to gain market share in both the on-premise and in-home channels, volumes were negatively impacted by shipment phasing ahead of our April price increase and declined by high-single digits.


ab-inbev.com


Press release – 31 July 2025 – 9


LOGO


Consolidated Income Statement


 Figure 3. Consolidated income statement


 in USD Mio

      2Q24         2Q25     Organic
growth
 

 Revenue

     15 333     15 004     3.0%

 Cost of sales

     (6 766     (6 558     (1.7)%  

 Gross profit

     8 567     8 446     4.0%

 SG&A

     (4 813     (4 624     0.0%

 Other operating income/(expenses)

     151     191     35.2%

 Normalized EBIT

     3 905     4 013     10.2%

 Non-underlying items above EBIT

     (90     (45        

 Net finance income/(expense)

     (1 170     (1 062        

 Non-underlying net finance income/(expense)

     (221     (234        

 Share of results of associates

     79     84        

 Non-underlying share of results of associates

     -        9        

 Income tax expense

     (752     (741        

 Profit

     1 751     2 024        

 Profit attributable to non-controlling interest

     279     347        

 Profit attributable to equity holders of AB InBev

     1 472     1 676        
                          

 Normalized EBITDA

     5 302     5 301     6.5%

 Underlying Profit

     1 811     1 950        
        HY24         HY25     Organic
growth
 

 Revenue

     29 880     28 632     2.3%

 Cost of sales

     (13 419     (12 602     0.7%

 Gross profit

     16 461     16 029     4.6%

 SG&A

     (9 248     (8 812     (0.6)%  

 Other operating income/(expenses)

     334     383     20.8%

 Normalized EBIT

     7 547     7 601     10.3%

 Non-underlying items above EBIT

     (119     (94        

 Net finance income/(expense)

     (2 357     (2 046        

 Non-underlying net finance income/(expense)

     (530     368        

 Share of results of associates

     137     135        

 Non-underlying share of results of associates

     104     9        

 Income tax expense

     (1 546     (1 404        

 Profit

     3 236     4 568        

 Profit attributable to non-controlling interest

     672     744        

 Profit attributable to equity holders of AB InBev

     2 564     3 824        
                          

 Normalized EBITDA

     10 288     10 156     7.2%

 Underlying Profit

     3 320     3 556        


ab-inbev.com


Press release – 31 July 2025 – 10


LOGO


Non-underlying items above EBIT & Non-underlying share of results of associates


 Figure 4. Non-underlying items above EBIT & Non-underlying share of results of associates


 in USD Mio

   2Q24      2Q25     HY24     HY25  

 Restructuring

     (28)        (35     (59     (47

 Business and asset disposal (incl. impairment losses)

     (62)        (10     (60     (47

 Non-underlying items in EBIT

     (90)        (45     (119     (94

 Non-underlying share of results of associates

     -        9     104     9

Normalized EBIT excludes negative non-underlying items of 45 million USD in 2Q25 and 94 million USD in HY25. Non-underlying share of results from associates of HY24 included the impact from our associate Anadolu Efes’ adoption of IAS 29 hyperinflation accounting on their 2023 results.

Net finance income/(expense)


 Figure 5. Net finance income/(expense)


 in USD Mio

   2Q24      2Q25      HY24      HY25  

 Net interest expense

     (721)        (663)        (1 399)        (1 284)  

 Accretion expense and interest on pensions

     (214)        (184)        (427)        (351)  

 Other financial results

     (235)        (214)        (530)        (410)  

 Net finance income/(expense)

     (1 170)        (1 062)        (2 357)        (2 046)  

Non-underlying net finance income/(expense)


 Figure 6. Non-underlying net finance income/(expense)


 in USD Mio

   2Q24     2Q25     HY24      HY25  

 Mark-to-market

     (264     (263     (507)        339

 Gain/(loss) on bond redemption and other

     43     29     (23)        29

 Non-underlying net finance income/(expense)

     (221     (234     (530)        368

Non-underlying net finance cost in 2Q25 includes mark-to-market losses on derivative instruments entered into in order to hedge our share-based payment programs and shares issued in relation to the combination with Grupo Modelo and SAB.

The number of shares covered by the hedging of our share-based payment program, the deferred share instrument and the restricted shares are shown below, together with the opening and closing share prices.


 Figure 7. Non-underlying equity derivative instruments


     2Q24      2Q25      HY24      HY25  

 Share price at the start of the period (Euro)

     56.46      56.92      58.42      48.25

 Share price at the end of the period (Euro)

     54.12      58.24      54.12      58.24

 Number of equity derivative instruments at the end of the period (millions)

     100.5      100.5      100.5      100.5

Income tax expense


 Figure 8. Income tax expense


 in USD Mio

   2Q24      2Q25      HY24      HY25  

 Income tax expense

     752      741      1 546      1 404

 Effective tax rate

     31.0%      27.7%      34.1%      24.1%

 Normalized effective tax rate

     27.4%      25.3%      27.2%      25.6%

The HY25 effective tax rate was positively impacted by non-taxable gains from derivatives related to the hedging of share-based payment programs and of the shares issued in a transaction related to the combinations with Grupo Modelo and SAB, while the HY24 effective tax rate was negatively impacted by non-deductible losses from these derivatives. Furthermore, HY24 effective tax rate included 133 million USD of non-underlying tax expense.

The decrease in Normalized ETR in 2Q25 compared to 2Q24 and HY25 compared to HY24 is driven mainly by country mix.


ab-inbev.com


Press release – 31 July 2025 – 11


LOGO


Underlying EPS


 Figure 9. Underlying EPS


 in USD per share, except number of shares in million

   2Q24     2Q25     HY24     HY25  

 Normalized EBITDA

     2.64     2.67     5.13     5.11

 Depreciation, amortization and impairment

     (0.70     (0.65     (1.37     (1.28

 Normalized EBIT

     1.95     2.02     3.76     3.82

 Net finance income/(expense)

     (0.58     (0.53     (1.18     (1.03

 Income tax expense

     (0.37     (0.38     (0.70     (0.71

 Associates & non-controlling interests

     (0.10     (0.13     (0.27     (0.31

 Hyperinflation impacts

     0.01     0.01     0.04     0.02

 Underlying EPS

     0.90     0.98     1.66     1.79

 Weighted average number of ordinary and restricted shares

     2 005     1 989     2 005     1 989


ab-inbev.com


Press release – 31 July 2025 – 12


LOGO


Reconciliation of IFRS and Non-IFRS Financial Measures


Profit attributable to equity holders and Underlying Profit


 Figure 10. Underlying Profit


 in USD Mio

   2Q24      2Q25      HY24      HY25  

 Profit attributable to equity holders of AB InBev

     1 472      1 676      2 564      3 824

 Net impact of non-underlying items on profit

     313      261      675      (305

 Hyperinflation impacts

     26      14      81      37

 Underlying Profit

     1 811      1 950      3 320      3 556

Basic and Underlying EPS


 Figure 11. Basic and Underlying EPS


 in USD per share, except number of shares in million

   2Q24      2Q25      HY24      HY25  

 Basic EPS

     0.73      0.84      1.28      1.92

 Net impact of non-underlying items

     0.16      0.13      0.34      (0.15

 Hyperinflation impacts

     0.01      0.01      0.04      0.02

 Underlying EPS

     0.90      0.98      1.66      1.79

 FX translation impact

     -        0.08      -        0.17

 Underlying EPS in constant currency

     0.90      1.06      1.66      1.96

 Weighted average number of ordinary and restricted shares

     2 005      1 989      2 005      1 989

Profit attributable to equity holders and Normalized EBITDA


 Figure 12. Reconciliation of Normalized EBITDA to Profit attributable to equity holders of AB InBev


 in USD Mio

   2Q24     2Q25     HY24     HY25  

 Profit attributable to equity holders of AB InBev

     1 472     1 676     2 564     3 824

 Non-controlling interests

     279     347     672     744

 Profit

     1 751     2 024     3 236     4 568

 Income tax expense

     752     741     1 546     1 404

 Share of result of associates

     (79     (84     (137     (135

 Non-underlying share of results of associates

     -       (9     (104     (9

 Net finance (income)/expense

     1 170     1 062     2 357     2 046

 Non-underlying net finance (income)/expense

     221     234     530     (368

 Non-underlying items above EBIT (incl. impairment losses)

     90     45     119     94

 Normalized EBIT

     3 905     4 013     7 547     7 601

 Depreciation, amortization and impairment

     1 397     1 288     2 741     2 555

 Normalized EBITDA

     5 302     5 301     10 288     10 156

Normalized EBITDA, Normalized EBIT and Underlying Profit are non-IFRS financial measures used by AB InBev to reflect the company’s underlying performance. Underlying EPS and constant currency Underlying EPS are non-IFRS financial measures that AB InBev believes are useful to investors because they facilitate comparisons of EPS from period to period.

Normalized EBITDA is calculated by adjusting profit attributable to equity holders of AB InBev to exclude: (i) non-controlling interest; (ii) income tax expense; (iii) share of results of associates; (iv) non-underlying share of results of associates; (v) net finance income or cost; (vi) non-underlying net finance income or cost; (vii) non-underlying items above EBIT; and (viii) depreciation, amortization and impairment.

Underlying Profit is calculated by adjusting profit attributable to equity holders of AB InBev to exclude: (i) non-underlying items and (ii) hyperinflation impacts. Underlying EPS is calculated as Underlying Profit divided by the weighted average number of ordinary and restricted shares. Constant currency Underlying EPS is calculated as Underlying EPS excluding the effects of foreign currency translation by translating current period figures using the exchange rates from the same period in the prior year.

Normalized EBITDA, Normalized EBIT and Underlying Profit are not accounting measures under IFRS and should not be considered as an alternative to profit attributable to equity holders as a measure of operational performance, or an alternative to cash flow as a measure of liquidity. Underlying EPS and constant currency Underlying EPS are not accounting measures under IFRS and should not be considered as alternatives to earnings per share as a measure of operating performance on a per share basis. These non-IFRS financial measures do not have a standard calculation method and AB InBev’s definition of Normalized EBITDA, Normalized EBIT, Underlying Profit, Underlying EPS and constant currency Underlying EPS may not be comparable to that of other companies.


ab-inbev.com


Press release – 31 July 2025 – 13


LOGO


Cash Flows and Financial Position


 Figure 13. Cash Flow Statement (million USD)

       
       HY24      HY25  

 Operating activities


 Profit of the period

       3 236      4 568

 Interest, taxes and non-cash items included in profit

       7 588      5 736

 Cash flow from operating activities before changes in working capital and use of provisions

       10 824      10 304

 Change in working capital

       (4 170      (3 655

 Pension contributions and use of provisions

       (251      (278

 Interest and taxes (paid)/received

       (3 958      (3 801

 Dividends received

       123      135

 Cash flow from/(used in) operating activities

       2 568      2 704

 Investing activities


 Net capex

       (1 684      (1 350

 Sale/(acquisition) of subsidiaries, net of cash

       (19      (4

 Net proceeds from sale/(acquisition) of other assets

       (29      47

 Cash flow from/(used in) investing activities

       (1 732      (1 306

 Financing activities


 Net (repayments of) / proceeds from borrowings

       1 124      68

 Dividends paid

       (2 142      (3 147

 Share buyback

       (838      (1 901

 Payment of lease liabilities

       (406      (354

 Derivative financial instruments

       (172      114

 Sale/(acquisition) of non-controlling interests

       (414      (314

 Other financing cash flows

       (465      (303

 Cash flow from/(used in) financing activities

       (3 313      (5 837

 Net increase/(decrease) in cash and cash equivalents

       (2 476      (4 438

Our free cash flow (defined as cash flow from operating activities less net capex) increased by 470 million USD to reach 1 355 million USD in HY25. Our cash and cash equivalents decreased by 4 438 million USD in HY25, compared to a decrease of 2 476 million USD in HY24, with the following movements:


Our cash flow from operating activities reached 2 704 million USD in HY25 compared to 2 568 million USD in HY24. The increase was driven by changes in working capital for HY25 compared to HY24. Changes in working capital in the first half of 2025 and 2024 reflect higher working capital levels at the end of June than at year-end as a result of seasonality.


Our cash outflow from investing activities was 1 306 million USD in HY25 compared to a cash outflow of 1 732 million USD in HY24. The decrease in the cash outflow was mainly due to lower net capital expenditures in HY25 compared to HY24. Out of the total HY25 capital expenditures, approximately 34% was used to improve the company’s production facilities while 51% was used for logistics and commercial investments and 15% was used for the purchase of hardware and software and improving administrative capabilities.


Our cash outflow from financing activities amounted to 5 837 million USD in HY25, as compared to a cash outflow of 3 313 million USD in HY24. The increase in the cash outflow versus HY24 was primarily driven by the completion of our 2 billion USD share buyback program, higher dividends paid and lower debt issuance in 2025 compared to 2024.


ab-inbev.com


Press release – 31 July 2025 – 14


LOGO


Our net debt increased to 68.1 billion USD as of 30 June 2025 from 60.6 billion USD as of 31 December 2024. Our net debt to normalized EBITDA ratio was 3.27x as of 30 June 2025. Our optimal capital structure is a net debt to normalized EBITDA ratio of around 2x.

We continue to proactively manage our debt portfolio. After bond repurchases of 3 billion USD and issuances of 3 billion Euro in HY25, 98% of our bond portfolio holds a fixed-interest rate, 50% is denominated in currencies other than USD and maturities are well-distributed across the next several years.

As of 30 June 2025, we had total liquidity of 17.5 billion USD, which consisted of 10.1 billion USD available under committed long-term credit facilities and 7.4 billion USD of cash, cash equivalents and short-term investments in debt securities less bank overdrafts.


Figure 14. Terms and debt repayment schedule as of 30 June 2025 (billion USD)


LOGO


ab-inbev.com


Press release – 31 July 2025 – 15


LOGO


Notes


To facilitate the understanding of AB InBev’s underlying performance, the analyses of growth, including all comments in this press release, unless otherwise indicated, are based on organic growth and normalized numbers. In other words, financials are analyzed eliminating the impact of changes in currencies on translation of foreign operations, and scope changes. Since 1Q24, the definition of organic revenue growth has been amended to cap the price growth in Argentina to a maximum of 2% per month (26.8% year-over-year). Corresponding adjustments are made to all income statement related items in the organic growth calculations through scope changes. Scope changes also represent the impact of acquisitions and divestitures, the start or termination of activities or the transfer of activities between segments, curtailment gains and losses and year over year changes in accounting estimates and other assumptions that management does not consider as part of the underlying performance of the business. The organic growth of our global brands, Budweiser, Stella Artois, and Corona excludes exports to Australia for which a perpetual license was granted to a third party upon disposal of the Australia operations in 2020. All references per hectoliter (per hl) exclude US non-beverage activities. Whenever presented in this document, all performance measures (EBITDA, EBIT, profit, tax rate, EPS) are presented on a “normalized” basis, which means they are presented before non-underlying items. Non-underlying items are either income or expenses which do not occur regularly as part of the normal activities of the Company. They are presented separately because they are important for the understanding of the underlying sustainable performance of the Company due to their size or nature. Normalized measures are additional measures used by management and should not replace the measures determined in accordance with IFRS as an indicator of the Company’s performance. We are reporting the results from Argentina applying hyperinflation accounting since 3Q18. The IFRS rules (IAS 29) require us to restate the year-to-date results for the change in the general purchasing power of the local currency, using official indices before converting the local amounts at the closing rate of the period. In 2Q25, we reported a negative impact from hyperinflation accounting on the profit attributable to equity holders of AB InBev of (14) million USD. The impact in 2Q25 Basic EPS was (0.01) USD. Values in the figures and annexes may not add up, due to rounding. 2Q25 and HY25 EPS is based upon a weighted average of 1 989 million shares compared to a weighted average of 2 005 million shares for 2Q24 and HY24.


Legal disclaimer

This release contains “forward-looking statements”. These statements are based on the current expectations and views of future events and developments of the management of AB InBev and are naturally subject to uncertainty and changes in circumstances. The forward-looking statements contained in this release include statements other than historical facts and include statements typically containing words such as “will”, “may”, “should”, “believe”, “intends”, “expects”, “anticipates”, “targets”, “ambition”, “estimates”, “likely”, “foresees” and words of similar import. All statements other than statements of historical facts are forward-looking statements. You should not place undue reliance on these forward-looking statements, which reflect the current views of the management of AB InBev, are subject to numerous risks and uncertainties about AB InBev and are dependent on many factors, some of which are outside of AB InBev’s control. There are important factors, risks and uncertainties that could cause actual outcomes and results to be materially different, including, but not limited to the risks and uncertainties relating to AB InBev that are described under Item 3.D of AB InBev’s Annual Report on Form 20-F filed with the SEC on 12 March 2025. Many of these risks and uncertainties are, and will be, exacerbated by any further worsening of the global business and economic environment, including as a result of foreign currency exchange rate fluctuations and ongoing geopolitical conflicts. Other unknown or unpredictable factors could cause actual results to differ materially from those in the forward-looking statements. The forward-looking statements should be read in conjunction with the other cautionary statements that are included elsewhere, including AB InBev’s most recent Form 20-F and other reports furnished on Form 6-K, and any other documents that AB InBev has made public. Any forward-looking statements made in this communication are qualified in their entirety by these cautionary statements and there can be no assurance that the actual results or developments anticipated by AB InBev will be realized or, even if substantially realized, that they will have the expected consequences to, or effects on, AB InBev or its business or operations. Except as required by law, AB InBev undertakes no obligation to publicly update or revise any forward-looking statements, whether as a result of new information, future events or otherwise. The half year 2025 (HY25) financial data set out in Figure 1 (except for the volume information), Figures 3 to 6, 8, 10, 12 and 13 of this press release have been extracted from the group’s unaudited condensed consolidated interim financial statements as of and for the six months ended 30 June 2025, which have been reviewed by our statutory auditors PwC Bedrijfsrevisoren BV /Réviseurs d’Entreprises SRL in accordance with the standards of the Public Company Accounting Oversight Board (United States). The second quarter 2025 (2Q25) financial data set out in Figure 1 (except for the volume information), Figures 3 to 6, 8, 10, 12 and 13, and the financial data included in Figures 7, 9, 11 and 14 of this press release have been extracted from the underlying accounting records as of and for the six months ended 30 June 2025. References in this document to materials on our websites, such as www.ab-inbev.com, are included as an aid to their location and are not incorporated by reference into this document.


ab-inbev.com


Press release – 31 July 2025 – 16


LOGO


Conference call and webcast


Investor Conference call and webcast on Thursday, 31 July 2025:

3.00pm Brussels / 2.00pm London / 9.00am New York

Registration details:

Webcast (listen-only mode):

AB InBev 2Q25 Results Webcast

To join by phone, please use one of the following two phone numbers:

Toll-Free: +1-877-407-8029

Toll: +1-201-689-8029


Investors


Media

Shaun Fullalove


Media Relations

E-mail: shaun.fullalove@ab-inbev.com


E-mail: media.relations@ab-inbev.com

Ekaterina Baillie


E-mail: ekaterina.baillie@ab-inbev.com


Cyrus Nentin


E-mail: cyrus.nentin@ab-inbev.com


About AB InBev

Anheuser-Busch InBev (AB InBev) is a publicly traded company (Euronext: ABI) based in Leuven, Belgium, with secondary listings on the Mexico (MEXBOL: ANB) and South Africa (JSE: ANH) stock exchanges and with American Depositary Receipts on the New York Stock Exchange (NYSE: BUD). As a company, we dream big to create a future with more cheers. We are always looking to serve up new ways to meet life’s moments, move our industry forward and make a meaningful impact in the world. We are committed to building great brands that stand the test of time and to brewing the best beers using the finest ingredients. Our diverse portfolio of well over 500 beer brands includes global brands Budweiser®, Corona®, Stella Artois® and Michelob Ultra®; multi-country brands Beck’s®, Hoegaarden® and Leffe®; and local champions such as Aguila®, Antarctica®, Bud Light®, Brahma®, Cass®, Castle®, Castle Lite®, Cristal®, Harbin®, Jupiler®, Modelo Especial®, Quilmes®, Victoria®, Sedrin®, and Skol®. Our brewing heritage dates back more than 600 years, spanning continents and generations. From our European roots at the Den Hoorn brewery in Leuven, Belgium. To the pioneering spirit of the Anheuser & Co brewery in St. Louis, US. To the creation of the Castle Brewery in South Africa during the Johannesburg gold rush. To Bohemia, the first brewery in Brazil. Geographically diversified with a balanced exposure to developed and developing markets, we leverage the collective strengths of approximately 144 000 colleagues based in nearly 50 countries worldwide. For 2024, AB InBev’s reported revenue was 59.8 billion USD (excluding JVs and associates).


ab-inbev.com


Press release – 31 July 2025 – 17


LOGO


Annex 1: Segment reporting (2Q)


 AB InBev Worldwide

   2Q24     Scope     Currency
Translation
    Organic
Growth
    2Q25     Organic
Growth
 

 Volumes

     146 302     (224     -       (2 730     143 347     (1.9)%  

 Revenue

     15 333     (100     (688     458     15 004     3.0%

 Cost of sales

     (6 766     25     298     (115     (6 558     (1.7)%  

 Gross profit

     8 567     (75     (389     343     8 446     4.0%

 SG&A

     (4 813     1     186     2     (4 624     0.0%

 Other operating income/(expenses)

     151     (0     (11     52     191     35.2%

 Normalized EBIT

     3 905     (74     (215     397     4 013     10.2%

 Normalized EBITDA

     5 302     (74     (268     341     5 301     6.5%

 Normalized EBITDA margin

     34.6%                             35.3%     116bps  

 North America

   2Q24     Scope     Currency
Translation
    Organic
Growth
    2Q25     Organic
Growth
 

 Volumes

     22 639     (330     -       68     22 376     0.3%

 Revenue

     3 864     (89     (13     82     3 844     2.2%

 Cost of sales

     (1 606     71     4     (6     (1 537     (0.4)%  

 Gross profit

     2 258     (18     (8     76     2 307     3.4%

 SG&A

     (1 101     (2     3     (23     (1 122     (2.0)%  

 Other operating income/(expenses)

     4     -       0     5     10     -  

 Normalized EBIT

     1 161     (21     (5     59     1 195     5.1%

 Normalized EBITDA

     1 338     (21     (5     60     1 372     4.5%

 Normalized EBITDA margin

     34.6%                             35.7%     81bps  

 Middle Americas

   2Q24     Scope     Currency
Translation
    Organic
Growth
    2Q25     Organic
Growth
 

 Volumes

     38 381     -       -       441     38 822     1.1%

 Revenue

     4 522     (13     (400     230     4 340     5.1%

 Cost of sales

     (1 593     (16     135     (43     (1 516     (2.7)%  

 Gross profit

     2 929     (29     (265     188     2 824     6.4%

 SG&A

     (1 100     10     91     11     (987     1.0%

 Other operating income/(expenses)

     11     -       (0     (8     3     (73.2)%  

 Normalized EBIT

     1 841     (18     (174     190     1 839     10.4%

 Normalized EBITDA

     2 219     (18     (203     152     2 149     6.9%

 Normalized EBITDA margin

     49.1%                             49.5%     83bps  

 South America

   2Q24     Scope     Currency
Translation
    Organic
Growth
    2Q25     Organic
Growth
 

 Volumes

     35 969     -       -       (1 770     34 199     (4.9)%  

 Revenue

     2 785     (32     (323     99     2 529     3.6%

 Cost of sales

     (1 427     (10     180     (57     (1 314     (4.0)%  

 Gross profit

     1 358     (42     (143     42     1 215     3.1%

 SG&A

     (976     7     119     (13     (863     (1.4)%  

 Other operating income/(expenses)

     99     (6     (12     22     104     24.7%

 Normalized EBIT

     482     (41     (36     51     456     10.9%

 Normalized EBITDA

     750     (41     (70     53     692     7.2%

 Normalized EBITDA margin

     26.9%                             27.4%     93bps  


ab-inbev.com


Press release – 31 July 2025 – 18


LOGO


 EMEA

   2Q24     Scope     Currency
Translation
    Organic
Growth
    2Q25     Organic
Growth
 

 Volumes

     23 852     112     -       208     24 172     0.9%

 Revenue

     2 301     9     60     118     2 489     5.2%

 Cost of sales

     (1 179     2     (31     (44     (1 252     (3.8)%  

 Gross profit

     1 122     12     29     74     1 237     6.7%

 SG&A

     (691     (21     (24     (27     (764     (3.8)%  

 Other operating income/(expenses)

     34     5     2     15     56     37.4%

 Normalized EBIT

     465     (4     6     63     529     13.7%

 Normalized EBITDA

     721     (4     15     68     800     9.5%

 Normalized EBITDA margin

     31.3%                             32.1%     129bps  

 Asia Pacific

   2Q24     Scope     Currency
Translation
    Organic
Growth
    2Q25     Organic
Growth
 

 Volumes

     25 399     -       -       (1 683     23 716     (6.6)%  

 Revenue

     1 749     0     (13     (78     1 658     (4.5)%  

 Cost of sales

     (821     (7     6     50     (771     6.1%

 Gross profit

     928     (7     (7     (28     886     (3.0)%  

 SG&A

     (549     1     5     24     (520     4.3%

 Other operating income/(expenses)

     30     0     -       (14)       17     (45.1)%  

 Normalized EBIT

     410     (7     (3     (18     383     (4.4)%  

 Normalized EBITDA

     570     (6     (3     (27     533     (4.8)%  

 Normalized EBITDA margin

     32.6%                             32.2%     (9)bps  

 Global Export and Holding Companies

   2Q24     Scope     Currency
Translation
    Organic
Growth
    2Q25     Organic
Growth
 

 Volumes

     62     (6     -       6     62     10.4%

 Revenue

     112     25     1     6     144     7.2%

 Cost of sales

     (141     (15     5     (15     (168     (12.5)%  

 Gross profit

     (30     10     5     (9     (23     (26.6)%  

 SG&A

     (396     6     (7     30     (368     7.8%

 Other operating income/(expenses)

     (28     0     (2     31     2     -  

 Normalized EBIT

     (453     17     (4     52     (389     11.7%

 Normalized EBITDA

     (295     17     (1     35     (245     12.2%


ab-inbev.com


Press release – 31 July 2025 – 19


LOGO


Annex 2: Segment reporting (HY)


 AB InBev Worldwide

   HY24     Scope     Currency
Translation
    Organic
Growth
    HY25     Organic
Growth
 

 Volumes

     285 837     (498     -       (5 724     279 615     (2.0)%  

 Revenue

     29 880     (131     (1 786     669     28 632     2.3%

 Cost of sales

     (13 419     (39     770     87     (12 602     0.7%

 Gross profit

     16 461     (170     (1 016     755     16 029     4.6%

 SG&A

     (9 248     (19     510     (55     (8 812     (0.6)%  

 Other operating income/(expenses)

     334     13     (33     69     383     20.8%

 Normalized EBIT

     7 547     (176     (539     769     7 601     10.3%

 Normalized EBITDA

     10 288     (174     (691     733     10 156     7.2%

 Normalized EBITDA margin

     34.4%                             35.5%     166bps  

 North America

   HY24     Scope     Currency
Translation
    Organic
Growth
    HY25     Organic
Growth
 

 Volumes

     43 992     (474     -       (1 299     42 218     (3.0)%  

 Revenue

     7 457     (126     (38     (85     7 208     (1.2)%  

 Cost of sales

     (3 150     91     13     100     (2 947     3.3%

 Gross profit

     4 307     (35     (25     14     4 261     0.3%

 SG&A

     (2 186     (8     14     7     (2 174     0.3%

 Other operating income/(expenses)

     (8     -       1     31     23     -  

 Normalized EBIT

     2 112     (43     (10     51     2 110     2.5%

 Normalized EBITDA

     2 464     (43     (12     50     2 459     2.0%

 Normalized EBITDA margin

     33.0%                             34.1%     108bps  

 Middle Americas

   HY24     Scope     Currency
Translation
    Organic
Growth
    HY25     Organic
Growth
 

 Volumes

     74 072     -       -       (169     73 903     (0.2)%  

 Revenue

     8 574     (25     (799     374     8 124     4.4%

 Cost of sales

     (3 179     (30     273     70     (2 866     2.2%

 Gross profit

     5 395     (55     (526     444     5 258     8.3%

 SG&A

     (2 065     16     192     (42     (1 898     (2.1)%  

 Other operating income/(expenses)

     23     -       (2     (7     14     (31.2)%  

 Normalized EBIT

     3 353     (38     (336     395     3 374     11.9%

 Normalized EBITDA

     4 105     (38     (404     344     4 007     8.4%

 Normalized EBITDA margin

     47.9%                             49.3%     186bps  

 South America

   HY24     Scope     Currency
Translation
    Organic
Growth
    HY25     Organic
Growth
 

 Volumes

     76 315     -       -       (1 226     75 089     (1.6)%  

 Revenue

     6 018     13     (900     375     5 507     6.2%

 Cost of sales

     (3 013     (99     461     (113     (2 764     (3.7)%  

 Gross profit

     3 005     (86     (438     262     2 743     8.7%

 SG&A

     (1 917     (26     287     (57     (1 712     (2.9)%  

 Other operating income/(expenses)

     215     3     (30     14     201     6.9%

 Normalized EBIT

     1 304     (109     (181     219     1 233     17.2%

 Normalized EBITDA

     1 834     (106     (262     233     1 699     12.9%

 Normalized EBITDA margin

     30.5%                             30.9%     188bps  


ab-inbev.com


Press release – 31 July 2025 – 20


LOGO


 EMEA

   HY24     Scope     Currency
Translation
    Organic
Growth
    HY25     Organic
Growth
 

 Volumes

     44 882     77     -       (35     44 924     (0.1)%  

 Revenue

     4 228     1     16     209     4 454     5.0%

 Cost of sales

     (2 215     13     (5     (72     (2 280     (3.3)%  

 Gross profit

     2 014     14     11     136     2 174     6.8%

 SG&A

     (1 305     (37     (9     (20     (1 371     (1.5)%  

 Other operating income/(expenses)

     79     11     0     11     101     12.5%

 Normalized EBIT

     787     (13     2     128     904     16.5%

 Normalized EBITDA

     1 290     (13     5     142     1 424     11.1%

 Normalized EBITDA margin

     30.5%                             32.0%     177bps  

 Asia Pacific

   HY24     Scope     Currency
Translation
    Organic
Growth
    HY25     Organic
Growth
 

 Volumes

     46 444     (93     -       (2 987     43 365     (6.4)%  

 Revenue

     3 383     (7     (65     (203     3 108     (6.0)%  

 Cost of sales

     (1 583     (9     29     108     (1 456     6.8%

 Gross profit

     1 800     (16     (37     (95     1 652     (5.3)%  

 SG&A

     (994     (2     21     35     (941     3.5%

 Other operating income/(expenses)

     56     0     (0     (15     41     (26.7)%  

 Normalized EBIT

     861     (18     (16     (75     752     (8.8)%  

 Normalized EBITDA

     1 186     (18     (21     (90     1 056     (7.7)%  

 Normalized EBITDA margin

     35.0%                             34.0%     (62)bps  

 Global Export and Holding Companies

   HY24     Scope     Currency
Translation
    Organic
Growth
    HY25     Organic
Growth
 

 Volumes

     132     (9     -       (7     116     (5.7)%  

 Revenue

     221     12     0     (2     231     (0.8)%  

 Cost of sales

     (279     (5     (1     (5     (290     (2.1)%  

 Gross profit

     (59     7     (1     (7     (59     (10.1)%  

 SG&A

     (781     38     5     22     (716     3.0%

 Other operating income/(expenses)

     (31     0     (2     35     2     -  

 Normalized EBIT

     (870     45     2     51     (773     6.1%

 Normalized EBITDA

     (590     45     2     54     (489     9.9%


ab-inbev.com


Press release – 31 July 2025 – 21


LOGO


Annex 3: Consolidated statement of financial position


 Million US dollar

   31 December 2024      30 June 2025  
                   

 ASSETS


 Non-current assets


 Property, plant and equipment

     23 503      23 854

 Goodwill

     110 479      114 782

 Intangible assets

     40 034      41 096

 Investments in associates

     4 612      4 878

 Investment securities

     168      152

 Deferred tax assets

     2 493      2 730

 Pensions and similar obligations

     42      101

 Income tax receivables

     470      426

 Derivatives

     261      44

 Trade and other receivables

     1 577      1 829

 Total non-current assets

     183 637      189 892
                   

 Current assets


 Investment securities

     221      205

 Inventories

     5 020      5 475

 Income tax receivables

     727      872

 Derivatives

     554      340

 Trade and other receivables

     5 270      6 994

 Cash and cash equivalents

     11 174      7 167

 Assets classified as held for sale

     33      161

 Total current assets

     22 999      21 215
                   

 Total assets

     206 637      211 107
                   

 EQUITY AND LIABILITIES


 Equity


 Issued capital

     1 736      1 736

 Share premium

     17 620      17 620

 Reserves

     12 304      13 674

 Retained earnings

     46 577      47 641

 Equity attributable to equity holders of AB InBev

     78 237      80 671
                   

 Non-controlling interests

     10 463      10 743

 Total equity

     88 700      91 414
                   

 Non-current liabilities


 Interest-bearing loans and borrowings

     70 720      71 979

 Pensions and similar obligations

     1 296      1 287

 Deferred tax liabilities

     11 321      11 385

 Income tax payables

     284      296

 Derivatives

     68      372

 Trade and other payables

     797      1 013

 Provisions

     385      352

 Total non-current liabilities

     84 871      86 683
                   

 Current liabilities


 Bank overdrafts

     -        21

 Interest-bearing loans and borrowings

     1 449      3 578

 Income tax payables

     1 805      1 386

 Derivatives

     5 817      5 609

 Trade and other payables

     23 804      22 188

 Provisions

     191      202

 Liabilities associated with assets held for sale

     -        25

 Total current liabilities

     33 066      33 009
                   

 Total equity and liabilities

     206 637      211 107


ab-inbev.com


Press release – 31 July 2025 – 22


LOGO


Annex 4: Consolidated statement of cash flows


 For the six-month period ended 30 June

 Million US dollar

   2024      2025  
                   

 OPERATING ACTIVITIES


 Profit of the period

     3 236        4 568

 Depreciation, amortization and impairment

     2 741        2 581

 Net finance expense/(income)

     2 887        1 678

 Equity-settled share-based payment expense

     315        309

 Income tax expense

     1 546        1 404

 Share of results of associates

     (241)        (144

 Other non-cash items

     339        (93

 Cash flow from operating activities before changes in working capital and use of provisions

     10 824        10 304

 Decrease/(increase) in trade and other receivables

     (1 154)        (1 130

 Decrease/(increase) in inventories

     (325)        (242

 Increase/(decrease) in trade and other payables

     (2 691)        (2 284

 Pension contributions and use of provisions

     (251)        (278

 Cash generated from operations

     6 403        6 370

 Interest paid

     (2 001)        (1 916

 Interest received

     303        241

 Dividends received

     123        135

 Income tax paid

     (2 260)        (2 126

 Cash flow from/(used in) operating activities

     2 568        2 704
                   

 INVESTING ACTIVITIES


 Acquisition of property, plant and equipment and of intangible assets

     (1 735)        (1 404

 Proceeds from sale of property, plant and equipment and of intangible assets

     52        55

 Sale/(acquisition) of subsidiaries, net of cash

     (19)        (4

 Proceeds from sale/(acquisition) of other assets

     (29)        47

 Cash flow from/(used in) investing activities

     (1 732)        (1 306
                   

 FINANCING ACTIVITIES


 Proceeds from borrowings

     5 466        4 067

 Repayments of borrowings

     (4 342)        (3 998

 Dividends paid

     (2 142)        (3 147

 Share buyback

     (838)        (1 901

 Payment of lease liabilities

     (406)        (354

 Derivative financial instruments

     (172)        114

 Sale/(acquisition) of non-controlling interests

     (414)        (314

 Other financing cash flows

     (465)        (303

 Cash flow from/(used in) financing activities

     (3 313)        (5 837
                   

 Net increase/(decrease) in cash and cash equivalents

     (2 476)        (4 438

 Cash and cash equivalents less bank overdrafts at beginning of year

     10 314        11 174

 Effect of exchange rate fluctuations

     (463)        410

 Cash and cash equivalents less bank overdrafts at end of period

     7 375        7 146


ab-inbev.com


Press release – 31 July 2025 – 23