
Second Quarter 2025
July 31, 2025
1
[1] Adjusted EBITDA is a non-GAAP financial
measure.
[2] Adjusted Net Income is a non-GAAP financial
measure that excludes $1.5 billion in pre-tax gains on
strategic investments—which included an unrealized
gain on our investment in Circle—and a $362 million
pre-tax gain on our crypto investment portfolio (largely
unrealized).
[3] $USD resources is defined as cash and cash
equivalents and USDC (net of USDC loaned or
pledged as collateral).
[4] Includes corporate USDC balances and USDC
held on behalf of customers in eligible Coinbase
products.
[5] Assets under custody (AUC) is defined as the total
US dollar equivalent value of USDC and crypto assets
held separately on behalf of customers in digital
wallets within our cold storage custody services,
calculated based on the market price on June 30,
2025.
[6] As of June 30, 2025.
Figures have been rounded for presentation purposes
only. For additional financial information and a
reconciliation between GAAP and non-GAAP results,
please refer to the reconciliation of GAAP to Non-
GAAP results tables in this shareholder letter and our
Form 10-Q filed with the SEC on July 31, 2025.
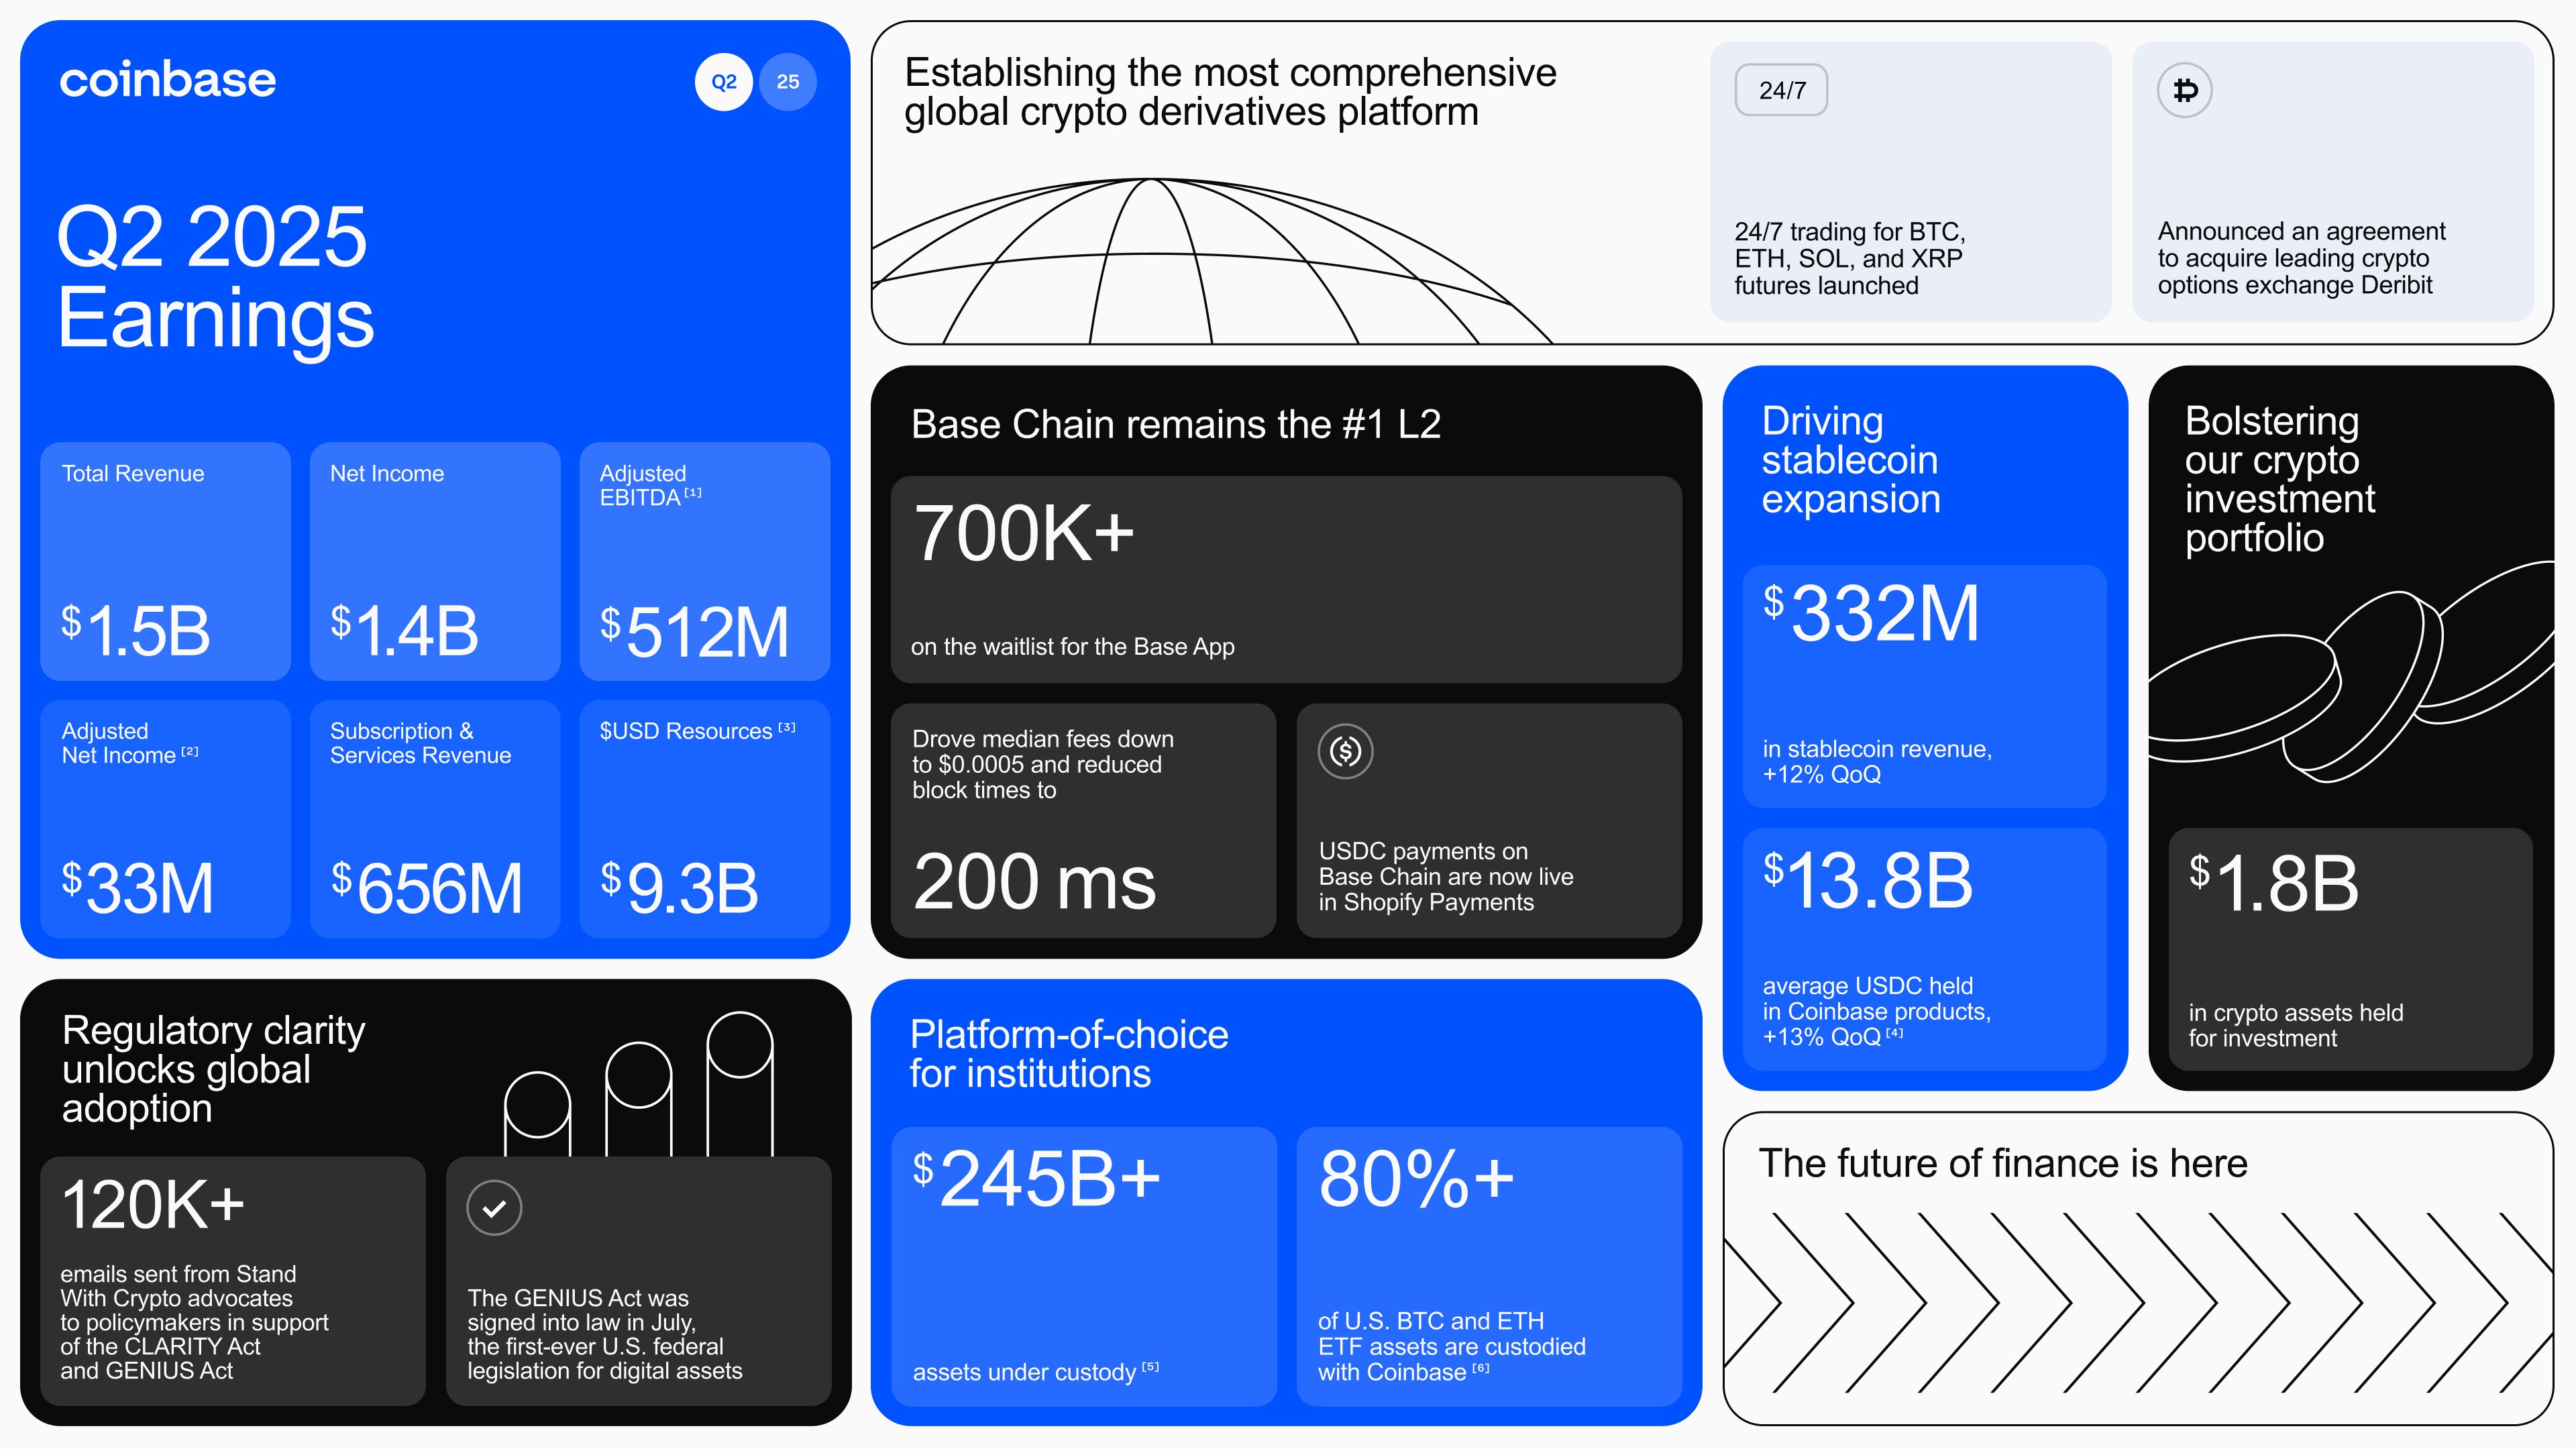
We delivered solid financial results in Q2, generating $1.5 billion in total revenue, $1.4 billion in net income
Fellow
Shareholders,
(which includes both a $1.5 billion gain on strategic investments and a $362 million gain on crypto investment
assets), $33 million in Adjusted Net Income (which excludes both aforementioned items) and $512 million in
Adjusted EBITDA. Transaction revenue was $764 million. Subscription and services revenue was $656 million,
driven by continued growth in average USDC balances, native units staked, and all-time high average Prime
Financing balances. We also had all-time high average market share of crypto assets on our custody platform.
We ended Q2 with $9.3 billion in total $USD resources, reinforcing our ability to invest in innovation and long-
term growth, as well as $1.8 billion in our crypto asset investment portfolio, fueled by weekly BTC purchases.
We are working to bring the financial system onchain and made progress in Q2 across each phase of crypto
adoption: first—as an investment, second—as financial services, and third—as an app platform. For
investments, we continued to innovate and scale our derivatives business, launching the broadest suite of
CFTC-regulated crypto perpetual futures products in the U.S. and achieving all-time highs in derivatives trading
volume and open interest on our international derivatives exchange. For financial services, we helped grow
USDC adoption, with average balances in Coinbase products increasing 13% Q/Q to $13.8 billion, driven in
part by an extension of our rewards program, and announced new initiatives like USDC on Base Chain going
live in Shopify Payments, Coinbase Business, and Coinbase One Card—all of which increase the daily utility of
crypto. As an app platform, we continued to scale the Base Chain, reaching new milestones of transactions
processing in milliseconds for millicents, reinforcing its position as the fastest and cheapest Layer 2 network.
Additionally, we launched the Base App (formerly Coinbase Wallet) in open beta and have over 700,000 people
on the waitlist, creating a unified experience for trading, payments, social, and more.
On the policy front, July marked monumental milestones for us. The GENIUS Act, the first U.S. federal
legislation for digital assets, was signed into law, and the House passed the CLARITY Act, which sets a market
structure framework for digital assets. These bills provide a clear regulatory foundation for stablecoins and
digital assets, potentially unlocking new opportunities for Coinbase and reinforcing U.S. leadership in digital
finance.
2
Chapter 1: Q2 was a solid quarter amid lower volatility. Total revenue in Q2 was $1.5 billion, down 26% Q/
1 Announced on the Current Report
on Form 8-K we filed with the SEC
on May 15, 2025.
Q. Transaction revenue was $764 million, down 39% Q/Q. Subscription and services revenue was $656 million,
down 6% Q/Q. Total operating expenses grew $193 million or 15% Q/Q to $1.5 billion, driven by $307 million in
expenses related to the data theft incident disclosed in May1. Technology & development, general &
administrative, and sales & marketing expenses collectively decreased 2% to $977 million. Net income was
$1.4 billion, Adjusted Net Income was $33 million (excluding $1.5 billion in pre-tax gains on strategic
investments—which included an unrealized gain on our investment in Circle—and a $362 million pre-tax gain
on our crypto investment portfolio (largely unrealized)), and Adjusted EBITDA was $512 million. We ended Q2
with $9.3 billion in $USD resources, $1.8 billion in crypto assets held for investment, and 4,279 full-time
employees.
Chapter 2: Building the financial system onchain through every phase of adoption. In Q2, Coinbase
made significant strides in bringing the financial system onchain by expanding access to trading through
innovative derivative products, listing more spot assets, and expanding our offerings in markets globally. We
deepened financial utility with payment focused innovations like Coinbase Business, USDC integration with
Shopify, and the announcement of the Coinbase One Card. Infrastructure upgrades included Base Chain’s
decentralization milestones, faster transaction speeds, and expanded stablecoin distribution, reinforcing our
platform flywheel. These efforts empower users and institutions alike, positioning Coinbase as a leader in
driving a faster, more open, and globally connected financial system.
Chapter 3: Significant progress in policy and regulatory clarity. We reached significant milestones in
advancing crypto policy and regulation both domestically and internationally. The GENIUS Act was signed into
law in July, the first-ever U.S. federal legislation for digital assets, establishing clear rules for USD stablecoin
issuers, while the CLARITY Act similarly passed the House with strong bipartisan support, reinforcing crypto as
a unifying issue in Washington. The GENIUS Act and CLARITY Act together will create a robust,
comprehensive regulatory framework for stablecoins and tokenized assets, potentially unlocking new
opportunities for Coinbase and solidifying U.S. leadership in digital finance.
Chapter 4: Q3’25 Outlook. We anticipate July transaction revenue to be approximately $360 million. We
expect Q3 subscription and services revenue to be within $665-$745 million driven primarily by higher average
crypto prices and stablecoin revenue (new all-time high in USDC market capitalization in July). We expect Q3
transaction expenses to be in the mid-teens as a percent of net revenue. We expect technology & development
and general & administrative expenses to range from $800-$850 million driven by headcount growth to support
international expansion, new product initiatives, and fortifying customer support & security functions. Finally, we
expect sales & marketing expenses to be in the range of $190-$290 million, driven by potential variability in 1)
performance marketing and 2) customer USDC balances in Coinbase products, which drive USDC rewards.
Select Metrics | ||||||||
METRICS ($M) | Q2’24 | Q3’24 | Q4’24 | Q1’25 | Q2’25 | |||
Net Revenue | 1,380 | 1,129 | 2,197 | 1,960 | 1,420 | |||
Net Income | 36 | 75 | 1,291 | 66 | 1,429 | |||
Adjusted EBITDA | 596 | 449 | 1,289 | 930 | 512 | |||
Q2’25 Coinbase Results vs. Outlook | ||||||||
METRIC | COINBASE Q2 OUTLOOK (May 2025) | Q2 ACTUALS | ||||||
Subscription and Services Revenue | $600-$680 million | $656 million | ||||||
Transaction Expenses as a percentage of net revenue | Mid-Teens as a percentage of net revenue Dependent on revenue mix | 17% | ||||||
Technology and Development + General and Administrative Expenses including stock-based compensation | $700-$750 million Including $180 million in stock-based compensation | $741 million including $182 million in stock-based compensation | ||||||
Sales and Marketing Expenses including stock-based compensation | $215-$315 million Including ~$15 million in stock-based compensation | $236 million including $15 million in stock-based compensation | ||||||
3
Q2 was a solid quarter amid lower volatility
Chapter 1
Total revenue in Q2 was $1.5 billion, down 26% Q/Q. Transaction revenue was $764 million, down 39% Q/Q.
Subscription and services revenue was $656 million, down 6% Q/Q. Total operating expenses grew $193
million or 15% Q/Q to $1.5 billion, driven by $307 million in expenses related to the data theft incident disclosed
in May. Technology & Development, General & Administrative, and Sales & Marketing expenses collectively
decreased 2% to $977 million as we decreased variable expenses given softer market conditions (notably
performance marketing) and had lower policy-related spend. Net income was $1.4 billion, Adjusted Net Income
was $33 million (excluding $1.5 billion in pre-tax gains on strategic investments—which included an unrealized
gain on our investment in Circle—and a $362 million pre-tax gain on our crypto investment portfolio (largely
unrealized)), and Adjusted EBITDA was $512 million.
Total Revenue ($M) | |||||||
TOTAL REVENUE | Q2’24 | Q3’24 | Q4’24 | Q1’25 | Q2’25 | ||
Transaction Revenue | |||||||
Consumer, net | 664.8 | 483.3 | 1,347.1 | 1,095.5 | 649.9 | ||
Institutional, net | 63.6 | 55.3 | 141.3 | 98.9 | 60.8 | ||
Other transaction revenue, net | 52.5 | 34.0 | 67.6 | 67.8 | 53.5 | ||
Total Transaction Revenue | 780.9 | 572.5 | 1,556.0 | 1,262.2 | 764.3 | ||
Subscription and Services Revenue | |||||||
Stablecoin revenue | 240.4 | 246.9 | 225.9 | 297.5 | 332.5 | ||
Blockchain rewards | 185.1 | 154.8 | 214.9 | 196.6 | 144.5 | ||
Interest and finance fee income | 69.4 | 64.0 | 65.7 | 63.1 | 59.3 | ||
Other subscription and services revenue1 | 104.1 | 90.4 | 134.6 | 140.9 | 119.5 | ||
Total Subscription and Services Revenue | 599.0 | 556.1 | 641.1 | 698.1 | 655.8 | ||
Net Revenue | 1,379.9 | 1,128.6 | 2,197.0 | 1,960.3 | 1,420.1 | ||
Corporate interest and other income | 69.7 | 76.6 | 74.6 | 74.0 | 77.1 | ||
Total Revenue | 1,449.6 | 1,205.2 | 2,271.6 | 2,034.3 | 1,497.2 | ||
1 Starting in Q1’25, Custodial Fee
revenue has been condensed into
Other Subscription and Services
revenue and will no longer be
disclosed as a separate line item
as it now comprises a smaller
percentage of our subscription and
services revenue. Prior periods
have been recast to conform to
current period presentation.
Note: Figures presented may not
sum precisely due to rounding.
Transaction Revenue
2 Crypto Asset Volatility represents
our internal measure of crypto
asset volatility in the market
relative to prior periods. The
volatility is based on intraday
returns of a volume-weighted
basket of all assets listed on our
trading platform. These returns are
used to compute the basket’s
intraday volatility which is then
scaled to a daily window. These
daily volatility values are then
averaged over the applicable time
period as needed.
Crypto spot volumes—both globally and in the US—were down 31% and 32% Q/Q, respectively, against a
market backdrop where we saw average crypto market capitalization approximately flat Q/Q and Crypto Asset
Volatility2 down 16% Q/Q.
Q2 transaction revenue was $764 million, down 39% Q/Q, and our total Trading Volume3 was down 40% Q/Q
3 Trading Volume represents the
total US dollar equivalent value of
spot matched trades transacted
between a buyer and seller
through our platform during the
period of measurement.
to $237 billion, underperforming the spot markets. However, the majority of this underperformance came from
lower stablecoin pair Trading Volume driven by an intentional pricing change we made in March as we evolved
our stablecoin strategy. Excluding the impact of stablecoin pair volume, our total Trading Volume was down
more similar to the spot market overall.
Consumer Transaction Revenue. Consumer Trading Volume was $43 billion, down 45% Q/Q. Consumer
transaction revenue was $650 million, down 41% Q/Q. Spot volume mix on the platform shifted more toward
Simple in Q2. Historically, Advanced trading activity tends to be more correlated with market volatility, which
declined in Q2. Additionally, the intentional pricing change on stablecoin pair trading disproportionately affected
Advanced platform volumes where most of that activity was taking place.
Institutional Transaction Revenue. Institutional Trading Volume was $194 billion, down 38% Q/Q. Institutional
transaction revenue was $61 million, down 38% Q/Q, in-line with the decline in Institutional Trading Volume.
4
Other Transaction Revenue. Other transaction revenue was $54 million, down 21% Q/Q. While the number of
transactions on Base Chain continued to increase, average revenue per transaction decreased meaningfully,
driven by our continued scaling efforts. Transaction processing time is now measured in milliseconds and costs
millicents, surpassing our initial goals of 1 second for 1 cent and making the economics of building onchain
increasingly favorable.
TRADING VOLUME ($B) | Q2’24 | Q3’24 | Q4’24 | Q1’25 | Q2’25 | ||
Consumer | 37 | 34 | 94 | 78 | 43 | ||
Institutional | 189 | 151 | 345 | 315 | 194 | ||
Total | 226 | 185 | 439 | 393 | 237 | ||
TRADING VOLUME (% OF TOTAL)1 | Q2’24 | Q3’24 | Q4’24 | Q1’25 | Q2’25 | ||
Bitcoin | 35% | 37% | 27% | 27% | 30% | ||
Ethereum | 15% | 15% | 10% | 11% | 15% | ||
XRP | * | * | * | 11% | * | ||
USDT | 10% | 15% | 15% | 13% | * | ||
Other crypto assets | 40% | 33% | 48% | 38% | 55% | ||
Total | 100% | 100% | 100% | 100% | 100% | ||
TRANSACTION REVENUE (% OF TOTAL)2 | Q2’24 | Q3’24 | Q4’24 | Q1’25 | Q2’25 | ||
Bitcoin | 31% | 35% | 27% | 26% | 34% | ||
Ethereum | 17% | 16% | 10% | 10% | 12% | ||
Solana | 10% | 11% | * | 10% | * | ||
XRP | * | * | 14% | 18% | 13% | ||
Other crypto assets | 42% | 38% | 49% | 36% | 41% | ||
Total | 100% | 100% | 100% | 100% | 100% | ||
1 Spot Trading Volume is
presented on a matched basis,
and is categorized by the base
rather than the quote asset. The
majority of trading pairs on our
platform utilize USD/USDC as
the quote currency, and thus are
not included in the breakdown
by asset in the table.
2 Total transaction revenue
generated from trading on our
platform.
*Below reporting threshold of
10%.
Note: Figures presented may
not sum precisely due to
rounding.
Subscription and Services Revenue
Q2 Subscription and services revenue was $656 million, down 6% Q/Q. We continued to drive growth in
average USDC balances, native units staked, net inflows to our custody platform—where we reached an all-
time high share of 7% of total crypto market cap—as well as all-time high average loan balances across our
Prime Financing products. However, these were more than offset by headwinds from declines in average asset
prices (primarily ETH and SOL), lower protocol rewards rates, and lower customer custodial fiat balances.
Stablecoin revenue grew 12% Q/Q to $332 million in Q2. Average USDC balances held in Coinbase products
increased 13% Q/Q to $13.8 billion. Meanwhile, average off-platform USDC balances increased 13% Q/Q to
$47.4 billion.
Rewards continue to be an important driver of USDC growth and adoption. We saw increased deposits of
USDC on our International Exchange driven by our boosted rewards promotion. Additionally in Q2, we
integrated USDC across our stablecoin payments platform (see Chapter 2 for additional details).
USDC Balances & Revenue | Q2’25 | |||
Average Market Cap ($B) | Coinbase Stablecoin Revenue ($M) | |||
USDC in Coinbase Products | 14 | 144 | ||
Off-platform USDC | 47 | 188 | ||
Total | 61 | 332 | ||
5
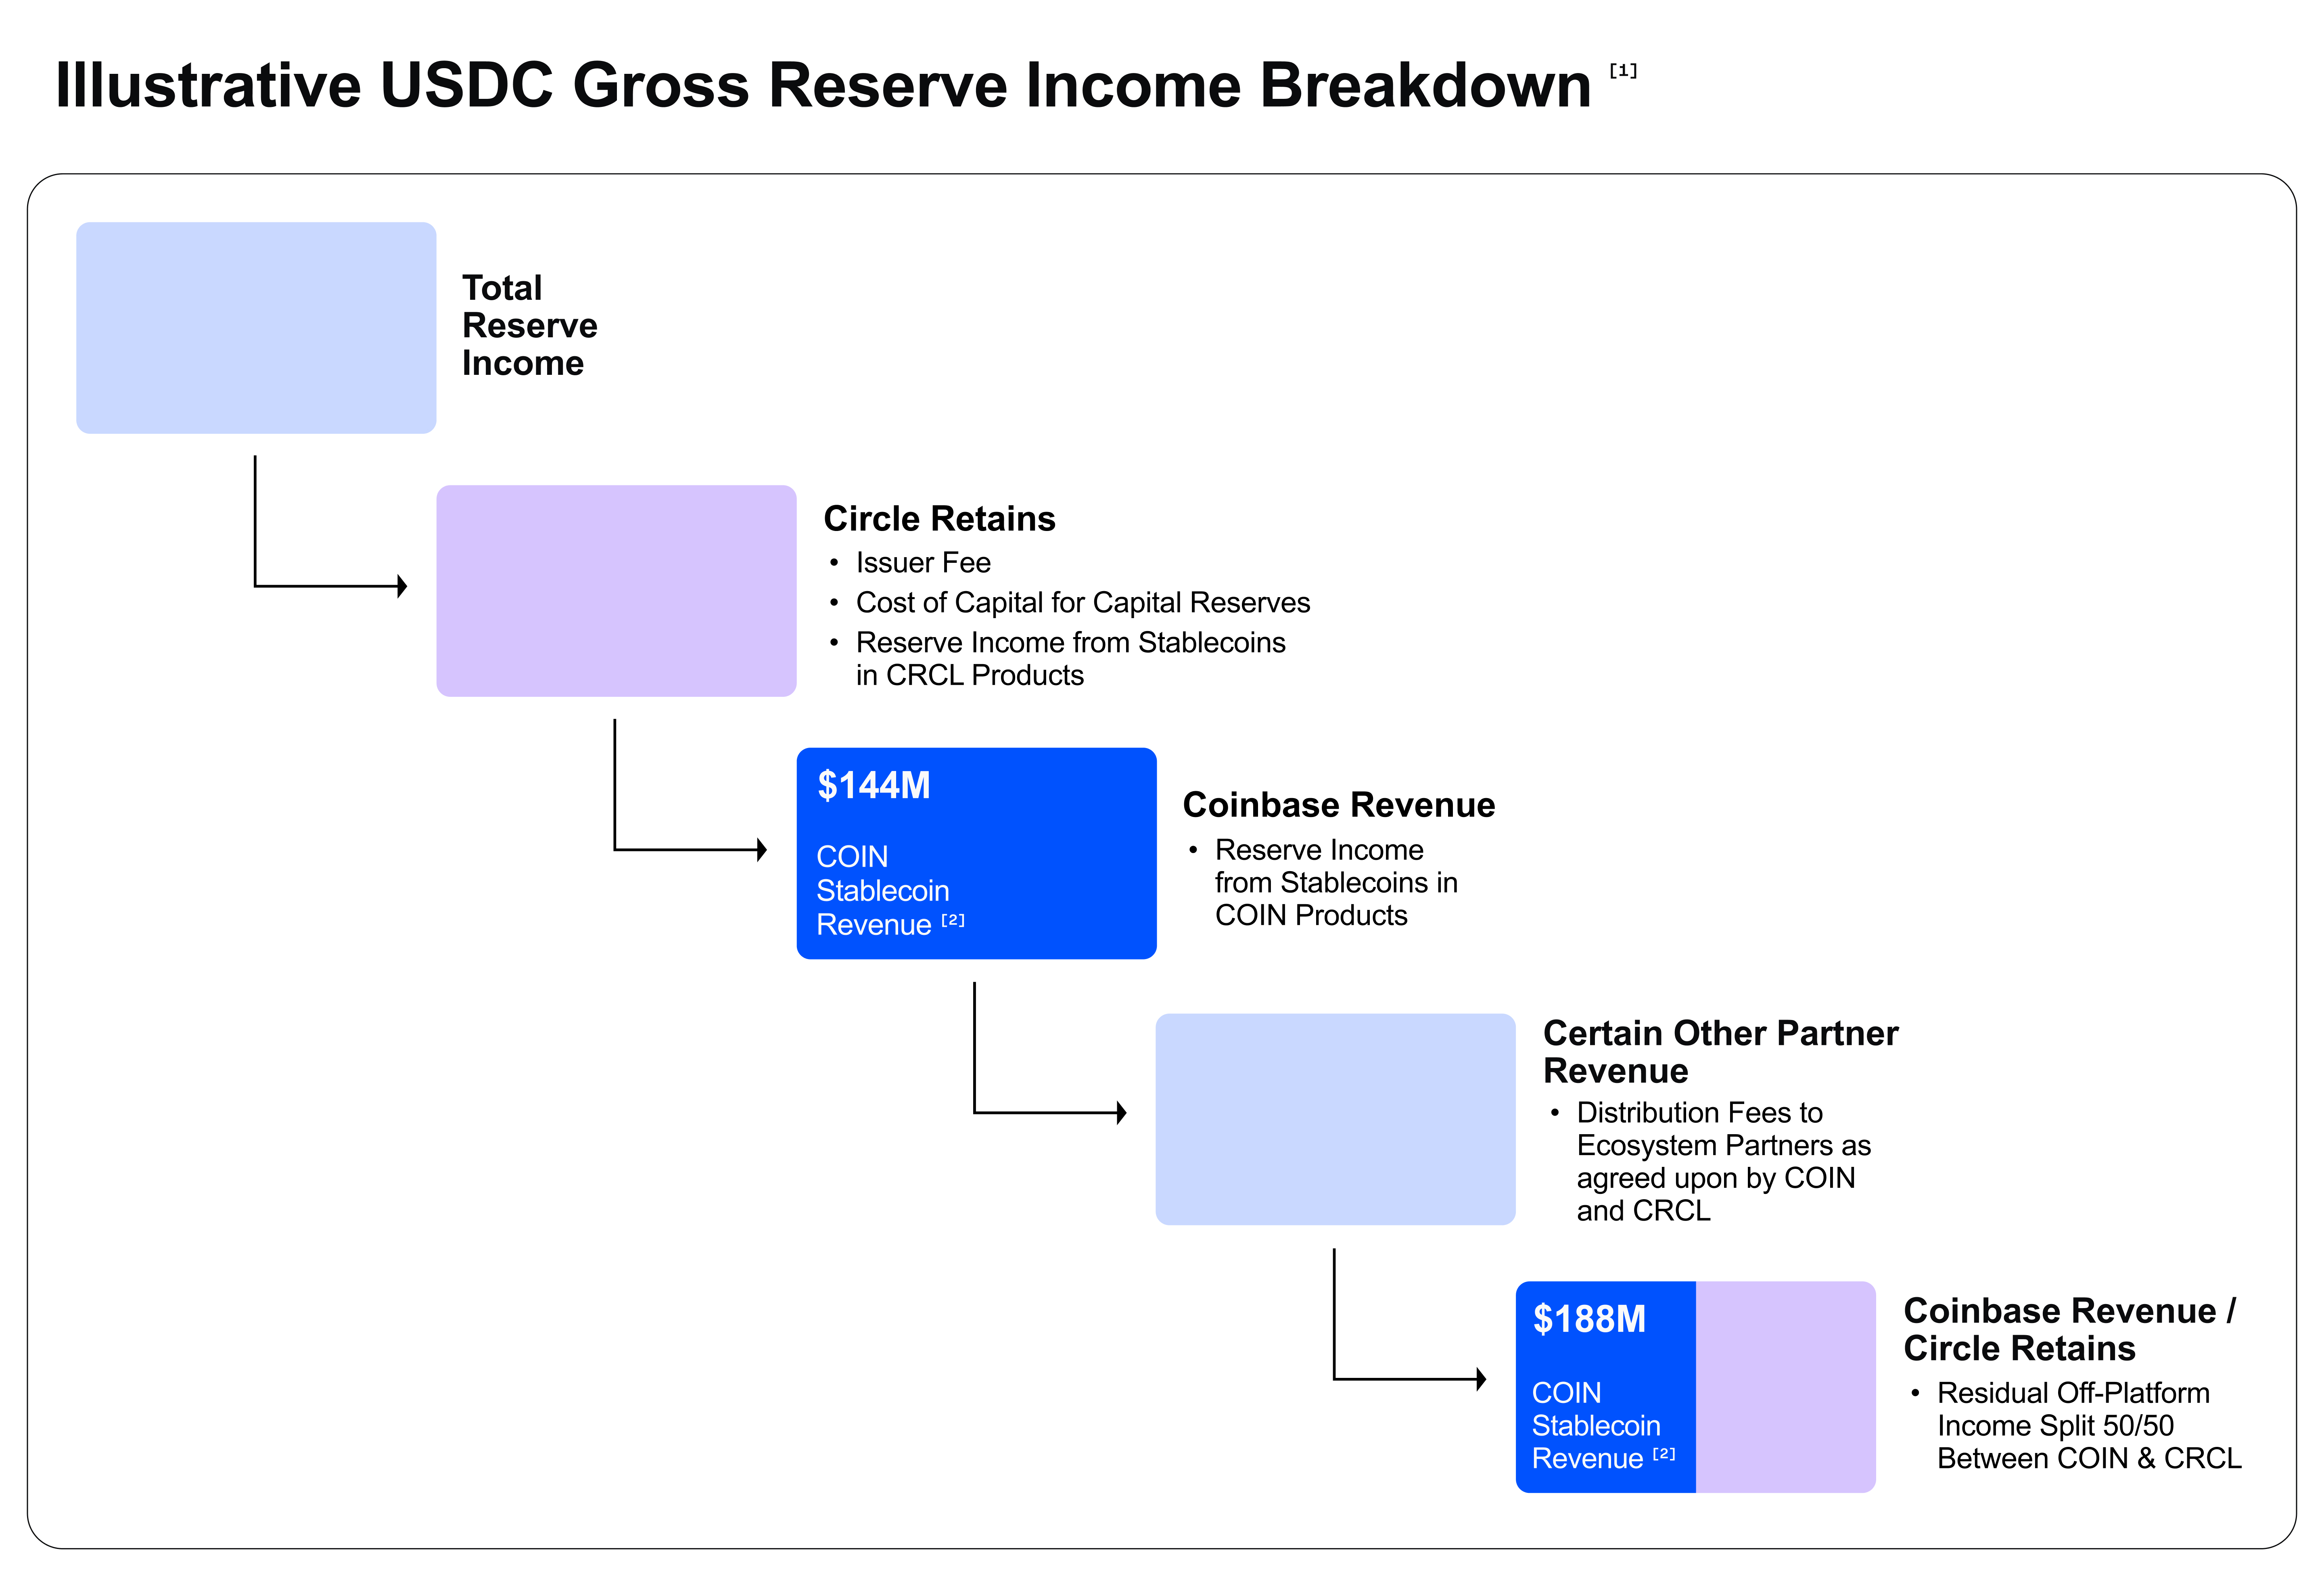
Note: Column sizes are for
illustrative purposes only and not
indicative of actual amounts.
[1] For stablecoins covered by the
collaboration agreement between
Coinbase and Circle only. Not
necessarily indicative of
agreements for other stablecoins
we may support. Circle and
Coinbase may each enter into
distribution and incentive
arrangements directly with third
parties at their own discretion that
do not impact the payment base.
[2] For Q2 2025.
Blockchain rewards revenue was $145 million, down 26% Q/Q. We drove a Q/Q increase in native units staked
with the rollout of one-click staking to reduce the friction and complexity for retail users to begin earning
rewards. Additionally, we saw an uplift stemming from regulatory clarity with strong inflows from users in South
Carolina who were able to stake again following the dismissal of the staking lawsuit. More than offsetting these
inflows were lower average prices of both ETH and SOL (nearly 20% Q/Q) and lower protocol rewards rates in
Q2 vs. Q1.
Interest and finance fee income was $59 million, down 6% Q/Q. Prime Financing revenue was up Q/Q driven
by all-time high average loan balances in Q2. Demand for financing products remains strong—we saw double
digit growth in active customers in Q2—across an increasingly diverse client base, including corporates and
miners. More than offsetting this was lower interest income on custodial fiat primarily driven by lower average
balances given the decline in trading activity.
Other subscription and services revenue was $119 million, down 15% Q/Q. There were two factors which drove
the majority of the Q/Q decline:
First was Custodial fee revenue. Assets Under Custody reached a record $245.7 billion, driven by strong native
units inflows from ETFs and Corporate purchases. We maintain an 80%+ custody share of crypto ETF assets,
and Coinbase is the trusted custodian for 8 out of the top 10 publicly traded companies with BTC on their
balance sheet. More than offsetting this growth, however, was lower blended fee rates driven by customer mix
and lower non-BTC asset prices.
Second, Coinbase One revenues declined modestly Q/Q, but remained more stable than our trading business.
Expenses
Total Q2 operating expenses grew $193 million or 15% Q/Q to $1.5 billion. This included $308 million in Other
operating expenses, substantially all of which were related to costs associated with the data theft incident we
6
disclosed in May. Technology & development, general & administrative, and sales & marketing collectively
decreased 2% Q/Q to $977 million. We ended the quarter with 4,279 full-time employees, up 8% Q/Q.
Operating Expenses ($M) | |||||||
OPERATING EXPENSES | Q2’24 | Q3’24 | Q4’24 | Q1’25 | Q2’25 | ||
Transaction expense | 191.5 | 171.8 | 317.0 | 303.0 | 245.3 | ||
% of net revenue | 14% | 15% | 14% | 15% | 17% | ||
Technology and development | 364.3 | 377.4 | 368.7 | 355.4 | 387.3 | ||
Sales and marketing | 165.3 | 164.8 | 225.8 | 247.3 | 236.2 | ||
General and administrative1 | 320.1 | 330.4 | 362.5 | 394.3 | 353.7 | ||
Losses (gains) on crypto assets held for operations, net | 31.0 | (0.1) | (16.2) | 34.4 | (8.7) | ||
Other operating expenses (income), net1 | 34.4 | (8.6) | (20.3) | (5.9) | 308.0 | ||
Total operating expenses | 1,106.5 | 1,035.7 | 1,237.6 | 1,328.5 | 1,521.9 | ||
Full-time employees (end of quarter) | 3,486 | 3,672 | 3,772 | 3,959 | 4,279 | ||
Note: Figures presented may
not sum precisely due to
rounding.
1 During the second quarter of
2024, we reclassified certain
policy expenses from Other
operating expenses, net to
General and administrative.
Prior period amounts have been
reclassified to conform to
current period presentation.
Q2 transaction expenses were $245 million, down 19% Q/Q, primarily driven by a decrease in customer trading
activity and lower blockchain reward fees related to lower average asset prices. Transaction expenses as a
percentage of net revenue increased slightly to 17% as we continued to utilize rebates and incentives to build
open interest in our derivatives business.
Technology and development expenses were $387 million, up 9% Q/Q. The increase was driven primarily by
higher personnel related expenses. We also incurred higher variable software spend related to a project to
strengthen our infrastructure and reposition our vendor portfolio.
General and administrative expenses were $354 million, down 10% Q/Q. The decrease was driven by lower
policy-related spend and lower expenses associated with the softer market conditions in Q2. These reductions
were slightly offset by higher professional services expenses related to recent M&A activity and efforts to help
ensure regulatory compliance globally, notably obtaining our MiCA license in Europe.
Sales and marketing expenses were $236 million, down 4% Q/Q. Variable marketing was lower Q/Q amidst
softening marketing conditions in the quarter. However, this decrease was partially offset by seasonal spend
associated with our NBA sponsorship in addition to higher rewards on USDC.
Other operating expenses, net were $308 million, primarily from the data theft incident disclosed in May, which
included voluntary customer reimbursements and direct legal costs.
Stock-based compensation expense was $196 million, up 3% Q/Q, and in-line with our outlook.
Our effective tax rate in Q2 was 22%.
Net income in Q2 was $1.4 billion. This was impacted by $362 million in pre-tax gains on our crypto asset
investment portfolio—which was largely unrealized—as well as $1.5 billion in Other income largely driven by
gains on the fair value remeasurement of our investment in Circle. Adjusted Net Income was $33 million and
Adjusted EBITDA was $512 million. We have updated our Adjusted Net Income calculation to adjust for both
gains and losses on both crypto investments and strategic investments.
Share Count
Our fully diluted share count at the end of Q2 was 289 million. Included in this figure are 256 million common
shares and 33 million dilutive shares. In Q2, we also withheld approximately 383 thousand shares from net
7
share settlement of employee equity awards. Instead of selling shares into the market to cover taxes on these
equity awards, we pay the taxes and we withhold those shares, which has the same effect as a stock buyback.
Capital and Liquidity
At the end of Q2, we had $9.3 billion in $USD resources1, declining $590 million or 6% Q/Q. The decrease was
CORPORATE CASH
$1,449M
MONEY MARKET FUNDS
$5,980M
1 Defined as cash and cash
equivalents and USDC (net of
USDC loaned or pledged as
collateral).
driven primarily by an increase in fiat loan originations and purchases for our crypto asset investment portfolio.
*Net of USDC loaned or pledged as collateral.
Note: Figures presented may not sum precisely due to rounding.
TOTAL: $9,323M
Total $USD Resources
CORPORATE CASH HELD
AT THIRD-PARTY VENUES
$110M
USDC*
$1,784M
We consider our crypto assets for investment and certain crypto assets held a collateral as other liquidity
resources available to us. In Q2, we increased our bitcoin holdings by $222 million, driven by weekly purchases
for our crypto investment portfolio. As of June 30, 2025, the fair market value of our crypto assets held for
investment and our crypto assets held as collateral were $1.8 billion and $951 million, respectively. When
including these crypto assets, total available resources totaled $12.1 billion.
Collateralized Arrangements & Financing and Counterparty Risk
We maintained our longstanding commitment to operating and risk excellence in Q2. At the end of Q2, we had
$1.1 billion in total credit and counterparty risk (excluding banks), stemming from $879 million in collateralized
loans to customers and $203 million held at third-party venues (including $110 million in unrestricted cash). As
a reminder, our loans require 100% in collateral (including recent facilities extended to BTC miners), and are
subject to rigorous risk monitoring.
8
Building the financial system onchain through every phase of adoption
Chapter 2
Crypto adoption happens in phases—first as an investment, second as a financial service, and third as an app
platform—and Coinbase is building the products that meet users at each step. We provide a trusted platform
for users and institutions to invest through trading and custody, bringing assets onto our platform. We provide
financial services that let users do more with those assets from staking and spending to running their
businesses with crypto. We provide the infrastructure to scale this ecosystem, with Base Chain as a fast, low-
cost network, and stablecoins like USDC as trusted digital money. And we debuted the new Base App which
serves as the front door to the onchain economy. In Q2, we made meaningful progress across each phase,
furthering our mission of increasing economic freedom.
Crypto as an Investment: Trading is the first established use case in crypto, and Coinbase is focused on
supporting that with the most trusted, comprehensive platform in the market. In Q2, we continued to add more
assets to our platform, scaled our derivatives offering, and grew institutional adoption, advancing our goal of
making Coinbase the easiest way to invest in and engage with crypto. Some of these efforts are long-standing
strengths, others are earlier bets, but each gets us one step closer to building an everything exchange, one
platform for everything you can trade onchain.
Spot & Simple Trading: Expanding Access to the Assets Users Want
•We recently exceeded 300 spot assets listed on our platform, continuing to meet the top request from
users: more assets to trade.
•In Q2, we announced plans for DEX trading integration, which we anticipate will bring access to
millions of assets directly into the Base App, and allow builders to gain distribution by making their
tokens available to millions of Coinbase users from day one.
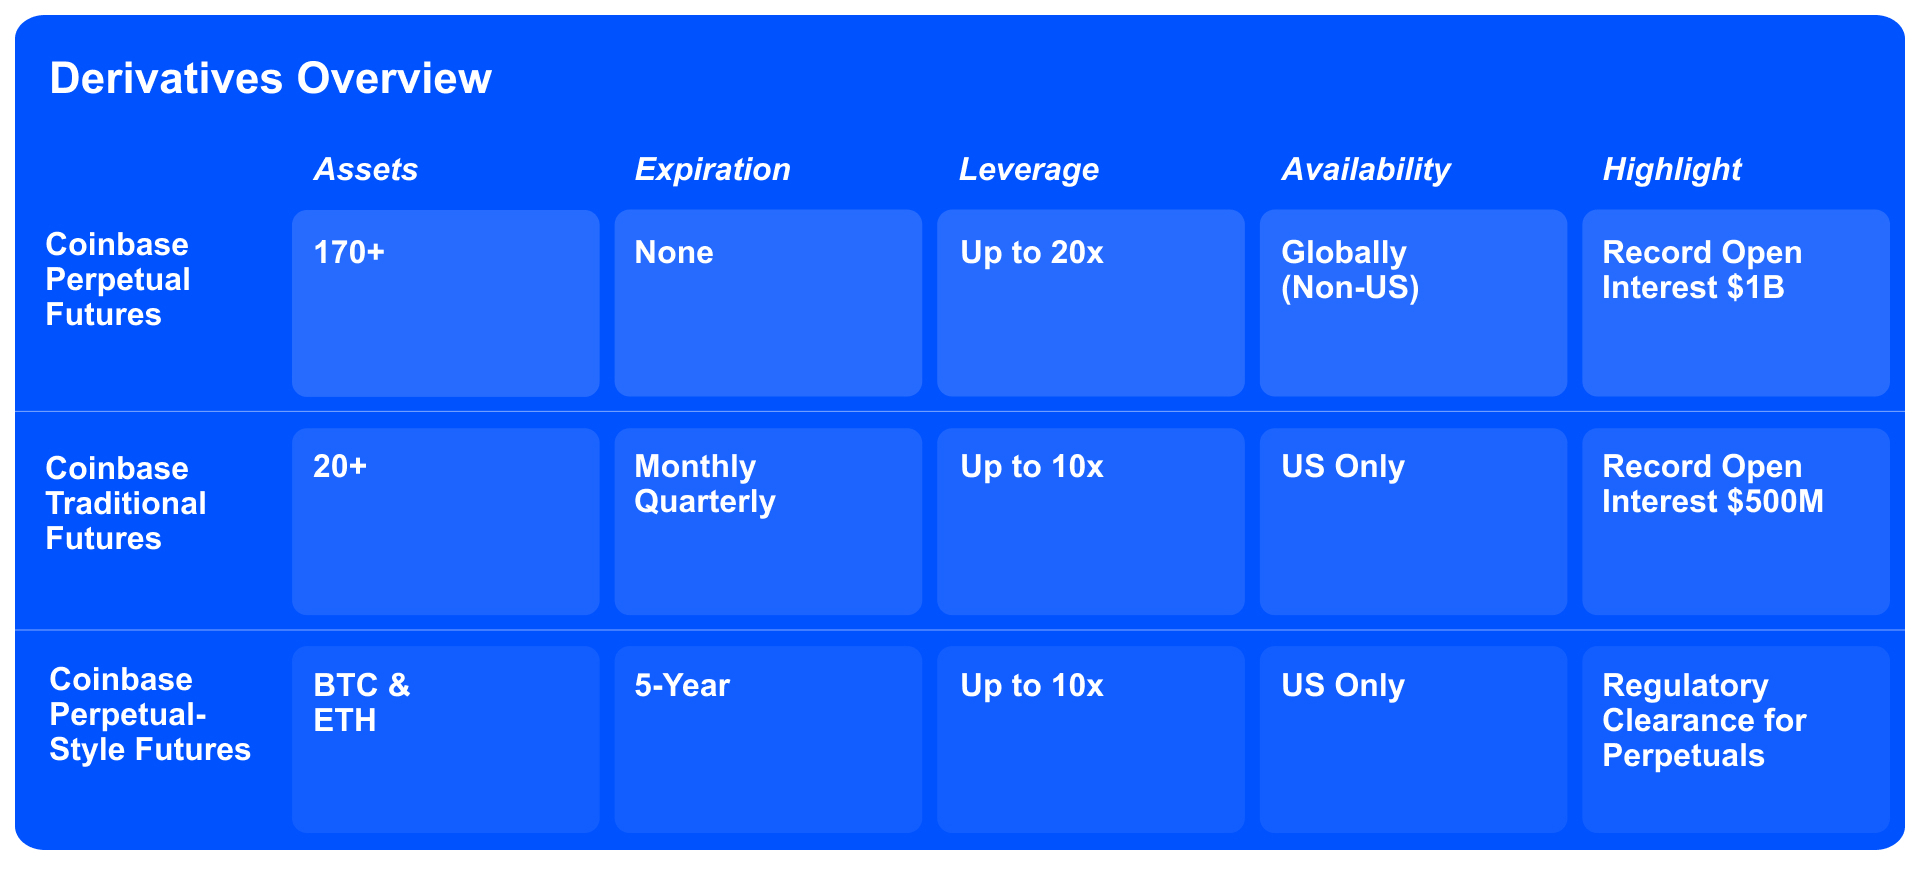
Derivatives: Scaling a Durable, Global Business
•Over the past two years, 75% of global crypto trading volume has come from derivatives, yet the U.S.
market makes up only a fraction of this volume, which presents a significant growth opportunity. To
grow this market we:
◦Launched the broadest suite of CFTC-regulated crypto perpetual futures products in the U.S.
in July, trading 24/7 and offering up to 10x intra-day leverage, closing a key gap in domestic
market access.
◦Became the first U.S. regulated futures exchange to offer 24/7 futures trading for BTC, ETH,
SOL, and XRP, with weekend volumes now approaching weekday volumes.
•Abroad we saw all-time highs in derivative trading volume, open interest, and customer balances on
our international derivatives exchange, driven by targeted incentives and product expansion.
•Our acquisition of Deribit, the global leader in crypto options, which we announced in Q2, is expected
to close by December 31, 2025. This will expand our derivatives product suite and international
presence, adds a more stable revenue stream via options trading, and will enable greater capital
efficiency for traders.
9
Custody at Scale: Coinbase as the Default Institutional Partner
Note: As of July 31, 2025.
Excludes Deribit, which
acquisition is expected to close
by December 31, 2025.
•Assets Under Custody (AUC) share reached an all-time high of total crypto asset market cap with
$245.7 billion AUC driven by strong inflows from ETFs and Corporate purchases.
•Coinbase is the custodian for over 80% of U.S. BTC and ETH ETF assets as of the end of Q2.
Crypto as a Financial Service: Once users bring assets onto Coinbase, the next step is putting those assets
to work in ways that mirror and improve on traditional financial services. In Q2, we continued building this new
financial system, launching products that make crypto more usable in everyday life.
Financing: Powering Liquidity Across the Crypto Economy
•Prime Financing hits record highs: In Q2 we saw all-time high in average loan balances, fueled by
growing demand from corporates, miners, and market makers, on top of longstanding activity and
success with hedge funds, asset managers, and others resulting in a more diversified loan book. We
continue to see this business drive our institutional flywheel as 16 of our top 25 institutional clients by
revenue are actively using our financing products.
•Retail crypto-backed loans gaining traction: Earlier this year we launched instant BTC-backed loans in
the Coinbase app allowing users to borrow up to $1 million in USDC. Powered by the Morpho protocol
and Base Chain, loans settle instantly and integrate seamlessly with Coinbase’s broader product
suite. We’ve now surpassed $1 billion in open loan collateral, showing strong product-market fit and
growing user appetite for onchain financing tools.
Building a Full-Stack Stablecoin Payments Platform
•We announced the pilot of Coinbase Business, our new platform for startups and small businesses
offering a secure, compliant way to send and receive crypto payments, manage crypto assets, and
automate financial workflows all from a single account. We’re seeing great early traction with 3,700+
businesses joining the Coinbase Business waitlist.
•USDC payments on Base Chain are now live in Shopify Payments, with full rollout to all stores
planned later this year. This integration enables existing Shopify merchants to accept USDC payments
from their customers. Shopify plans to provide customers in the U.S. with 1% rewards when paying
with USDC.
10
Coinbase One: Boosting Value and Increasing Options for Members
•In Q2, we introduced Coinbase One Basic, our $4.99/month subscription plan, to make the full bundle
of benefits (including zero-fee trading, boosted rewards, onchain benefits, and early access to
Coinbase One Card, among others) accessible to more users. While still early, we’re seeing strong
demand from new subscribers, both in the U.S. and internationally.
•At our State of Crypto conference we also unveiled the Coinbase One Card, a sleek, everyday
spending card that lets Coinbase One subscribers earn up to 4% back in bitcoin on every purchase,
powered by the American Express® network. While still early, we’ve seen great early interest, creating
a powerful funnel for Coinbase One growth. We plan to begin making the card available to subscribers
in the second half of this year.
Staking: Strengthening User Engagement with Simple, Compliant Access
•We launched One-Click Staking to simplify the user experience, resulting in a significant uplift in
staking volumes.
•Regulatory tailwinds are beginning to play out—South Carolina dropped its lawsuit enabling us to re-
enable staking services.
Crypto as an App Platform: The next chapter of crypto adoption is about more than financial services. It is
about powering a new generation of onchain applications. This onchain app platform starts with Base Chain, a
lightning-fast and low-cost network delivering sub-second, sub-cent transactions at scale. Next digital money
with stablecoins, which enable seamless and trusted payments across the ecosystem. And it comes to life in
the Base App, the front door to everything onchain; an all in one hub where builders launch and users explore
apps across trading, social, payments, messaging, games, and more.
Base Chain: Fast, Cheap, Open, and Decentralized.
•Continued growth in transactions Q/Q, driven by trading, social, payments, and lending apps.
•Millicents and milliseconds: cemented Base Chain’s standing as the fastest, cheapest L2 as we drove
median fees down to $0.0005; and we reduced block times to 200ms.
•Reached Stage 1 decentralization by launching permissionless fault proofs and adding a security
council to implement upgrades, an important step toward a more open, global onchain economy.
•Institutional adoption: J.P. Morgan launched a pilot of its USD-backed deposit token (JPMD) on Base
Chain.
Stablecoins: Trusted Onchain Money
•The global stablecoin market cap has now reached over $265 billion, growing for the fourth
consecutive quarter.
•Cross-border payments are one of the most compelling use cases for stablecoins, representing a $40
trillion global market opportunity.
•Base Chain remains a key driver of USDC distribution, over 90% of peer-to-peer transaction volume
on Base was with USDC in Q2.
•Continued integration across our global products including Coinbase Business, Base Chain, and the
Base App is expanding stablecoin utility and reinforcing our platform flywheel.
11
Base App: The app for everything onchain
•Base App recently went into beta featuring a redesigned consumer experience that brings wallet
functionality together with onchain trading, payments, social, messaging, and apps—all in one place.
•Key features include:
◦Social Feed: A new kind of social experience where users fully own their content and get paid
for engagement. This solves the problem of creator monetization and data ownership on
traditional platforms. Powered by Farcaster and Zora.
◦Trading and Payments: Buy, sell, send, and explore millions of tokens 24/7, all while
maintaining full control of assets through a self-custody smart wallet. This removes reliance
on intermediaries and enables global, permissionless finance.
◦Mini Apps: Onchain apps that run seamlessly inside the social feed and messages. This
eliminates the friction of switching apps or creating new accounts, delivering a truly native
mobile onchain experience.
◦Base Account: A smart wallet and universal onchain identity that enables one-click login and
consistent use across apps and chains. This solves the fragmented wallet and identity
experience that has slowed broader crypto adoption.
◦Base Pay: An express checkout for stablecoin payments, now live on Shopify. This makes it
easy for merchants and developers to integrate faster, cheaper global payments with crypto.
12
Significant progress in policy and regulatory clarity.
Chapter 3
We see increasing momentum for the industry in the U.S. After years of ambiguity, lawmakers and regulators
are embracing thoughtful, pro-innovation frameworks to govern the next era of financial infrastructure. This is
critical for global alignment: from Washington to Luxembourg, we're working to ensure that crypto rules are
clear, fair, and globally competitive.
GENIUS Act Becomes Law: A Defining Milestone for Stablecoin Regulation
•The GENIUS Act was signed into law, the first-ever U.S. federal legislation for digital assets. It
establishes clear rules for USD stablecoin issuers and custodians, paving the way for broader
stablecoin adoption.
CLARITY Act passed by the House: Setting Out a Market Structure Framework for Digital Assets and
Crypto Intermediaries
•The CLARITY Act passed the House with even broader bipartisan support than FIT 21, underscoring
that crypto is one of the most bipartisan issues in Washington today.
•Together with GENIUS, these laws provide the regulatory framework for stablecoins and tokenized
assets, unlocking new market opportunities for Coinbase and reinforcing U.S. leadership in digital
finance and innovation.
International Leadership: MiCA License Secured in Luxembourg
•Coinbase secured its MiCA license in Luxembourg in June authorizing our core retail and institutional
services across 30 EEA member states.
•GENIUS is already influencing global policymakers, particularly in Europe, where concerns around
dollarization are pushing regulators to reassess their own stablecoin efforts.
Litigation: Defending Innovation and Clarity Through the Courts
•While there has been significant bipartisan progress at the federal level on regulatory clarity, a few
states are still pursuing a patchwork approach to crypto regulation. In April, Oregon sued Coinbase in
a largely copycat of the SEC’s action, which the SEC dismissed with prejudice. And five states (CA,
MD, NJ, WA, WI) continue pursuing actions related to our staking services, despite five other states
dismissing similar actions and recent SEC guidance that staking services like ours are not securities.
We continue to engage with regulators, while fighting those misguided state actions.
13
Q3’25 Outlook
Chapter 4
Coinbase Q3 2025 Outlook | ||||
METRIC | OUTLOOK | |||
Subscription and Services Revenue | $665-$745 million | |||
Transaction Expenses | Mid-Teens as a percentage of net revenue Dependent on revenue mix | |||
Technology & Development + General & Administrative Expenses | $800-$850 million Including ~$210 million in stock-based compensation | |||
Sales and Marketing Expenses | $190-$290 million Including ~$15 million in stock-based compensation | |||
Transaction Revenue
We anticipate July transaction revenue to be approximately $360 million. As always, we continue to urge
caution in extrapolating these results.
Subscription and Services Revenue
We expect Q3 subscription and services revenue to be within $665-$745 million. We expect Q/Q growth to be
driven primarily by 1) higher average crypto asset prices (Q3 to date, we have already observed ETH up 45%
and SOL up 14% as compared to their Q2 average prices) and 2) stablecoin revenue, as USDC market
capitalization reached an all-time high in July.
Expenses
We expect technology & development and general & administrative expenses to be between $800-$850
million. The sequential increase is driven by headcount, which is growing at a higher rate in Q3 than it did in
Q2. The opportunities for growth have expanded substantially with increased regulatory clarity. We are taking
this opportunity to grow headcount in exciting areas we expect to become meaningful in the future, including
international expansion and new product initiatives while also fortifying our customer support and security
functions as part of our commitment to being the most trusted cryptocurrency exchange. The breadth of the
range reflects current market volatility which has an impact on certain variable expenses including customer
support and infrastructure costs.
Sales and marketing expenses are expected to be in the range of $190-$290 million. We continue to monitor
current market conditions and expect additional opportunities to continue to invest in marketing initiatives
through the rest of the quarter. Where we fall within the range will largely be determined by 1) whether we
continue to see attractive performance marketing opportunities throughout the remainder of Q3, which have
historically largely correlated with market volatility and asset prices and 2) USDC balances in Coinbase
products, which drive USDC rewards.
This outlook does not include costs related to our acquisition of Deribit.
Webcast Information
We will host a conference call to discuss the results for the second quarter 2025 on July 31, 2025 at 2:30 pm
PT. The live webcast of the call will be available at youtube.com/@coinbase/streams. A replay of the call, as
well as a transcript, will be available on our Investor Relations website at investor.coinbase.com.
14
Forward-Looking Statements
This communication contains forward-looking statements within the meaning of the Private Securities Litigation Reform Act of
1995. All statements other than statements of historical fact are forward-looking statements. These statements include, but are
not limited to, statements regarding our future operating results and financial position, including for the third quarter ending
September 30, 2025; anticipated future expenses and investments; the expected timing for completion, benefits, and impacts of
our proposed acquisition of Deribit; expectations relating to certain of our key financial and operating metrics; our business
strategy and plans; expectations relating to legal and regulatory proceedings; expectations relating to our industry, the regulatory
environment, market conditions, trends and growth; expectations relating to customer behaviors and preferences; our market
position; potential market opportunities; and our objectives for future operations. The words “believe,” “may,” “will,” “estimate,”
“potential,” “continue,” “anticipate,” “intend,” “expect,” “could,” “would,” “project,” “plan,” “target,” and similar expressions are
intended to identify forward-looking statements. Forward-looking statements are based on management’s expectations,
assumptions, and projections based on information available at the time the statements were made. These forward-looking
statements are subject to a number of risks, uncertainties, and assumptions, including, among others: our ability to successfully
execute our business and growth strategy and generate future profitability; market acceptance of our products and services; our
ability to further penetrate our existing customer base and expand our customer base; our ability to develop new products and
services; our ability to expand internationally; failure to obtain applicable regulatory approvals and satisfy other closing conditions
in a timely manner or otherwise for any acquisition we make, including Deribit; the success of any acquisitions or investments that
we make; the effects of increased competition in our markets; our ability to stay in compliance with applicable laws and
regulations; stock price fluctuations; market conditions across the cryptoeconomy, including crypto asset price volatility; and
general market, political, and economic conditions, including interest rate fluctuations, inflation, tariffs, instability in the global
banking system, economic downturns, and other global events, including regional wars and conflicts and government shutdowns.
It is not possible for our management to predict all risks, nor can we assess the impact of all factors on our business or the extent
to which any factor, or combination of factors, may cause actual results to differ materially from those contained in any forward-
looking statements we may make. In light of these risks, uncertainties, and assumptions, our actual results could differ materially
and adversely from those anticipated or implied in the forward-looking statements. Further information on risks that could cause
actual results to differ materially from forecasted results are, or will be included, in our filings we make with the Securities and
Exchange Commission (SEC) from time to time, including our Quarterly Report on Form 10-Q for the quarter ended June 30,
2025 filed with the SEC on July 31, 2025. Except as required by law, we assume no obligation to update these forward-looking
statements, or to update the reasons if actual results differ materially from those anticipated in the forward-looking statements.
Non-GAAP Financial Measures
Adjusted EBITDA
In addition to our results determined in accordance with GAAP, we believe Adjusted EBITDA, a non-GAAP financial performance
measure, is useful information to help investors evaluate our operating performance because it: enables investors to compare
this measure and component adjustments to similar information provided by peer companies and our past financial performance;
provides additional company-specific adjustments for certain items that may be included in income from operations but that we do
not consider to be normal, recurring, operating expenses (or income) necessary to operate our business given our operations,
revenue generating activities, business strategy, industry, and regulatory environment; and provides investors with visibility to a
measure management uses to evaluate our ongoing operations and for internal planning and forecasting purposes. For example:
•We believe it is useful to exclude certain non-cash expenses, such as depreciation and amortization and stock-based
compensation, from Adjusted EBITDA because the amounts of such expenses can vary significantly from period to
period and may not directly correlate to the underlying performance of our business operations.
•We believe it is useful to exclude certain items that we do not consider to be normal, recurring, cash operating expenses
and therefore, not reflective of our ongoing business operations. For example, we exclude: (i) other (income) expense,
net, as the income and expenses recognized in this line item are not part of our core operating activities and are
considered non-operating activities under GAAP, (ii) gains and losses on crypto assets held for investment because
15
such investments are considered primarily long-term holdings, and (iii) losses directly related to the data theft incident
announced on the Current Report on Form 8-K we filed with the SEC on May 15, 2025 (the “Data Theft Incident”),
including voluntary customer reimbursements, direct legal costs, and reward payments, if any, in connection with the
threat actor’s arrest and conviction. We do not plan on engaging in regular trading of crypto assets, and, as an operating
company, our investing activities in crypto are not part of our revenue generating activities, which are based on
transactions on our platform and the sales of subscriptions and services.
•We believe Adjusted EBITDA is useful to measure a company’s operating performance without regard to items such as
stock-based compensation expense, depreciation and amortization expense, interest expense, other (income) expense,
net, and provision for (benefit from) income taxes that can vary substantially from company to company depending upon
their financing, capital structures, and the method by which assets were acquired.
Adjusted Net Income and Adjusted Net Income per Share
In addition to our results determined in accordance with GAAP, we believe that Adjusted Net Income and Adjusted Net Income
per Share, both non-GAAP financial performance measures, are useful information to help investors evaluate our operating
performance. We believe it is useful to exclude tax-effected gains and losses on crypto assets held for investment from both
Adjusted Net Income and Adjusted Net Income per Share because (i) such investments are considered primarily long-term
holdings, (ii) we do not plan on engaging in regular trading of crypto assets, and, (iii) as an operating company, our investing
activities in crypto are not part of our revenue generating activities, which are based on transactions on our platform and the sales
of subscriptions and services. Additionally, we believe it is useful to exclude tax-effected gains and losses on our strategic
investments from Adjusted Net Income and Adjusted Net Income per Share because such investments are not part of our core
operating activities and are considered non-operating activities under GAAP.
Limitations of Non-GAAP Financial Measures
We believe that non-GAAP financial measures may be helpful to investors for the reasons noted above. However, non-GAAP
financial measures are presented for supplemental informational purposes only, have limitations as analytical tools, and should
not be considered in isolation or as a substitute for financial information presented in accordance with GAAP. In addition, other
companies, including companies in our industry, may calculate non-GAAP financial measures differently or may use other
measures to evaluate their performance, all of which could reduce the usefulness of our disclosure of non-GAAP financial
measures as a tool for comparison.
Adjusted EBITDA
There are a number of limitations related to Adjusted EBITDA rather than net income, which is the nearest GAAP equivalent of
Adjusted EBITDA. Some of these limitations are that Adjusted EBITDA excludes:
•provision for (benefit from) income taxes;
•interest expense, or the cash requirements necessary to service interest or principal payments on our debt, which
reduces cash available to us;
•depreciation and amortization expense and, although these are non-cash expenses, the assets being depreciated and
amortized may have to be replaced in the future;
•stock-based compensation expense, which has been, and will continue to be for the foreseeable future, a significant
recurring expense for our business and an important part of our compensation strategy;
•losses directly related to the Data Theft Incident;
•net gains or losses on our crypto assets held for investment; and
16
•other (income) expense, net, which represents net gains or losses on strategic investments and other financial
instruments, and other non-operating income and expense activity.
Adjusted Net Income and Adjusted Net Income per Share
There are limitations related to Adjusted Net Income and Adjusted Net Income per Share rather than net income and net income
per share, which are the nearest GAAP equivalents, respectively, including that Adjusted Net Income and Adjusted Net Income
per Share each exclude the tax-effected impact of our crypto investment gains/losses and of our strategic investments gains/
losses.
Additional Information
For more information, including reconciliations of these non-GAAP financial measures to their nearest GAAP equivalents, please
see the reconciliation of GAAP to non-GAAP results tables in this shareholder letter. Investors are encouraged to review the
related GAAP financial measure and the reconciliations, and not to rely on any single financial measure to evaluate our business.
17
Coinbase Global, Inc.
Condensed Consolidated Balance Sheets
(In thousands, except per share data)
(unaudited)
June 30, | December 31, | ||
2025 | 2024 | ||
Assets | |||
Current assets: | |||
Cash and cash equivalents ............................................................................................. | $7,539,388 | $8,543,903 | |
Restricted cash and cash equivalents .......................................................................... | 69,190 | 38,519 | |
USDC ................................................................................................................................. | 2,153,824 | 1,241,808 | |
Customer custodial funds ............................................................................................... | 5,121,640 | 6,158,949 | |
Crypto assets held for operations .................................................................................. | 125,974 | 82,781 | |
Loan receivables .............................................................................................................. | 803,366 | 475,370 | |
Crypto assets held as collateral ..................................................................................... | 951,272 | 767,484 | |
Crypto assets borrowed .................................................................................................. | 223,620 | 261,052 | |
Accounts receivable, net ................................................................................................. | 222,996 | 265,251 | |
Other current assets ........................................................................................................ | 279,230 | 277,536 | |
Total current assets ..................................................................................................... | 17,490,500 | 18,112,653 | |
Crypto assets held for investment ....................................................................................... | 1,838,887 | 1,552,995 | |
Strategic investments ............................................................................................................ | 1,933,843 | 374,161 | |
Deferred tax assets ............................................................................................................... | 541,354 | 941,298 | |
Goodwill ................................................................................................................................... | 1,153,621 | 1,139,670 | |
Other non-current assets ...................................................................................................... | 517,833 | 421,174 | |
Total assets ............................................................................................................. | $23,476,038 | $22,541,951 | |
Liabilities and Stockholders’ Equity | |||
Current liabilities: | |||
Customer custodial fund liabilities ................................................................................. | $5,121,640 | $6,158,949 | |
Current portion of long-term debt ................................................................................... | 1,266,577 | — | |
Crypto asset borrowings ................................................................................................. | 268,550 | 300,110 | |
Obligation to return collateral ......................................................................................... | 972,661 | 792,125 | |
Accrued expenses and other current liabilities ............................................................ | 601,354 | 690,136 | |
Total current liabilities ................................................................................................. | 8,230,782 | 7,941,320 | |
Long-term debt ....................................................................................................................... | 2,973,545 | 4,234,081 | |
Other non-current liabilities .................................................................................................. | 176,822 | 89,708 | |
Total liabilities ............................................................................................................... | 11,381,149 | 12,265,109 | |
Commitments and contingencies | |||
Stockholders’ equity: | |||
Preferred stock, $0.00001 par value; 500,000 shares authorized and zero shares issued and outstanding at each of June 30, 2025 and December 31, 2024 .................................................................................................................................... | — | — | |
Class A common stock, $0.00001 par value; 10,000,000 shares authorized at June 30, 2025 and December 31, 2024; 213,840 and 209,762 shares issued and outstanding at June 30, 2025 and December 31, 2024, respectively .............. | 2 | 2 | |
Class B common stock, $0.00001 par value; 500,000 shares authorized at June 30, 2025 and December 31, 2024; 42,593 and 43,878 shares issued and outstanding at June 30, 2025 and December 31, 2024, respectively ...................... | — | — | |
Additional paid-in capital ................................................................................................. | 5,639,538 | 5,365,990 | |
Accumulated other comprehensive loss ....................................................................... | (60) | (50,051) | |
Retained earnings ............................................................................................................ | 6,455,409 | 4,960,901 | |
Total stockholders’ equity ........................................................................................... | 12,094,889 | 10,276,842 | |
Total liabilities and stockholders’ equity ............................................................. | $23,476,038 | $22,541,951 |
18
Coinbase Global, Inc.
Condensed Consolidated Statements of Operations
(In thousands, except per share data)
(unaudited)
Three Months Ended June 30, | Six Months Ended June 30, | ||||||
2025 | 2024 | 2025 | 2024 | ||||
Revenue: | |||||||
Net revenue ......................................................................................... | $1,420,096 | $1,379,942 | $3,380,415 | $2,967,619 | |||
Other revenue ..................................................................................... | 77,112 | 69,686 | 151,088 | 119,579 | |||
Total revenue .................................................................................. | 1,497,208 | 1,449,628 | 3,531,503 | 3,087,198 | |||
Operating expenses: | |||||||
Transaction expense .......................................................................... | 245,261 | 191,477 | 548,287 | 408,884 | |||
Technology and development ........................................................... | 387,322 | 364,258 | 742,690 | 722,121 | |||
Sales and marketing .......................................................................... | 236,245 | 165,262 | 483,528 | 263,847 | |||
General and administrative ............................................................... | 353,707 | 320,115 | 748,053 | 607,351 | |||
(Gains) losses on crypto assets held for operations, net ............. | (8,702) | 31,016 | 25,663 | (55,342) | |||
Other operating expense, net ........................................................... | 308,025 | 34,383 | 302,126 | 36,759 | |||
Total operating expenses ............................................................. | 1,521,858 | 1,106,511 | 2,850,347 | 1,983,620 | |||
Operating (loss) income ............................................................... | (24,650) | 343,117 | 681,156 | 1,103,578 | |||
Interest expense ....................................................................................... | 20,535 | 20,507 | 41,046 | 39,578 | |||
(Gains) losses on crypto assets held for investment, net .................. | (362,053) | 319,020 | 234,598 | (331,409) | |||
Other (income) expense, net .................................................................. | (1,506,905) | 63,827 | (1,500,717) | 18,222 | |||
Income (loss) before income taxes ............................................ | 1,823,773 | (60,237) | 1,906,229 | 1,377,187 | |||
Provision for (benefit from) income taxes ............................................ | 394,873 | (96,387) | 411,721 | 164,792 | |||
Net income ..................................................................................... | $1,428,900 | $36,150 | $1,494,508 | $1,212,395 | |||
Net income attributable to common stockholders: | |||||||
Basic ..................................................................................................... | $1,428,900 | $36,127 | $1,494,508 | $1,211,611 | |||
Diluted .................................................................................................. | $1,432,511 | $36,128 | $1,501,717 | $1,217,829 | |||
Net income per share: | |||||||
Basic ..................................................................................................... | $5.60 | $0.15 | $5.87 | $4.95 | |||
Diluted .................................................................................................. | $5.14 | $0.14 | $5.39 | $4.49 | |||
Weighted-average shares of common stock used to compute net income per share: | |||||||
Basic ..................................................................................................... | 255,188 | 246,298 | 254,537 | 244,546 | |||
Diluted .................................................................................................. | 278,913 | 266,831 | 278,700 | 271,003 | |||
Stock-based Compensation Expense
Three Months Ended June 30, | Six Months Ended June 30, | ||||||
2025 | 2024 | 2025 | 2024 | ||||
Technology and development ......................................................... | $117,240 | $133,622 | $225,332 | $273,452 | |||
Sales and marketing ......................................................................... | 14,533 | 16,691 | 29,438 | 33,314 | |||
General and administrative ............................................................. | 64,387 | 67,621 | 132,119 | 135,672 | |||
Total stock-based compensation expense ................................. | $196,160 | $217,934 | $386,889 | $442,438 | |||
19
Coinbase Global, Inc.
Condensed Consolidated Statements of Cash Flows
(In thousands)
(unaudited)
Six Months Ended June 30, | |||
2025 | 2024 | ||
Cash flows from operating activities | |||
Net income ............................................................................................................................... | $1,494,508 | $1,212,395 | |
Adjustments to reconcile net income to net cash provided by operating activities: | |||
Depreciation and amortization ........................................................................................... | 67,234 | 63,828 | |
Stock-based compensation expense ................................................................................ | 386,889 | 442,438 | |
Deferred income taxes ........................................................................................................ | 399,971 | 83,961 | |
Losses (gains) on crypto assets held for operations, net .............................................. | 25,663 | (55,342) | |
Losses (gains) on crypto assets held for investment, net .............................................. | 234,598 | (331,409) | |
(Gains) losses on strategic investments, net ................................................................... | (1,475,448) | 14,663 | |
Other operating activities, net ............................................................................................. | 48,582 | 32,782 | |
Net changes in operating assets and liabilities ............................................................... | (1,036,250) | (567,634) | |
Net cash provided by operating activities .............................................................................. | 145,747 | 895,682 | |
Cash flows from investing activities | |||
Fiat loans originated ............................................................................................................. | (955,488) | (808,334) | |
Proceeds from repayment of fiat loans ............................................................................. | 588,004 | 646,700 | |
Purchases of crypto assets held for investment .............................................................. | (458,728) | — | |
Dispositions of crypto assets held for investment ........................................................... | 62,443 | 52,425 | |
Other investing activities, net ............................................................................................. | (153,040) | (35,083) | |
Net cash used in investing activities ....................................................................................... | (916,809) | (144,292) | |
Cash flows from financing activities | |||
Customer custodial fund liabilities ..................................................................................... | (1,140,867) | (357,657) | |
Fiat received as collateral ................................................................................................... | 370,553 | 493,499 | |
Fiat received as collateral returned ................................................................................... | (373,804) | (243,510) | |
Taxes paid related to net share settlement of equity awards ........................................ | (201,381) | (117,225) | |
Issuance of convertible senior notes, net ......................................................................... | — | 1,246,025 | |
Purchases of capped calls .................................................................................................. | — | (104,110) | |
Other financing activities, net ............................................................................................. | 60,560 | 76,966 | |
Net cash (used in) provided by financing activities .............................................................. | (1,284,939) | 993,988 | |
Net (decrease) increase in cash, cash equivalents, and restricted cash and cash equivalents .................................................................................................................................. | (2,056,001) | 1,745,378 | |
Effect of exchange rates on cash, cash equivalents, and restricted cash and cash equivalents .................................................................................................................................. | 79,845 | (25,923) | |
Cash, cash equivalents, and restricted cash and cash equivalents, beginning of period ........................................................................................................................................... | 14,610,442 | 9,555,429 | |
Cash, cash equivalents, and restricted cash and cash equivalents, end of period ........ | $12,634,286 | $11,274,884 | |
20
Supplemental Disclosures of Cash Flow Information
Changes in operating assets and liabilities affecting cash were as follows (in thousands):
Six Months Ended June 30, | |||
2025 | 2024 | ||
USDC .................................................................................................................................. | $(947,025) | $(492,242) | |
Accounts receivable, net .................................................................................................. | 43,556 | (69,779) | |
Customer custodial funds in transit ................................................................................ | 34,997 | (5,012) | |
Income taxes, net .............................................................................................................. | (125,633) | (1,667) | |
Other current and non-current assets ............................................................................ | (117,405) | (2,971) | |
Other current and non-current liabilities ........................................................................ | 75,260 | 4,037 | |
Net changes in operating assets and liabilities ......................................................... | $(1,036,250) | $(567,634) | |
The following is a reconciliation of cash, cash equivalents, and restricted cash and cash equivalents
(in thousands):
June 30, | |||
2025 | 2024 | ||
Cash and cash equivalents .............................................................................................. | $7,539,388 | $7,225,535 | |
Restricted cash and cash equivalents ........................................................................... | 69,190 | 34,282 | |
Customer custodial cash and cash equivalents ........................................................... | 5,025,708 | 4,015,067 | |
Total cash, cash equivalents, and restricted cash and cash equivalents .............. | $12,634,286 | $11,274,884 | |
The following is a supplemental schedule of non-cash investing and financing activities (in
thousands):
Six Months Ended June 30, | |||
2025 | 2024 | ||
Crypto assets received as collateral .............................................................................. | $1,507,022 | $1,686,190 | |
Crypto assets received as collateral returned .............................................................. | 1,354,794 | 1,448,854 | |
Crypto asset loan receivables originated ...................................................................... | 1,110,482 | 837,729 | |
Crypto asset loan receivables repaid ............................................................................. | 1,145,392 | 741,500 | |
Crypto assets borrowed ................................................................................................... | 588,999 | 225,037 | |
Crypto assets borrowed repaid ....................................................................................... | 638,262 | 100,285 | |
Additions of crypto asset investments ............................................................................ | 171,645 | 1,941 | |
Cumulative-effect adjustment due to the adoption of ASU 2023-08 ......................... | — | 561,489 | |
The following is a supplemental schedule of cash paid for interest and income taxes (in thousands):
Six Months Ended June 30, | |||
2025 | 2024 | ||
Cash paid during the period for interest ........................................................................ | $35,005 | $33,424 | |
Cash paid during the period for income taxes, net of refunds ................................... | 131,310 | — | |
Cash paid during the period for income taxes (prior to ASU No. 2023-09, Improvements to Income Tax Disclosures) ................................................................... | — | 81,552 | |
21
Reconciliations of Non-GAAP Financial Measures
Reconciliation of Net Income to Adjusted EBITDA
(in thousands) | Q2’24 | Q3’24 | Q4’24 | Q1’25 | Q2’25 |
Net income ........................................................................... | $36,150 | $75,495 | $1,291,176 | $65,608 | $1,428,900 |
Adjusted to exclude the following: | |||||
(Benefit from) provision for income taxes .................. | (96,387) | (6,914) | 205,700 | 16,848 | 394,873 |
Interest expense ............................................................ | 20,507 | 20,530 | 20,537 | 20,511 | 20,535 |
Depreciation and amortization .................................... | 34,501 | 30,695 | 32,995 | 33,333 | 33,901 |
Stock-based compensation expense ......................... | 217,934 | 248,416 | 221,984 | 190,729 | 196,160 |
Data Theft Incident losses ........................................... | — | — | — | — | 306,654 |
Losses (gains) on crypto assets held for investment, net .............................................................. | 319,020 | 120,507 | (476,153) | 596,651 | (362,053) |
Other expense (income), net(1) .................................... | 63,827 | (40,105) | (7,191) | 6,188 | (1,506,905) |
Adjusted EBITDA ........................................................ | $595,552 | $448,624 | $1,289,048 | $929,868 | $512,065 |
__________________
(1)See Note 13. Other (income) expense, net to the Condensed Consolidated Financial Statements in our Quarterly Report on Form 10-Q for the
quarter ended on June 30, 2025 filed with the SEC on July 31, 2025 for additional details.
Reconciliation of Net Income to Adjusted Net Income and Net Income per Share to Adjusted Net
Income per Share
(in thousands, except per share amounts) | Q2’24 | Q3’24 | Q4’24 | Q1’25 | Q2’25 |
Net income ........................................................................... | $36,150 | $75,495 | $1,291,176 | $65,608 | $1,428,900 |
Adjusted to exclude the following: | |||||
Losses (gains) on crypto assets held for investment, net .............................................................. | 319,020 | 120,507 | (476,153) | 596,651 | (362,053) |
Losses (gains) on strategic investments, net ............ | 13,814 | 478 | (3,587) | (3,327) | (1,472,121) |
Tax effect of non-GAAP net income adjustments ..... | (74,565) | (28,674) | 119,852 | (134,821) | 438,482 |
Adjusted Net Income ............................................... | $294,419 | $167,806 | $931,288 | $524,111 | $33,208 |
Revised definition newly adjusts for: | |||||
(Losses) gains on strategic investments, net ............ | $(13,814) | $(478) | $3,587 | $3,327 | $1,472,121 |
Tax effect of non-GAAP net income adjustments related to strategic investments .................................. | 3,347 | 116 | (854) | (812) | (359,639) |
Adjusted Net Income, previous definition ............. | $283,952 | $167,444 | $934,021 | $526,626 | $1,145,690 |
Weighted-average shares outstanding used in per share calculations below: | |||||
Basic .................................................................................... | 246,298 | 248,834 | 251,506 | 253,878 | 255,188 |
Diluted .................................................................................. | 266,831 | 267,440 | 276,752 | 271,251 | 278,913 |
Net income per share(1): | |||||
Basic ..................................................................................... | $0.15 | $0.30 | $5.13 | $0.26 | $5.60 |
Diluted .................................................................................. | $0.14 | $0.28 | $4.68 | $0.24 | $5.14 |
Adjusted Net Income per Share: | |||||
Basic ..................................................................................... | $1.20 | $0.67 | $3.70 | $2.06 | $0.13 |
Diluted .................................................................................. | $1.10 | $0.63 | $3.37 | $1.93 | $0.12 |
__________________
(1)Net income per share is calculated using net income attributable to common stockholders. See Note 15. Net income per share to the
Condensed Consolidated Financial Statements in our Quarterly Report on Form 10-Q for the quarter ended on June 30, 2025 filed with the SEC
on July 31, 2025 for additional details.