The following bar chart and table below provide some indication of the risks of investing in the Fund by showing changes in the Fund’s Class L Share performance from year to year and by showing how the Fund’s Class L Share average annual returns for 1-, 5-, and 10- year periods compare with those of a broad measure of market performance. The past performance of the Fund’s Class L Shares (before and after taxes) is not necessarily an indication of how the Fund will perform in the future. Updated performance information is available at www.yorktownfunds.com and by calling toll-free 888-933-8274.
During the period covered by the bar chart, the highest return on Class L Shares for a quarter was 20.18% (quarter ended June 30, 2020) and the lowest return for a quarter was (18.33)% (quarter ended June 30, 2022). Year to date total return for Class L Shares as of March 31, 2025 was (9.64)%.
| One Year | Five Years | Ten Years | |
| Return Before Taxes - Class L Shares (APITX) | 7.34% | 6.92% | 7.25% |
| Return After-Taxes on Distributions(1) | 7.34% | 5.36% | 5.45% |
| Return After-Taxes on Distributions and Sale of Fund Shares(1) | 4.35% | 5.32% | 5.50% |
| MSCI ACWI Total Return Index(2) (reflects no deduction for fees, expenses or taxes) |
18.02% | 10.58% | 9.79% |
| MSCI ACWI SMID Cap Total Return Index(3)(4) (reflects no deduction for fees, expenses or taxes) |
9.19% | 7.10% | 7.61% |
| One Year | Five Years | Ten Years | |
| Return Before Taxes - Class A Shares (AFGGX) | 2.27% | 6.76% | 7.70% |
| One Year | Five Years | Since Inception 5/31/2013 | |
| Return Before Taxes - Institutional Class Shares (APGRX) | 8.48% | 8.02% | 8.34% |
| (1) | After-tax returns are calculated using the historical highest individual federal marginal income tax rates and do not reflect the impact of state and local taxes. Actual after-tax returns depend on an investor’s tax situation and may differ from those shown. After-tax returns shown are not relevant to investors who hold their Fund shares through tax-deferred arrangements, such as 401(k) plans or individual retirement accounts. After-Tax Returns are shown for only Class L Shares. After-tax returns for Class A and Institutional Class Shares will vary. |
| (2) | The MSCI ACWI Total Return Index is a globally diversified market capitalization-weighted index that represents the performance of large- and mid-cap stocks across both developed and emerging markets. It is designed to capture approximately 85% of the global equity market capitalization. The “Total Return” aspect means it includes reinvested dividends. |
| (3) | The MSCI ACWI SMID Cap Total Return Index is a free float-adjusted market capitalization index that is designed to measure mid- and small-cap equity performance across global developed and emerging markets. As of April 30, 2025, the MSCI ACWI SMID Cap Total Return Index consisted of the following 23 developed market country indices: Australia, Austria, Belgium, Canada, Denmark, Finland, France, Germany, Hong Kong, Ireland, Israel, Italy, Japan, Netherlands, New Zealand, Norway, Portugal, Singapore, Spain, Sweden, Switzerland, the United Kingdom and the United States. As of April 30, 2025, the MSCI ACWI SMID Cap Total Return Index consisted of the following 24 emerging market country indices: Brazil, Chile, China, Colombia, Czech Republic, Egypt, Greece, Hungary, India, Indonesia, Korea, Kuwait, Malaysia, Mexico, Peru, Philippines, Poland, Qatar, Saudi Arabia, South Africa, Taiwan, Thailand, Turkey and United Arab Emirates. |
| (4) | The prior benchmark, MSCI ACWI SMID Cap Total Return Index is shown for regulatory purposes only and will not be used for comparison going forward as it does not meet new regulatory requirements. |
The following bar chart and table below provide some indication of the risks of investing in the Fund by showing changes in the Fund’s performance from year to year and by showing how the Fund’s average annual returns for 1-, 5-, and 10-year periods compare with those of a broad measure of market performance. The Fund’s past performance (before and after taxes) is not necessarily an indication of how the Fund will perform in the future. The bar chart does not reflect sales loads. If it did, the annual total returns shown would be lower. Updated performance information is available at www.yorktownfunds.com and by calling toll-free 888-933-8274.
During the period covered by the bar chart, Class A Shares’ highest return for a quarter was 4.29% (quarter ended June 30, 2020) and the lowest return for a quarter was (4.04)% (quarter ended March 31, 2020). Class A Shares’ year to date total return as of March 31, 2025 was 2.79%.
| One Year | Five Years | Ten Years | |
| Return Before Taxes - Class A Shares (APIMX) | 2.06% | 1.27% | 1.61% |
| Return After-Taxes on Distributions(1) | 0.79% | 0.35% | 0.49% |
| Return After-Taxes on Distributions and Sale of Fund Shares(1) | 1.21% | 0.57% | 0.72% |
| Bloomberg U.S. Aggregate Bond Index(2) (reflects no deductions for fees, expenses or taxes) |
1.25% | -0.33% | 1.35% |
| ICE BofA 1-3 Year U.S. Corporate & Government Index(3)(4) (reflects no deductions for fees, expenses or taxes) |
4.47% | 1.61% | 1.65% |
| One Year | Five Years | Ten Years | |
| Return Before Taxes - Class L Shares (AFMMX) | 4.00% | 1.00% | 1.35% |
| One Year | Five Years | Since Inception 5/31/2013 | |
| Return Before Taxes - Institutional Class Shares (APIBX) | 4.68% | 1.71% | 2.22% |
| (1) | After-tax returns are calculated using the historical highest individual federal marginal income tax rates and do not reflect the impact of state and local taxes. Actual after-tax returns depend on an investor’s tax situation and may differ from those shown. After-tax returns shown are not relevant to investors who hold their Fund shares through tax-deferred arrangements, such as 401(k) plans or individual retirement accounts. After-Tax Returns are shown for only Class A Shares. After-tax returns for Class L and Institutional Class Shares will vary. |
| (2) | The Bloomberg U.S. Aggregate Bond Index is a broad base, market capitalization-weighted bond market index representing intermediate term investment grade bonds traded in the United States. Investors frequently use the index as a stand-in for measuring the performance of the U.S. bond market. |
| (3) | The prior benchmark, ICE BofA 1-3 Year U.S. Corporate & Government Index is shown for regulatory purposes only and will not be used for comparison going forward as it does not meet new regulatory requirements. |
| (4) | The ICE BofA 1-3 Year U.S. Corporate & Government Index tracks the performance of U.S. dollar denominated investment grade debt publicly issued in the U.S. domestic market, including U.S. Treasury, U.S. agency, foreign government, supranational and corporate securities. |
The following bar chart and table below provide some indication of the risks of investing in the Fund by showing changes in the Fund’s performance from year to year and by showing how the Fund’s average annual returns for 1-, 5-, and 10-year periods compare with those of a broad measure of market performance. The Fund’s past performance (before and after taxes) is not necessarily an indication of how the Fund will perform in the future. The bar chart does not reflect sales loads. If it did, the annual total returns shown would be lower. Updated performance information is available at www.yorktownfunds.com and by calling toll-free 888-933-8274.
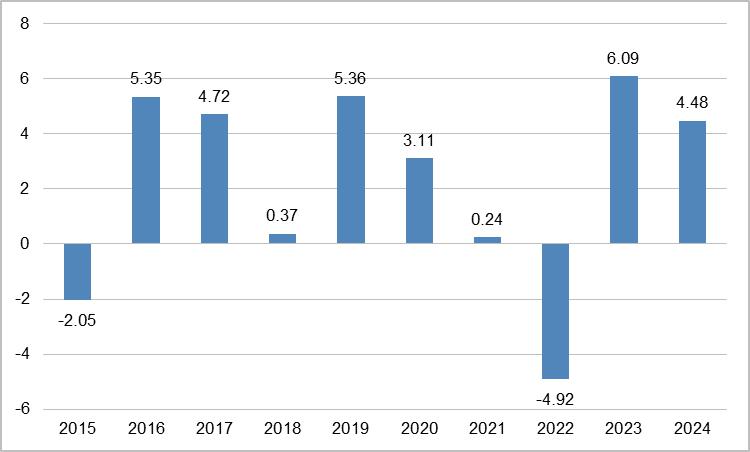
During the period covered by the bar chart, Institutional Class Shares’ highest return for a quarter was 9.00% (quarter ended March 31, 2019) and the lowest return for a quarter was (17.42)% (quarter ended March 31, 2020). Institutional Class Shares’ year to date total return as of March 31, 2025 was 6.02%.
| One Year | Five Years | Ten Years | |
| Return Before Taxes - Institutional Class Shares (APIIX) | 5.75% | 0.53% | 3.09% |
| Return After-Taxes on Distributions(1) | 3.88% | -1.19% | 0.98% |
| Return After-Taxes on Distributions and Sale of Fund Shares(1) | 3.38% | -0.34% | 1.46% |
| Bloomberg U.S. Aggregate Bond Index(2) (reflects no deduction for fee, expenses or taxes) |
1.25% | -0.33% | 1.35% |
| One Year | Five Years | Ten Years | |
| Return Before Taxes - Class A Shares (APIUX) | -0.69% | -1.14% | 1.98% |
| One Year | Five Years | Ten Years | |
| Return Before Taxes - Class L Shares (AFFIX) | 4.61% | -0.50% | 2.06% |
| (1) | After-tax returns are calculated using the historical highest individual federal marginal income tax rates and do not reflect the impact of state and local taxes. Actual after-tax returns depend on an investor’s tax situation and may differ from those shown. After-tax returns shown are not relevant to investors who hold their Fund shares through tax-deferred arrangements, such as 401(k) plans or individual retirement accounts. After-Tax Returns are shown for only Institutional Class Shares. After-tax returns for Class A and Class L Shares will vary. |
| (2) | The Bloomberg U.S. Aggregate Bond Index, is a broad base, market capitalization-weighted bond market index representing intermediate term investment grade bonds traded in the United States. Investors frequently use the index as a stand-in for measuring the performance of the U.S. bond market. |
As of the date of this Prospectus, the Fund has not yet commenced operations. When the Fund has completed a full calendar year of investment operations, this section will include charts that show annual total returns, highest and lowest quarterly returns, and average annual total returns (before and after taxes) compared to a benchmark selected for the Fund. Updated performance information will be available on the Fund’s website at www.yorktownfunds.com or by calling shareholder services at (888) 933-8274.
The following bar chart and table below provide some indication of the risks of investing in the Fund by showing changes in the Fund’s performance from year to year and by showing how the Fund’s average annual returns for 1-year, 5-year and Since Inception periods compare with those of a broad measure of market performance. The Fund’s past performance (before and after taxes) is not necessarily an indication of how the Fund will perform in the future. Updated performance information is available at www.yorktownfunds.com and by calling toll-free 888-933-8274.
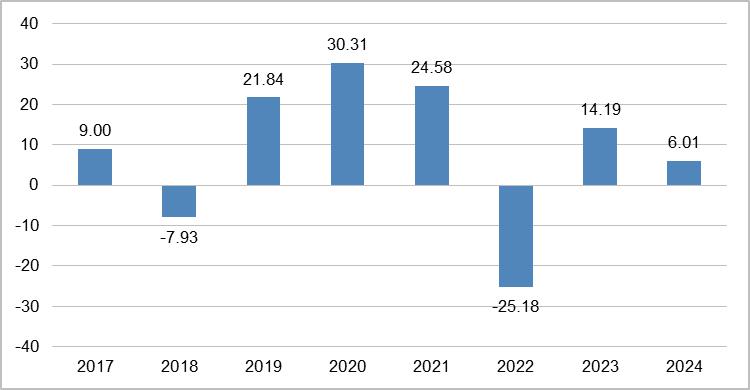
During the period covered by the bar chart, Institutional Class Shares’ highest return for a quarter was 27.62% (quarter ended June 30, 2020) and the lowest return for a quarter was (26.45)% (quarter ended March 31, 2020). Institutional Class Shares’ year to date total return as of March 31, 2025 was (7.12)%.
| One Year | Five Years | Since Inception 5/9/2016 | |
| Return Before Taxes - Institutional Class Shares (YOVIX) | 6.01% | 8.02% | 9.34% |
| Return After-Taxes on Distributions(1) | 6.01% | 7.40% | 8.39% |
| Return After-Taxes on Distributions and Sale of Fund Shares(1) | 3.56% | 6.29% | 7.36% |
| MSCI ACWI Total Return Index(2)(3) (reflects no deduction for fee, expenses or taxes) |
18.02% | 10.58% | 8.36% |
| FT Wilshire 5000 IndexSM(4)(5) | 23.76% | 14.11% | 11.12% |
| Russell 2000 Total Return Index(6)(7) | 11.54% | 7.40% |
9.80% |
| Russell 2000 Growth Total Return Index(8)(9) | 15.15% | 6.86% | 10.25% |
| One Year | Five Years | Since Inception 5/9/2016 | |
| Return Before Taxes - Class A Shares (YOVAX) | -0.38% | 6.47% | 8.34% |
| One Year | Five Years |
Since Inception 5/9/2016 | |
| Return Before Taxes - Class L Shares (YOVLX) | 4.91% | 6.94% | 8.26% |
| (1) | After-tax returns are calculated using the historical highest individual federal marginal income tax rates and do not reflect the impact of state and local taxes. Actual after-tax returns depend on an investor’s tax situation and may differ from those shown. After-tax returns shown are not relevant to investors who hold their Fund shares through tax-deferred arrangements, such as 401(k) plans or individual retirement accounts. After-Tax Returns are shown for only Institutional Class Shares. After-tax returns for Class A and Class L Shares will vary. |
| (2) | Effective March 26, 2025, the Fund’s primary benchmark Index was changed from FT Wilshire 5000 IndexSM to MSCI ACWI Total Return Index. |
| (3) | The MSCI ACWI Total Return Index is a globally diversified market capitalization-weighted index that represents the performance of large- and mid-cap stocks across both developed and emerging markets. It is designed to capture approximately 85% of the global equity market capitalization. The “Total Return” aspect means it includes reinvested dividends. |
| (4) | The prior benchmark, FT Wilshire 5000 IndexSM is shown for regulatory purposes only and will not be used for comparison going forward as it does not meet new regulatory requirements. |
| (5) | The FT Wilshire 5000 IndexSM is a broad-based market capitalization-weighted index that seeks to capture 100% of the United States investible market. |
| (6) | The Russell 2000 Total Return Index tracks the performance of approximately 2,000 small-cap U.S. companies, including the reinvestment of dividends, offering a comprehensive view of this market segment's performance. |
| (7) | The prior benchmark, Russell 2000 Total Return Index, is shown for regulatory purposes only and will not be used for comparison going forward as it does not meet new regulatory requirements. |
| (8) | The Russell 2000 Growth Total Return Index measures the performance of the small-cap growth segment of the U.S. equity market. It includes companies within the Russell 2000 that exhibit higher price-to-book ratios and higher predicted and historical growth rates. This index serves as a benchmark for investors looking to track the performance of small-cap growth stocks. |
| (9) | The prior benchmark, Russell 2000 Growth Total Return Index, is shown for regulatory purposes only and will not be used for comparison going forward as it does not meet new regulatory requirements. |