Shareholder Report
May 31, 2025
USD ($)
$ / shares
This report describes changes to the Fund that occurred during the reporting period.
WHAT WERE THE FUND COSTS FOR THE PAST YEAR? (based on a hypothetical $10,000 investment)
|
Class Name
|
Costs of a $10,000 investment
|
Costs paid as a percentage of a $10,000 investment
|
|
Class J
|
$85
|
0.82%
|
HOW DID THE FUND PERFORM LAST YEAR AND WHAT AFFECTED ITS PERFORMANCE?
For the twelve-months ended May 31, 2025, relative performance for the Jensen Quality Growth Fund was aided by overweight positions in the Industrials and Materials sector and underweights in the Energy and Real Estate sectors. Stock selection benefited relative Fund performance in the Health Care, Industrials, and Materials sectors. Relative performance was hindered by the Fund’s overweight position in the Consumer Staples, Information Technology, and Health Care sectors and underweight positions in the Consumer Discretionary, Communication Services, Financials, and Utilities sectors. Stock selection detracted from relative performance in the Consumer Discretionary, Communication Services, Consumer Staples, Financials, and the Information Technology sectors.
During the period, the strategy continued its high allocation to quality companies, as defined by the S&P Earnings and Dividend Quality Rankings. The Fund’s allocation to the highest-quality companies — those rated A+, A and A- — averaged 52.46% of portfolio assets compared to 31.74% of the S&P 500 Total Return Index. This significant overweight to quality detracted from the Fund’s relative returns during the period, which we believe were driven by increased investor appetite for risk despite increased geopolitical and trade policy uncertainty.

ANNUAL AVERAGE TOTAL RETURN (%)
|
|
1 Year
|
5 Year
|
10 Year
|
|
Class J (without sales charge)
|
8.25
|
11.78
|
11.72
|
|
S&P 500 Total Return Index
|
13.52
|
15.94
|
12.86
|
Visit https://www.jenseninvestment.com/reg-docs/ for more recent performance information.
Visit https://www.jenseninvestment.com/reg-docs/ for more recent performance information.
KEY FUND STATISTICS (as of May 31, 2025)
|
Net Assets
|
$6,090,880,950
|
|
Number of Holdings
|
28
|
|
Net Advisory Fee
|
$40,071,513
|
|
Portfolio Turnover
|
15%
|

|
Top 10 Issuers
|
(%)
|
|
Microsoft Corp.
|
8.2%
|
|
Marsh & McLennan Cos., Inc.
|
6.9%
|
|
Intuit, Inc.
|
6.6%
|
|
Stryker Corp.
|
6.5%
|
|
Apple, Inc.
|
5.6%
|
|
Alphabet, Inc.
|
5.4%
|
|
Accenture PLC
|
5.2%
|
|
Mastercard, Inc.
|
4.7%
|
|
KLA Corp.
|
4.1%
|
|
Broadridge Financial Solutions, Inc.
|
3.9%
|
This report describes changes to the Fund that occurred during the reporting period.
WHAT WERE THE FUND COSTS FOR THE PAST YEAR? (based on a hypothetical $10,000 investment)
|
Class Name
|
Costs of a $10,000 investment
|
Costs paid as a percentage of a $10,000 investment
|
|
Class I
|
$63
|
0.60%
|
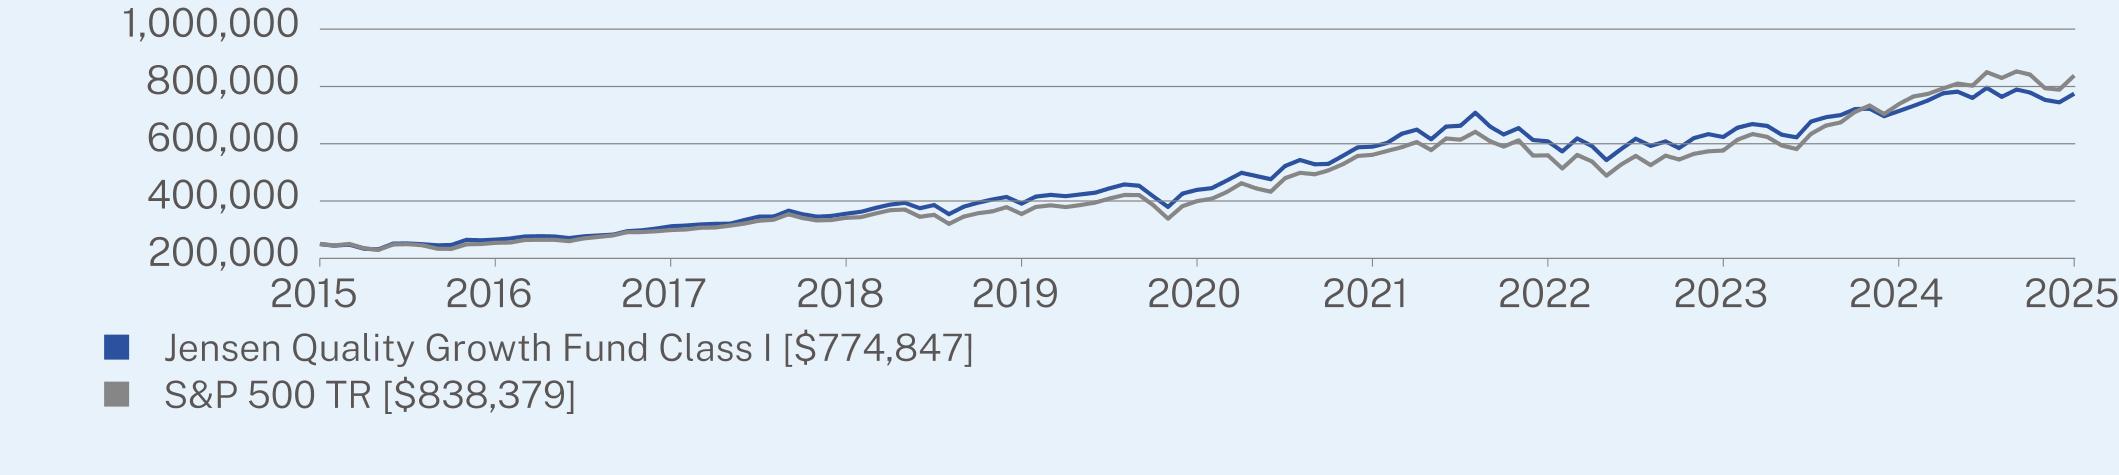
HOW DID THE FUND PERFORM LAST YEAR AND WHAT AFFECTED ITS PERFORMANCE?
For the twelve-months ended May 31, 2025, relative performance for the Jensen Quality Growth Fund was aided by overweight positions in the Industrials and Materials sector and underweights in the Energy and Real Estate sectors. Stock selection benefited relative Fund performance in the Health Care, Industrials, and Materials sectors. Relative performance was hindered by the Fund’s overweight position in the Consumer Staples, Information Technology, and Health Care sectors and underweight positions in the Consumer Discretionary, Communication Services, Financials, and Utilities sectors. Stock selection detracted from relative performance in the Consumer Discretionary, Communication Services, Consumer Staples, Financials, and the Information Technology sectors.
During the period, the strategy continued its high allocation to quality companies, as defined by the S&P Earnings and Dividend Quality Rankings. The Fund’s allocation to the highest-quality companies — those rated A+, A and A- — averaged 52.46% of portfolio assets compared to 31.74% of the S&P 500 Total Return Index. This significant overweight to quality detracted from the Fund’s relative returns during the period, which we believe were driven by increased investor appetite for risk despite increased geopolitical and trade policy uncertainty.
ANNUAL AVERAGE TOTAL RETURN (%)
|
|
1 Year
|
5 Year
|
10 Year
|
|
Class I (without sales charge)
|
8.49
|
12.02
|
11.98
|
|
S&P 500 Total Return Index
|
13.52
|
15.94
|
12.86
|
Visit https://www.jenseninvestment.com/reg-docs/ for more recent performance information.
Visit https://www.jenseninvestment.com/reg-docs/ for more recent performance information.
KEY FUND STATISTICS (as of May 31, 2025)
|
Net Assets
|
$6,090,880,950
|
|
Number of Holdings
|
28
|
|
Net Advisory Fee
|
$40,071,513
|
|
Portfolio Turnover
|
15%
|

|
Top 10 Issuers
|
(%)
|
|
Microsoft Corp.
|
8.2%
|
|
Marsh & McLennan Cos., Inc.
|
6.9%
|
|
Intuit, Inc.
|
6.6%
|
|
Stryker Corp.
|
6.5%
|
|
Apple, Inc.
|
5.6%
|
|
Alphabet, Inc.
|
5.4%
|
|
Accenture PLC
|
5.2%
|
|
Mastercard, Inc.
|
4.7%
|
|
KLA Corp.
|
4.1%
|
|
Broadridge Financial Solutions, Inc.
|
3.9%
|
This report describes changes to the Fund that occurred during the reporting period.
WHAT WERE THE FUND COSTS FOR THE PAST YEAR? (based on a hypothetical $10,000 investment)
|
Class Name
|
Costs of a $10,000 investment
|
Costs paid as a percentage of a $10,000 investment
|
|
Class R
|
$142
|
1.37%
|
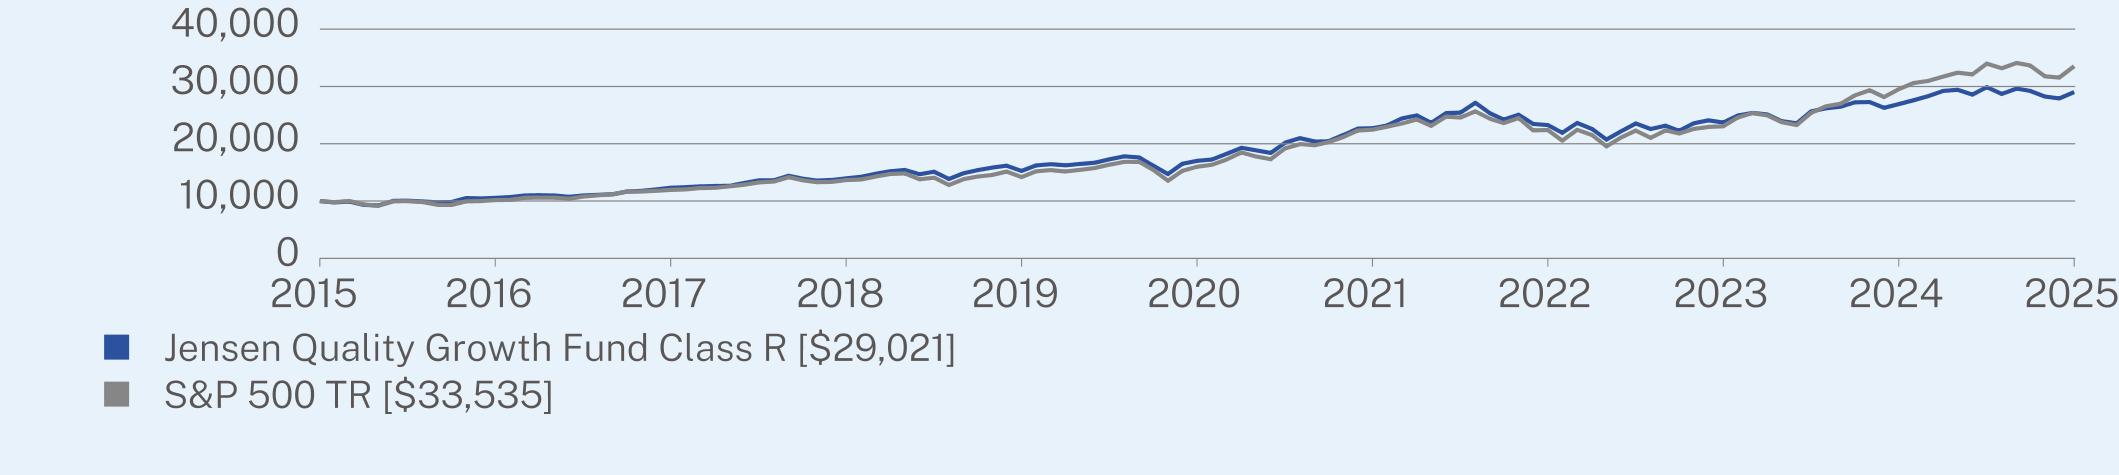
HOW DID THE FUND PERFORM LAST YEAR AND WHAT AFFECTED ITS PERFORMANCE?
For the twelve-months ended May 31, 2025, relative performance for the Jensen Quality Growth Fund was aided by overweight positions in the Industrials and Materials sector and underweights in the Energy and Real Estate sectors. Stock selection benefited relative Fund performance in the Health Care, Industrials, and Materials sectors. Relative performance was hindered by the Fund’s overweight position in the Consumer Staples, Information Technology, and Health Care sectors and underweight positions in the Consumer Discretionary, Communication Services, Financials, and Utilities sectors. Stock selection detracted from relative performance in the Consumer Discretionary, Communication Services, Consumer Staples, Financials, and the Information Technology sectors.
During the period, the strategy continued its high allocation to quality companies, as defined by the S&P Earnings and Dividend Quality Rankings. The Fund’s allocation to the highest-quality companies — those rated A+, A and A- — averaged 52.46% of portfolio assets compared to 31.74% of the S&P 500 Total Return Index. This significant overweight to quality detracted from the Fund’s relative returns during the period, which we believe were driven by increased investor appetite for risk despite increased geopolitical and trade policy uncertainty.
ANNUAL AVERAGE TOTAL RETURN (%)
|
|
1 Year
|
5 Year
|
10 Year
|
|
Class R (without sales charge)
|
7.63
|
11.22
|
11.23
|
|
S&P 500 Total Return Index
|
13.52
|
15.94
|
12.86
|
Visit https://www.jenseninvestment.com/reg-docs/ for more recent performance information.
Visit https://www.jenseninvestment.com/reg-docs/ for more recent performance information.
KEY FUND STATISTICS (as of May 31, 2025)
|
Net Assets
|
$6,090,880,950
|
|
Number of Holdings
|
28
|
|
Net Advisory Fee
|
$40,071,513
|
|
Portfolio Turnover
|
15%
|
|
Top 10 Issuers
|
(%)
|
|
Microsoft Corp.
|
8.2%
|
|
Marsh & McLennan Cos., Inc.
|
6.9%
|
|
Intuit, Inc.
|
6.6%
|
|
Stryker Corp.
|
6.5%
|
|
Apple, Inc.
|
5.6%
|
|
Alphabet, Inc.
|
5.4%
|
|
Accenture PLC
|
5.2%
|
|
Mastercard, Inc.
|
4.7%
|
|
KLA Corp.
|
4.1%
|
|
Broadridge Financial Solutions, Inc.
|
3.9%
|
This report describes changes to the Fund that occurred during the reporting period.
WHAT WERE THE FUND COSTS FOR THE PAST YEAR? (based on a hypothetical $10,000 investment)
|
Class Name
|
Costs of a $10,000 investment
|
Costs paid as a percentage of a $10,000 investment
|
|
Class Y
|
$56
|
0.54%
|
HOW DID THE FUND PERFORM LAST YEAR AND WHAT AFFECTED ITS PERFORMANCE?
For the twelve-months ended May 31, 2025, relative performance for the Jensen Quality Growth Fund was aided by overweight positions in the Industrials and Materials sector and underweights in the Energy and Real Estate sectors. Stock selection benefited relative Fund performance in the Health Care, Industrials, and Materials sectors. Relative performance was hindered by the Fund’s overweight position in the Consumer Staples, Information Technology, and Health Care sectors and underweight positions in the Consumer Discretionary, Communication Services, Financials, and Utilities sectors. Stock selection detracted from relative performance in the Consumer Discretionary, Communication Services, Consumer Staples, Financials, and the Information Technology sectors.
During the period, the strategy continued its high allocation to quality companies, as defined by the S&P Earnings and Dividend Quality Rankings. The Fund’s allocation to the highest-quality companies — those rated A+, A and A- — averaged 52.46% of portfolio assets compared to 31.74% of the S&P 500 Total Return Index. This significant overweight to quality detracted from the Fund’s relative returns during the period, which we believe were driven by increased investor appetite for risk despite increased geopolitical and trade policy uncertainty.
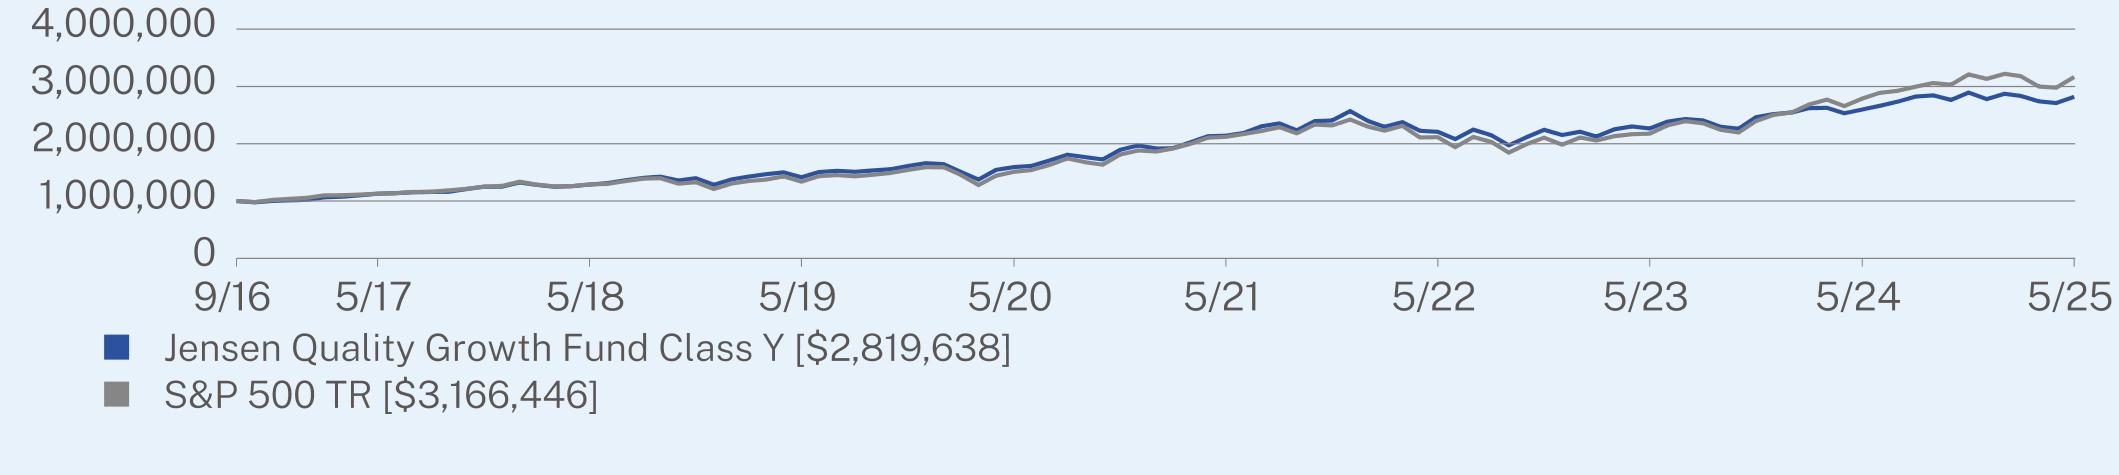
HOW DID THE FUND PERFORM SINCE INCEPTION?*
The $1,000,000 chart reflects a hypothetical $1,000,000 investment in the class of shares noted and assumes the maximum sales charge. The chart uses total return NAV performance and assumes reinvestment of dividends and capital gains. Fund expenses, including 12b-1 fees, management fees and other expenses were deducted.
ANNUAL AVERAGE TOTAL RETURN (%)
|
|
1 Year
|
5 Year
|
Since Inception
(09/30/2016) |
|
Class Y (without sales charge)
|
8.54
|
12.10
|
12.71
|
|
S&P 500 Total Return Index
|
13.52
|
15.94
|
14.23
|
Visit https://www.jenseninvestment.com/reg-docs/ for more recent performance information.
Visit https://www.jenseninvestment.com/reg-docs/ for more recent performance information.
KEY FUND STATISTICS (as of May 31, 2025)
|
Net Assets
|
$6,090,880,950
|
|
Number of Holdings
|
28
|
|
Net Advisory Fee
|
$40,071,513
|
|
Portfolio Turnover
|
15%
|

|
Top 10 Issuers
|
(%)
|
|
Microsoft Corp.
|
8.2%
|
|
Marsh & McLennan Cos., Inc.
|
6.9%
|
|
Intuit, Inc.
|
6.6%
|
|
Stryker Corp.
|
6.5%
|
|
Apple, Inc.
|
5.6%
|
|
Alphabet, Inc.
|
5.4%
|
|
Accenture PLC
|
5.2%
|
|
Mastercard, Inc.
|
4.7%
|
|
KLA Corp.
|
4.1%
|
|
Broadridge Financial Solutions, Inc.
|
3.9%
|
| [1] |
|