Shareholder Report
May 31, 2025
USD ($)
holding
May 31, 2025
USD ($)
holding
What were the fund costs for the last year? (based on a hypothetical $10,000 investment) | ||||||||
Costs of a $10,000 investment | Costs paid as a percentage of a $10,000 investment | |||||||
| Investor Class | $60 | 0.59% | ||||||
| What were the key factors that affected the fund’s performance? | |||||
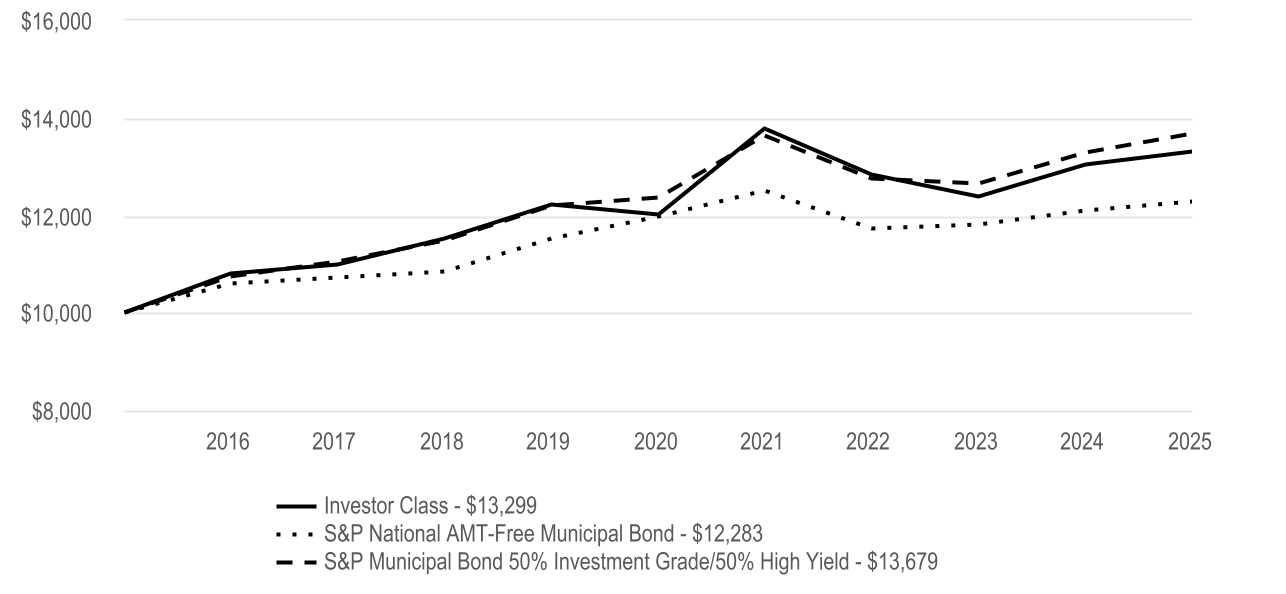
High-Yield Municipal Fund Investor Class returned 2.05% for the reporting period ended May 31, 2025. | |||||
| The fund seeks high current income that is exempt from federal income tax. The fund also seeks capital appreciation as a secondary objective. The commentary below refers to the fund's performance compared to the S&P Municipal Bond 50% Investment Grade/50% High Yield Index. | |||||
• | Interest rate volatility, trade wars and federal tax policy uncertainty were key challenges for the municipal bond market during the reporting period. Against this backdrop, security selection was the primary detractor to portfolio performance. Selections in the multifamily housing, special tax and private university sectors were among the largest detractors. Negative results in these sectors and others overwhelmed solid selection effects in the hospital and charter school sectors. | ||||
• | Yield curve effects also detracted from performance, largely due to our positioning along the curve, which favored the longer end of the municipal curve. Positive results from duration, which we managed using U.S. Treasury futures, and yield curve roll-down helped offset some of the negative positioning effects. | ||||
• | Our sector allocation decisions were broadly positive, led by an overweight position versus the index in retirement community securities. Overweights in the other tax-supported and other revenue sectors also aided results. These allocations more than offset negative results from overweights in charter schools and student housing and an underweight in single-family housing. | ||||
• | High-yield municipal bonds generally outperformed their investment-grade peers during the period. Compared with the index, which invests equally in investment-grade and high-yield municipal bonds, the portfolio ended the period with an overweight to high-yield securities, which boosted results. | ||||
Cumulative Performance (based on an initial $10,000 investment) | ||
May 31, 2015 through May 31, 2025 | ||
Average Annual Total Returns | |||||||||||
| 1 Year | 5 Year | 10 Year | |||||||||
| Investor Class | 2.05% | 2.06% | 2.89% | ||||||||
| Regulatory Index | |||||||||||
| S&P National AMT-Free Municipal Bond | 1.64% | 0.53% | 2.08% | ||||||||
| Performance Index | |||||||||||
| S&P Municipal Bond 50% Investment Grade/50% High Yield | 2.98% | 2.05% | 3.18% | ||||||||
| Fund Holdings | ||
Types of Investments in Portfolio (as a % of net assets) | |||||
| Municipal Securities | 99.3% | ||||
| Other Assets and Liabilities | 0.7% | ||||
| Fund Changes | ||
| Beginning October 2024, the total eligible investments required to qualify for a waiver of the annual account maintenance fee changed from $10,000 to $25,000. Such fee will also be waived for any accounts for which the shareholder has elected to receive electronic delivery of all fund/account documents. | ||
What were the fund costs for the last year? (based on a hypothetical $10,000 investment) | ||||||||
Costs of a $10,000 investment | Costs paid as a percentage of a $10,000 investment | |||||||
| I Class | $39 | 0.39% | ||||||
| What were the key factors that affected the fund’s performance? | |||||
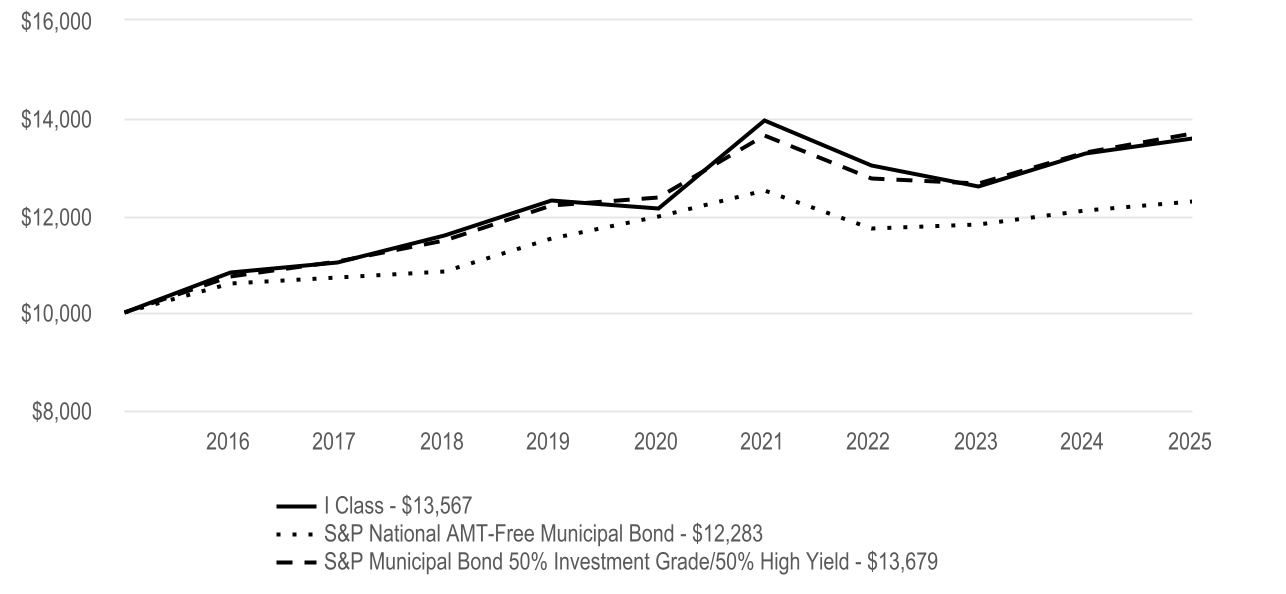
High-Yield Municipal Fund I Class returned 2.25% for the reporting period ended May 31, 2025. | |||||
| The fund seeks high current income that is exempt from federal income tax. The fund also seeks capital appreciation as a secondary objective. The commentary below refers to the fund's performance compared to the S&P Municipal Bond 50% Investment Grade/50% High Yield Index. | |||||
• | Interest rate volatility, trade wars and federal tax policy uncertainty were key challenges for the municipal bond market during the reporting period. Against this backdrop, security selection was the primary detractor to portfolio performance. Selections in the multifamily housing, special tax and private university sectors were among the largest detractors. Negative results in these sectors and others overwhelmed solid selection effects in the hospital and charter school sectors. | ||||
• | Yield curve effects also detracted from performance, largely due to our positioning along the curve, which favored the longer end of the municipal curve. Positive results from duration, which we managed using U.S. Treasury futures, and yield curve roll-down helped offset some of the negative positioning effects. | ||||
• | Our sector allocation decisions were broadly positive, led by an overweight position versus the index in retirement community securities. Overweights in the other tax-supported and other revenue sectors also aided results. These allocations more than offset negative results from overweights in charter schools and student housing and an underweight in single-family housing. | ||||
• | High-yield municipal bonds generally outperformed their investment-grade peers during the period. Compared with the index, which invests equally in investment-grade and high-yield municipal bonds, the portfolio ended the period with an overweight to high-yield securities, which boosted results. | ||||
Cumulative Performance (based on an initial $10,000 investment) | ||
May 31, 2015 through May 31, 2025 | ||
Average Annual Total Returns | |||||||||||
| 1 Year | 5 Year | 10 Year | |||||||||
| I Class | 2.25% | 2.27% | 3.10% | ||||||||
| Regulatory Index | |||||||||||
| S&P National AMT-Free Municipal Bond | 1.64% | 0.53% | 2.08% | ||||||||
| Performance Index | |||||||||||
| S&P Municipal Bond 50% Investment Grade/50% High Yield | 2.98% | 2.05% | 3.18% | ||||||||
| Fund Holdings | ||
Types of Investments in Portfolio (as a % of net assets) | |||||
| Municipal Securities | 99.3% | ||||
| Other Assets and Liabilities | 0.7% | ||||
What were the fund costs for the last year? (based on a hypothetical $10,000 investment) | ||||||||
Costs of a $10,000 investment | Costs paid as a percentage of a $10,000 investment | |||||||
| Y Class | $36 | 0.36% | ||||||
| What were the key factors that affected the fund’s performance? | |||||
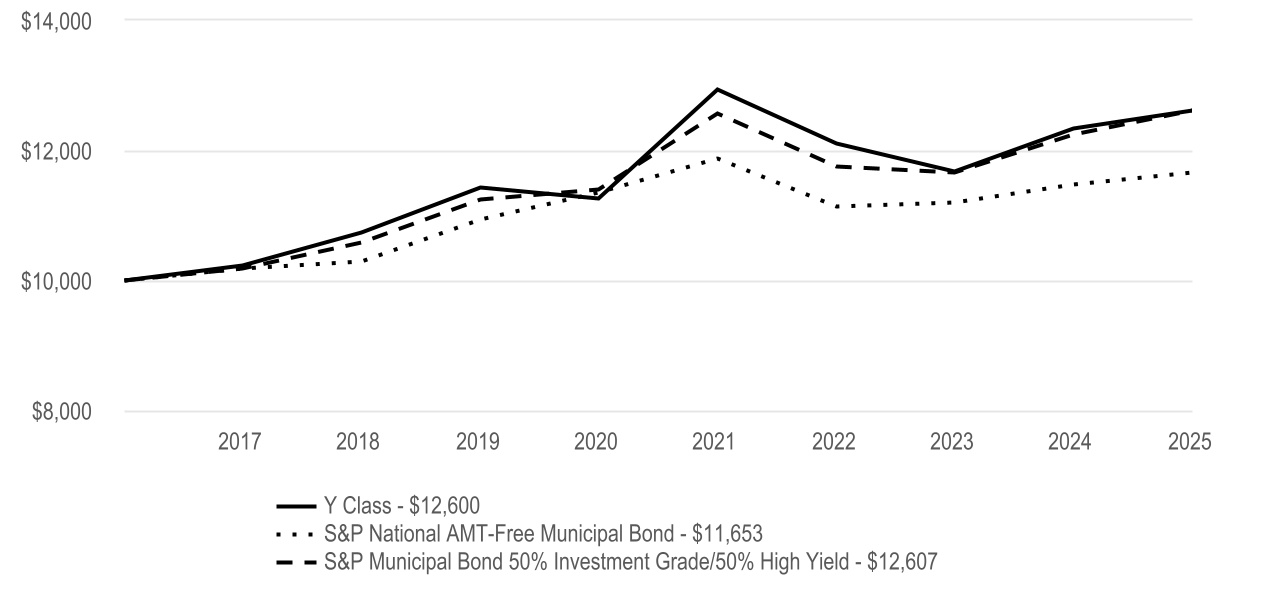
High-Yield Municipal Fund Y Class returned 2.16% for the reporting period ended May 31, 2025. | |||||
| The fund seeks high current income that is exempt from federal income tax. The fund also seeks capital appreciation as a secondary objective. The commentary below refers to the fund's performance compared to the S&P Municipal Bond 50% Investment Grade/50% High Yield Index. | |||||
• | Interest rate volatility, trade wars and federal tax policy uncertainty were key challenges for the municipal bond market during the reporting period. Against this backdrop, security selection was the primary detractor to portfolio performance. Selections in the multifamily housing, special tax and private university sectors were among the largest detractors. Negative results in these sectors and others overwhelmed solid selection effects in the hospital and charter school sectors. | ||||
• | Yield curve effects also detracted from performance, largely due to our positioning along the curve, which favored the longer end of the municipal curve. Positive results from duration, which we managed using U.S. Treasury futures, and yield curve roll-down helped offset some of the negative positioning effects. | ||||
• | Our sector allocation decisions were broadly positive, led by an overweight position versus the index in retirement community securities. Overweights in the other tax-supported and other revenue sectors also aided results. These allocations more than offset negative results from overweights in charter schools and student housing and an underweight in single-family housing. | ||||
• | High-yield municipal bonds generally outperformed their investment-grade peers during the period. Compared with the index, which invests equally in investment-grade and high-yield municipal bonds, the portfolio ended the period with an overweight to high-yield securities, which boosted results. | ||||
Cumulative Performance (based on an initial $10,000 investment) | ||
April 10, 2017 through May 31, 2025 | ||
Average Annual Total Returns | ||||||||||||||
| 1 Year | 5 Year | Since Inception | Inception Date | |||||||||||
| Y Class | 2.16% | 2.28% | 2.88% | 4/10/17 | ||||||||||
| Regulatory Index | ||||||||||||||
| S&P National AMT-Free Municipal Bond | 1.64% | 0.53% | 1.90% | — | ||||||||||
| Performance Index | ||||||||||||||
| S&P Municipal Bond 50% Investment Grade/50% High Yield | 2.98% | 2.05% | 2.88% | — | ||||||||||
| Fund Holdings | ||
Types of Investments in Portfolio (as a % of net assets) | |||||
| Municipal Securities | 99.3% | ||||
| Other Assets and Liabilities | 0.7% | ||||
What were the fund costs for the last year? (based on a hypothetical $10,000 investment) | ||||||||
Costs of a $10,000 investment | Costs paid as a percentage of a $10,000 investment | |||||||
| A Class | $85 | 0.84% | ||||||
| What were the key factors that affected the fund’s performance? | |||||
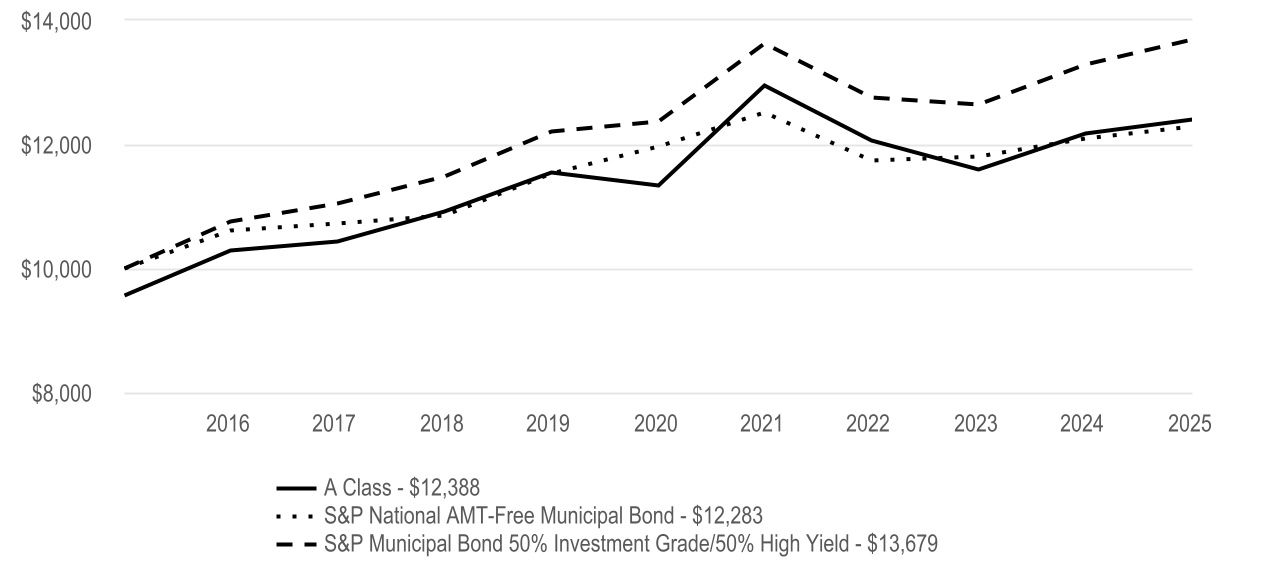
High-Yield Municipal Fund A Class returned 1.80% for the reporting period ended May 31, 2025. | |||||
| The fund seeks high current income that is exempt from federal income tax. The fund also seeks capital appreciation as a secondary objective. The commentary below refers to the fund's performance compared to the S&P Municipal Bond 50% Investment Grade/50% High Yield Index. | |||||
• | Interest rate volatility, trade wars and federal tax policy uncertainty were key challenges for the municipal bond market during the reporting period. Against this backdrop, security selection was the primary detractor to portfolio performance. Selections in the multifamily housing, special tax and private university sectors were among the largest detractors. Negative results in these sectors and others overwhelmed solid selection effects in the hospital and charter school sectors. | ||||
• | Yield curve effects also detracted from performance, largely due to our positioning along the curve, which favored the longer end of the municipal curve. Positive results from duration, which we managed using U.S. Treasury futures, and yield curve roll-down helped offset some of the negative positioning effects. | ||||
• | Our sector allocation decisions were broadly positive, led by an overweight position versus the index in retirement community securities. Overweights in the other tax-supported and other revenue sectors also aided results. These allocations more than offset negative results from overweights in charter schools and student housing and an underweight in single-family housing. | ||||
• | High-yield municipal bonds generally outperformed their investment-grade peers during the period. Compared with the index, which invests equally in investment-grade and high-yield municipal bonds, the portfolio ended the period with an overweight to high-yield securities, which boosted results. | ||||
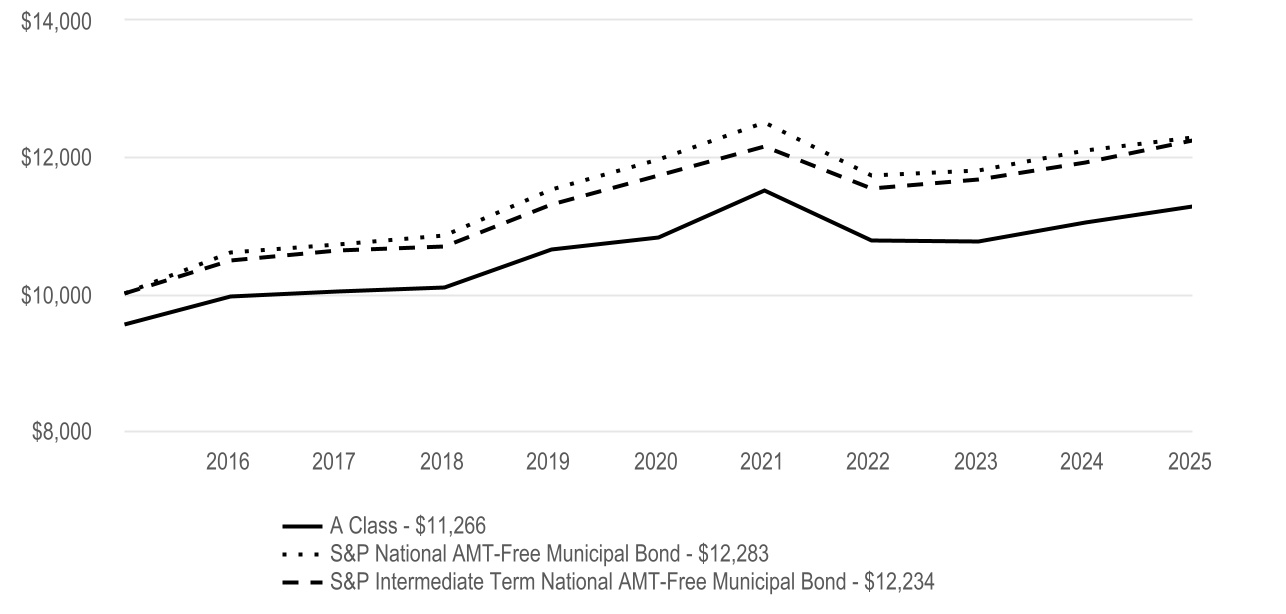
Cumulative Performance (based on an initial $10,000 investment) | ||
May 31, 2015 through May 31, 2025 | ||
The initial investment is adjusted to reflect the maximum initial sales charge. | ||
Average Annual Total Returns | |||||||||||
| 1 Year | 5 Year | 10 Year | |||||||||
| A Class | 1.80% | 1.81% | 2.64% | ||||||||
| A Class - with sales charge | -2.79% | 0.88% | 2.16% | ||||||||
| Regulatory Index | |||||||||||
| S&P National AMT-Free Municipal Bond | 1.64% | 0.53% | 2.08% | ||||||||
| Performance Index | |||||||||||
| S&P Municipal Bond 50% Investment Grade/50% High Yield | 2.98% | 2.05% | 3.18% | ||||||||
| Fund Holdings | ||
Types of Investments in Portfolio (as a % of net assets) | |||||
| Municipal Securities | 99.3% | ||||
| Other Assets and Liabilities | 0.7% | ||||
What were the fund costs for the last year? (based on a hypothetical $10,000 investment) | ||||||||
Costs of a $10,000 investment | Costs paid as a percentage of a $10,000 investment | |||||||
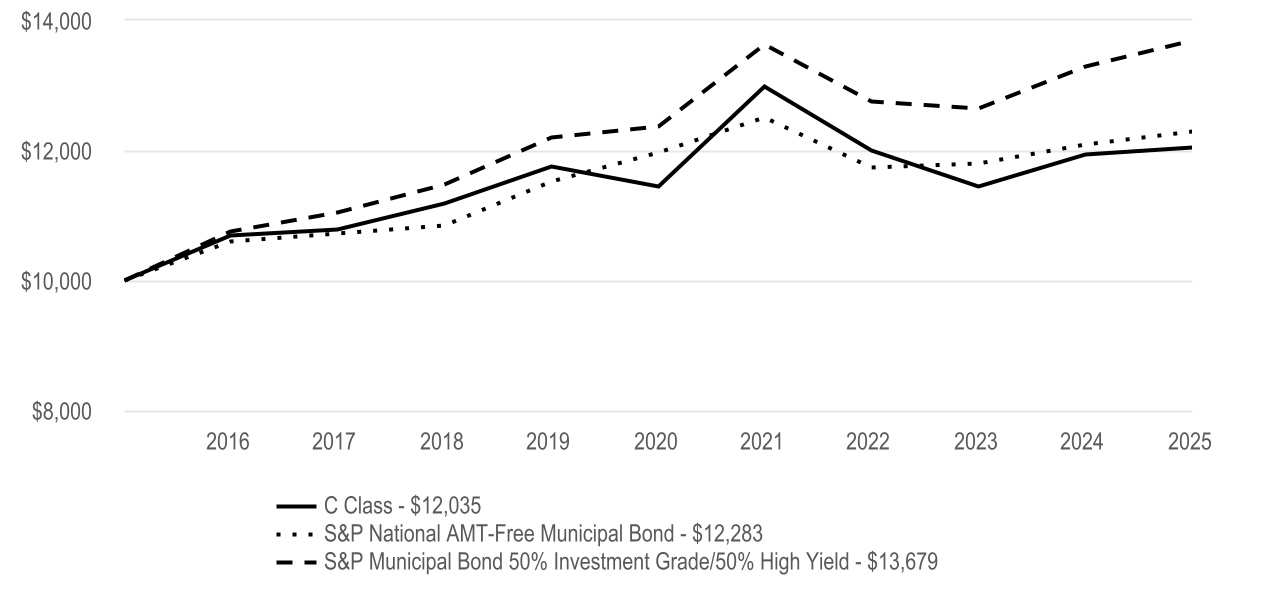
| C Class | $160 | 1.59% | ||||||
| What were the key factors that affected the fund’s performance? | |||||
High-Yield Municipal Fund C Class returned 0.92% for the reporting period ended May 31, 2025. | |||||
| The fund seeks high current income that is exempt from federal income tax. The fund also seeks capital appreciation as a secondary objective. The commentary below refers to the fund's performance compared to the S&P Municipal Bond 50% Investment Grade/50% High Yield Index. | |||||
• | Interest rate volatility, trade wars and federal tax policy uncertainty were key challenges for the municipal bond market during the reporting period. Against this backdrop, security selection was the primary detractor to portfolio performance. Selections in the multifamily housing, special tax and private university sectors were among the largest detractors. Negative results in these sectors and others overwhelmed solid selection effects in the hospital and charter school sectors. | ||||
• | Yield curve effects also detracted from performance, largely due to our positioning along the curve, which favored the longer end of the municipal curve. Positive results from duration, which we managed using U.S. Treasury futures, and yield curve roll-down helped offset some of the negative positioning effects. | ||||
• | Our sector allocation decisions were broadly positive, led by an overweight position versus the index in retirement community securities. Overweights in the other tax-supported and other revenue sectors also aided results. These allocations more than offset negative results from overweights in charter schools and student housing and an underweight in single-family housing. | ||||
• | High-yield municipal bonds generally outperformed their investment-grade peers during the period. Compared with the index, which invests equally in investment-grade and high-yield municipal bonds, the portfolio ended the period with an overweight to high-yield securities, which boosted results. | ||||
Cumulative Performance (based on an initial $10,000 investment) | ||
May 31, 2015 through May 31, 2025 | ||
Average Annual Total Returns | |||||||||||
| 1 Year | 5 Year | 10 Year | |||||||||
| C Class | 0.92% | 1.03% | 1.87% | ||||||||
| Regulatory Index | |||||||||||
| S&P National AMT-Free Municipal Bond | 1.64% | 0.53% | 2.08% | ||||||||
| Performance Index | |||||||||||
| S&P Municipal Bond 50% Investment Grade/50% High Yield | 2.98% | 2.05% | 3.18% | ||||||||
| Fund Holdings | ||
Types of Investments in Portfolio (as a % of net assets) | |||||
| Municipal Securities | 99.3% | ||||
| Other Assets and Liabilities | 0.7% | ||||
What were the fund costs for the last year? (based on a hypothetical $10,000 investment) | ||||||||
Costs of a $10,000 investment | Costs paid as a percentage of a $10,000 investment | |||||||
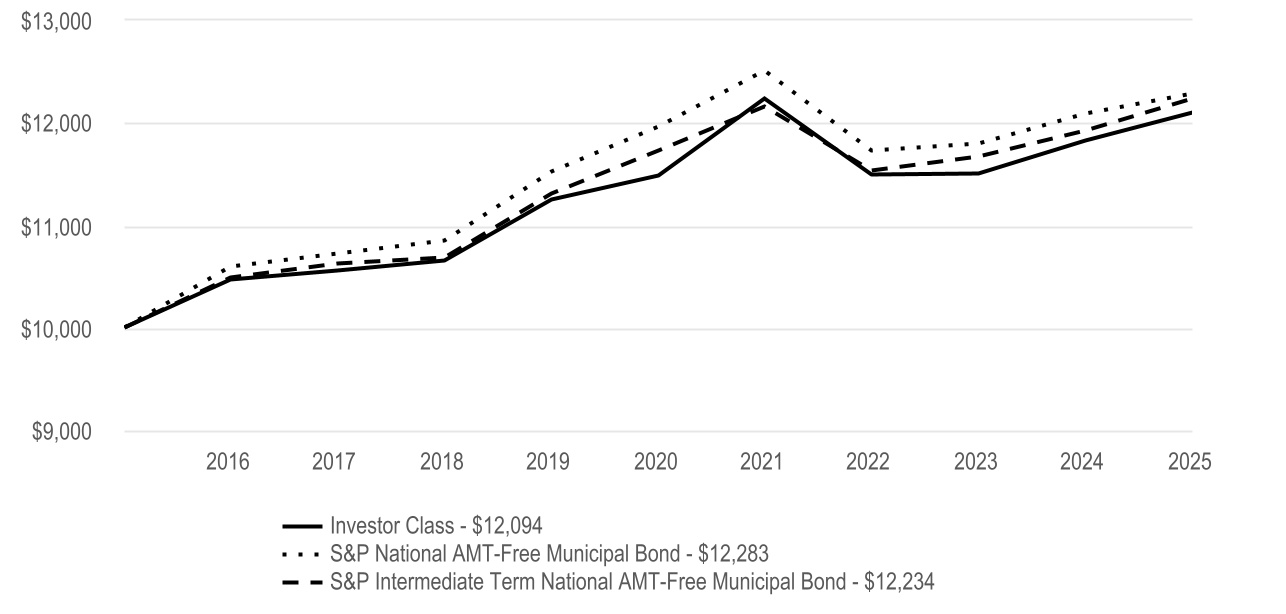
| Investor Class | $47 | 0.46% | ||||||
| What were the key factors that affected the fund’s performance? | |||||
Intermediate-Term Tax-Free Bond Fund Investor Class returned 2.27% for the reporting period ended May 31, 2025. | |||||
| The fund seeks safety of principal and high current income that is exempt from federal income tax. The comments below refer to the fund's performance compared to the S&P Intermediate Term National AMT-Free Municipal Bond Index during the period. | |||||
• | Interest rate volatility, trade wars and federal tax policy uncertainty were key challenges for the municipal bond market during the reporting period. Against this backdrop, security selection was the primary detractor to portfolio performance. Our choices in the student housing, water and sewer, and state and local general obligation (GO) sectors were among the weakest. Meanwhile, the portfolio logged positive selection results in the charter school and private university sectors. | ||||
• | Yield curve effects slightly detracted from performance, largely due to our positioning along the curve, which favored the intermediate and long portions of the municipal curve. Positive results from duration, which we managed using U.S. Treasury futures, and yield curve roll-down helped offset some of the negative positioning effects. | ||||
• | Our sector allocation decisions were broadly positive. Out-of-index positions in the hospital, industry development revenue/pollution control revenue, retirement community and multifamily housing sectors were top contributors. An underweight position versus in the index in the special tax sector also aided performance. Underweights in state GO and pre-refunded securities were the main detractors. | ||||
Cumulative Performance (based on an initial $10,000 investment) | ||
May 31, 2015 through May 31, 2025 | ||
Average Annual Total Returns | |||||||||||
| 1 Year | 5 Year | 10 Year | |||||||||
| Investor Class | 2.27% | 1.04% | 1.92% | ||||||||
| Regulatory Index | |||||||||||
| S&P National AMT-Free Municipal Bond | 1.64% | 0.53% | 2.08% | ||||||||
| Performance Index | |||||||||||
| S&P Intermediate Term National AMT-Free Municipal Bond | 2.63% | 0.86% | 2.04% | ||||||||
| Fund Holdings | ||
Types of Investments in Portfolio (as a % of net assets) | |||||
| Municipal Securities | 99.5% | ||||
| Exchange-Traded Funds | 0.5% | ||||
| Short-Term Investments | 0.0% | ||||
| Other Assets and Liabilities | 0.0% | ||||
| Fund Changes | ||
| Beginning October 2024, the total eligible investments required to qualify for a waiver of the annual account maintenance fee changed from $10,000 to $25,000. Such fee will also be waived for any accounts for which the shareholder has elected to receive electronic delivery of all fund/account documents. | ||
What were the fund costs for the last year? (based on a hypothetical $10,000 investment) | ||||||||
Costs of a $10,000 investment | Costs paid as a percentage of a $10,000 investment | |||||||
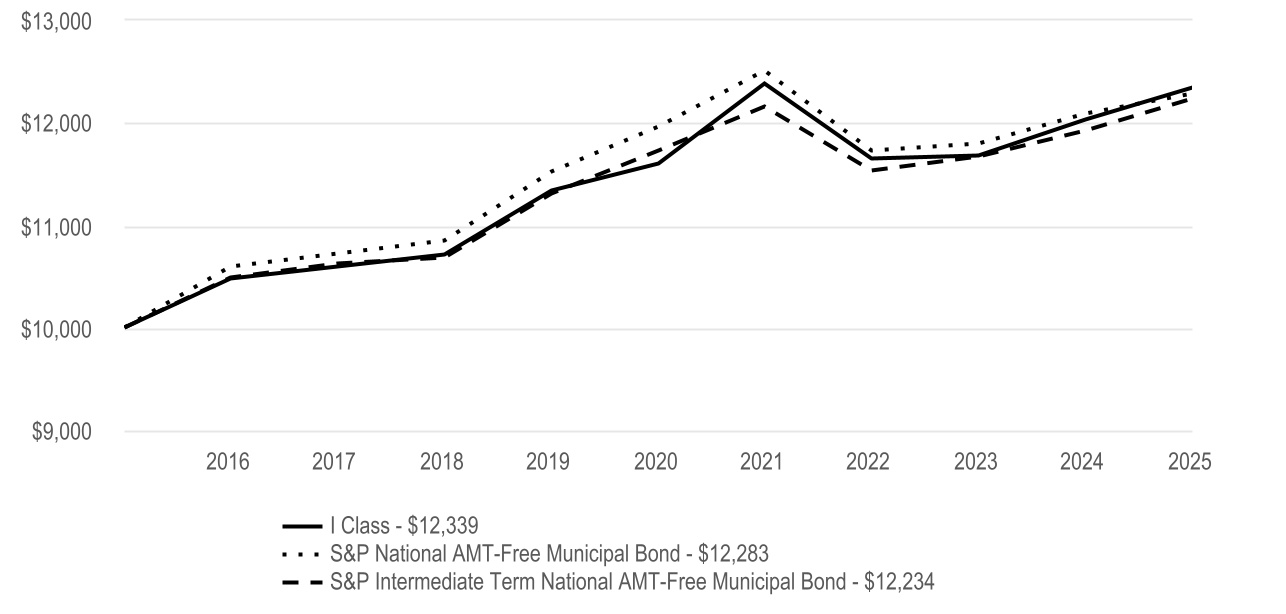
| I Class | $26 | 0.26% | ||||||
| What were the key factors that affected the fund’s performance? | |||||
Intermediate-Term Tax-Free Bond Fund I Class returned 2.57% for the reporting period ended May 31, 2025. | |||||
| The fund seeks safety of principal and high current income that is exempt from federal income tax. The comments below refer to the fund's performance compared to the S&P Intermediate Term National AMT-Free Municipal Bond Index during the period. | |||||
• | Interest rate volatility, trade wars and federal tax policy uncertainty were key challenges for the municipal bond market during the reporting period. Against this backdrop, security selection was the primary detractor to portfolio performance. Our choices in the student housing, water and sewer, and state and local general obligation (GO) sectors were among the weakest. Meanwhile, the portfolio logged positive selection results in the charter school and private university sectors. | ||||
• | Yield curve effects slightly detracted from performance, largely due to our positioning along the curve, which favored the intermediate and long portions of the municipal curve. Positive results from duration, which we managed using U.S. Treasury futures, and yield curve roll-down helped offset some of the negative positioning effects. | ||||
• | Our sector allocation decisions were broadly positive. Out-of-index positions in the hospital, industry development revenue/pollution control revenue, retirement community and multifamily housing sectors were top contributors. An underweight position versus in the index in the special tax sector also aided performance. Underweights in state GO and pre-refunded securities were the main detractors. | ||||
Cumulative Performance (based on an initial $10,000 investment) | ||
May 31, 2015 through May 31, 2025 | ||
Average Annual Total Returns | |||||||||||
| 1 Year | 5 Year | 10 Year | |||||||||
| I Class | 2.57% | 1.24% | 2.12% | ||||||||
| Regulatory Index | |||||||||||
| S&P National AMT-Free Municipal Bond | 1.64% | 0.53% | 2.08% | ||||||||
| Performance Index | |||||||||||
| S&P Intermediate Term National AMT-Free Municipal Bond | 2.63% | 0.86% | 2.04% | ||||||||
| Fund Holdings | ||
Types of Investments in Portfolio (as a % of net assets) | |||||
| Municipal Securities | 99.5% | ||||
| Exchange-Traded Funds | 0.5% | ||||
| Short-Term Investments | 0.0% | ||||
| Other Assets and Liabilities | 0.0% | ||||
What were the fund costs for the last year? (based on a hypothetical $10,000 investment) | ||||||||
Costs of a $10,000 investment | Costs paid as a percentage of a $10,000 investment | |||||||
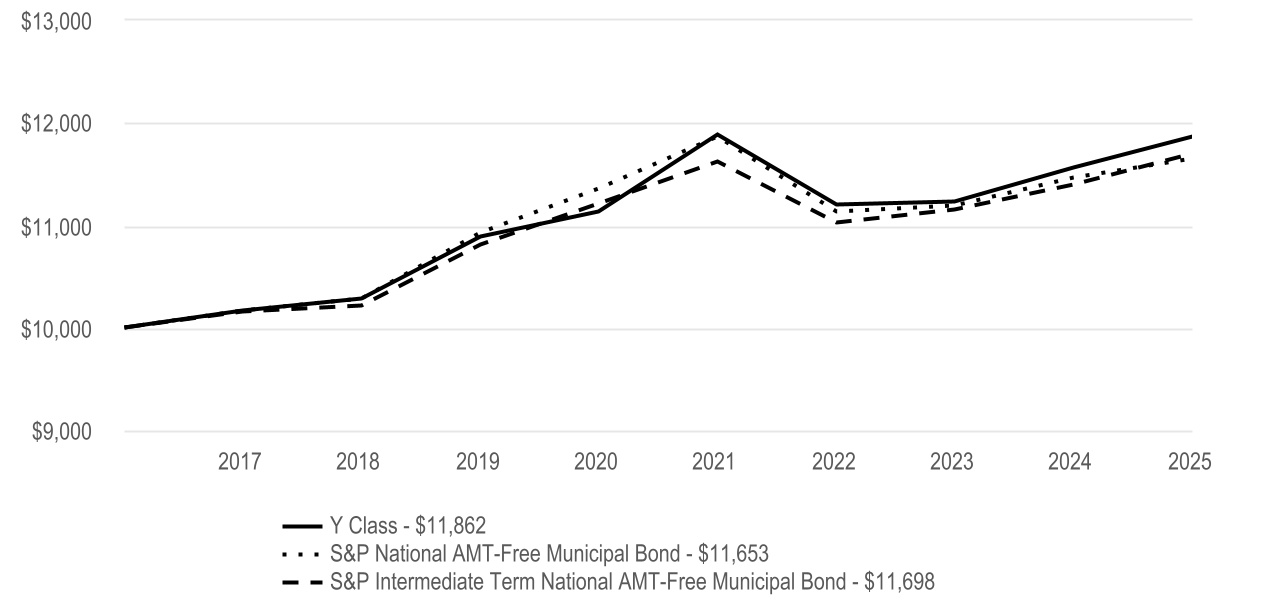
| Y Class | $23 | 0.23% | ||||||
| What were the key factors that affected the fund’s performance? | |||||
Intermediate-Term Tax-Free Bond Fund Y Class returned 2.60% for the reporting period ended May 31, 2025. | |||||
| The fund seeks safety of principal and high current income that is exempt from federal income tax. The comments below refer to the fund's performance compared to the S&P Intermediate Term National AMT-Free Municipal Bond Index during the period. | |||||
• | Interest rate volatility, trade wars and federal tax policy uncertainty were key challenges for the municipal bond market during the reporting period. Against this backdrop, security selection was the primary detractor to portfolio performance. Our choices in the student housing, water and sewer, and state and local general obligation (GO) sectors were among the weakest. Meanwhile, the portfolio logged positive selection results in the charter school and private university sectors. | ||||
• | Yield curve effects slightly detracted from performance, largely due to our positioning along the curve, which favored the intermediate and long portions of the municipal curve. Positive results from duration, which we managed using U.S. Treasury futures, and yield curve roll-down helped offset some of the negative positioning effects. | ||||
• | Our sector allocation decisions were broadly positive. Out-of-index positions in the hospital, industry development revenue/pollution control revenue, retirement community and multifamily housing sectors were top contributors. An underweight position versus in the index in the special tax sector also aided performance. Underweights in state GO and pre-refunded securities were the main detractors. | ||||
Cumulative Performance (based on an initial $10,000 investment) | ||
April 10, 2017 through May 31, 2025 | ||
Average Annual Total Returns | ||||||||||||||
| 1 Year | 5 Year | Since Inception | Inception Date | |||||||||||
| Y Class | 2.60% | 1.27% | 2.12% | 4/10/17 | ||||||||||
| Regulatory Index | ||||||||||||||
| S&P National AMT-Free Municipal Bond | 1.64% | 0.53% | 1.90% | — | ||||||||||
| Performance Index | ||||||||||||||
| S&P Intermediate Term National AMT-Free Municipal Bond | 2.63% | 0.86% | 1.94% | — | ||||||||||
| Fund Holdings | ||
Types of Investments in Portfolio (as a % of net assets) | |||||
| Municipal Securities | 99.5% | ||||
| Exchange-Traded Funds | 0.5% | ||||
| Short-Term Investments | 0.0% | ||||
| Other Assets and Liabilities | 0.0% | ||||
What were the fund costs for the last year? (based on a hypothetical $10,000 investment) | ||||||||
Costs of a $10,000 investment | Costs paid as a percentage of a $10,000 investment | |||||||
| A Class | $72 | 0.71% | ||||||
| What were the key factors that affected the fund’s performance? | |||||
Intermediate-Term Tax-Free Bond Fund A Class returned 2.11% for the reporting period ended May 31, 2025. | |||||
| The fund seeks safety of principal and high current income that is exempt from federal income tax. The comments below refer to the fund's performance compared to the S&P Intermediate Term National AMT-Free Municipal Bond Index during the period. | |||||
• | Interest rate volatility, trade wars and federal tax policy uncertainty were key challenges for the municipal bond market during the reporting period. Against this backdrop, security selection was the primary detractor to portfolio performance. Our choices in the student housing, water and sewer, and state and local general obligation (GO) sectors were among the weakest. Meanwhile, the portfolio logged positive selection results in the charter school and private university sectors. | ||||
• | Yield curve effects slightly detracted from performance, largely due to our positioning along the curve, which favored the intermediate and long portions of the municipal curve. Positive results from duration, which we managed using U.S. Treasury futures, and yield curve roll-down helped offset some of the negative positioning effects. | ||||
• | Our sector allocation decisions were broadly positive. Out-of-index positions in the hospital, industry development revenue/pollution control revenue, retirement community and multifamily housing sectors were top contributors. An underweight position versus in the index in the special tax sector also aided performance. Underweights in state GO and pre-refunded securities were the main detractors. | ||||
Cumulative Performance (based on an initial $10,000 investment) | ||
May 31, 2015 through May 31, 2025 | ||
The initial investment is adjusted to reflect the maximum initial sales charge. | ||
Average Annual Total Returns | |||||||||||
| 1 Year | 5 Year | 10 Year | |||||||||
| A Class | 2.11% | 0.81% | 1.67% | ||||||||
| A Class - with sales charge | -2.49% | -0.12% | 1.20% | ||||||||
| Regulatory Index | |||||||||||
| S&P National AMT-Free Municipal Bond | 1.64% | 0.53% | 2.08% | ||||||||
| Performance Index | |||||||||||
| S&P Intermediate Term National AMT-Free Municipal Bond | 2.63% | 0.86% | 2.04% | ||||||||
| Fund Holdings | ||
Types of Investments in Portfolio (as a % of net assets) | |||||
| Municipal Securities | 99.5% | ||||
| Exchange-Traded Funds | 0.5% | ||||
| Short-Term Investments | 0.0% | ||||
| Other Assets and Liabilities | 0.0% | ||||
What were the fund costs for the last year? (based on a hypothetical $10,000 investment) | ||||||||
Costs of a $10,000 investment | Costs paid as a percentage of a $10,000 investment | |||||||
| C Class | $147 | 1.46% | ||||||
| What were the key factors that affected the fund’s performance? | |||||
Intermediate-Term Tax-Free Bond Fund C Class returned 1.35% for the reporting period ended May 31, 2025. | |||||
| The fund seeks safety of principal and high current income that is exempt from federal income tax. The comments below refer to the fund's performance compared to the S&P Intermediate Term National AMT-Free Municipal Bond Index during the period. | |||||
• | Interest rate volatility, trade wars and federal tax policy uncertainty were key challenges for the municipal bond market during the reporting period. Against this backdrop, security selection was the primary detractor to portfolio performance. Our choices in the student housing, water and sewer, and state and local general obligation (GO) sectors were among the weakest. Meanwhile, the portfolio logged positive selection results in the charter school and private university sectors. | ||||
• | Yield curve effects slightly detracted from performance, largely due to our positioning along the curve, which favored the intermediate and long portions of the municipal curve. Positive results from duration, which we managed using U.S. Treasury futures, and yield curve roll-down helped offset some of the negative positioning effects. | ||||
• | Our sector allocation decisions were broadly positive. Out-of-index positions in the hospital, industry development revenue/pollution control revenue, retirement community and multifamily housing sectors were top contributors. An underweight position versus in the index in the special tax sector also aided performance. Underweights in state GO and pre-refunded securities were the main detractors. | ||||
Cumulative Performance (based on an initial $10,000 investment) | ||
May 31, 2015 through May 31, 2025 | ||
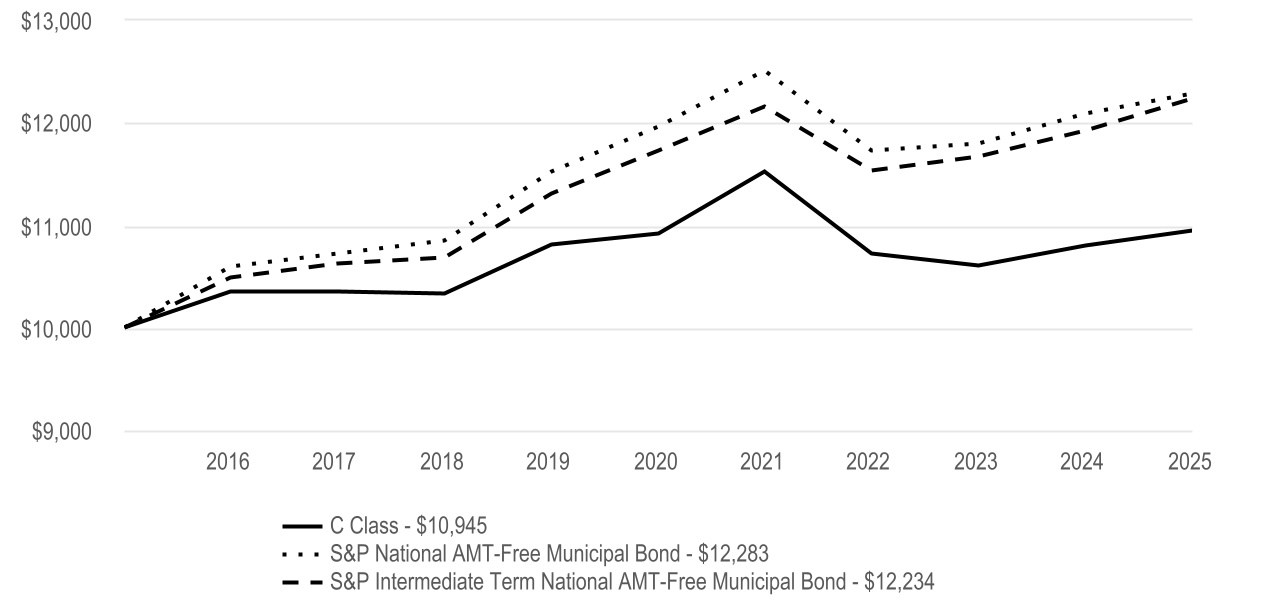
Average Annual Total Returns | |||||||||||
| 1 Year | 5 Year | 10 Year | |||||||||
| C Class | 1.35% | 0.05% | 0.91% | ||||||||
| Regulatory Index | |||||||||||
| S&P National AMT-Free Municipal Bond | 1.64% | 0.53% | 2.08% | ||||||||
| Performance Index | |||||||||||
| S&P Intermediate Term National AMT-Free Municipal Bond | 2.63% | 0.86% | 2.04% | ||||||||
| Fund Holdings | ||
Types of Investments in Portfolio (as a % of net assets) | |||||
| Municipal Securities | 99.5% | ||||
| Exchange-Traded Funds | 0.5% | ||||
| Short-Term Investments | 0.0% | ||||
| Other Assets and Liabilities | 0.0% | ||||
What were the fund costs for the last year? (based on a hypothetical $10,000 investment) | ||||||||
Costs of a $10,000 investment | Costs paid as a percentage of a $10,000 investment | |||||||
| Investor Class | $50 | 0.49% | ||||||
Fund Statistics | |||||
| Net Assets | $164,137,506 | ||||
| Management Fees (dollars paid during the reporting period) | $783,140 | ||||
| Total Number of Portfolio Holdings | 88 | ||||
| 7-Day Current Yield - Investor Class | 1.90 | % | |||
| 7-Day Effective Yield - Investor Class | 1.92 | % | |||
| Fund Holdings | ||
Types of Investments in Portfolio (as a % of net assets) | |||||
| Municipal Securities | 99.2% | ||||
| Other Assets and Liabilities | 0.8% | ||||
| Fund Changes | ||
| Beginning October 2024, the total eligible investments required to qualify for a waiver of the annual account maintenance fee changed from $10,000 to $25,000. Such fee will also be waived for any accounts for which the shareholder has elected to receive electronic delivery of all fund/account documents. | ||