Shareholder Report
May 31, 2025
USD ($)
Holding
Fund Expenses for the Last Six Months
(Based on a hypothetical $10,000 investment)
| Fund (Class) | Costs of a $10,000 investment | Costs paid as a percentage of a $10,000 investment |
| Smead Value Fund (Class A/SVFAX) |
$56 | 1.22% |
Management’s Discussion of Fund Performance
SUMMARY OF RESULTS
In the first half of fiscal year 2025, the Smead Value Fund (Class A/SVFAX) lost (15.01)% versus a loss in the S&P 500 Index of (1.35)% and a loss in the Russell 1000 Value Index of (4.51)%.
TOP PERFORMANCE CONTRIBUTORS
Our biggest gainers in the fiscal period were eBay Inc. (EBAY), ULTA Beauty (ULTA), and Millrose Properties (MRP).
TOP PERFORMANCE DETRACTORS
The top detractors for the fiscal period were Lennar Corp (LEN), D.R. Horton (DHI), and Macerich (MAC).
Fund Performance
The following graph compares the initial and subsequent account values at the end of each of the most recently completed 10 fiscal years of the Class A shares. It assumes a $10,000 initial investment at the beginning of the first fiscal year in an appropriate, broad-based securities market index for the same period.
GROWTH OF $10,000
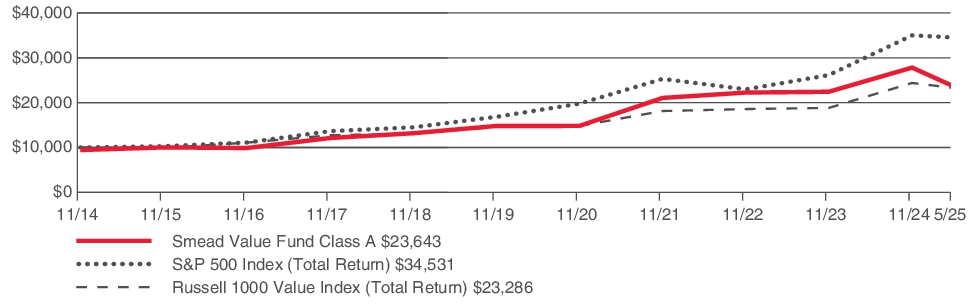
| AVERAGE ANNUAL TOTAL RETURN AS OF MAY 31, 2025 | 1 Year | 5 Year | 10 Year |
| Smead Value Fund (Class A/SVFAX) with sales charge | (16.26)% | 12.51% | 8.55% |
| Smead Value Fund (Class A/SVFAX) | (11.15)% | 13.85% | 9.20% |
| S&P 500® Index (Total Return) | 13.52% | 15.94% | 12.86% |
| Russell 1000® Value Index (Total Return) | 8.91% | 13.02% | 8.60% |
Key Fund Statistics (as of May 31, 2025)
The following table outlines key Fund statistics that you should pay attention to.
| Fund Net Assets | $4,448,078,252 |
| Total number of portfolio holdings | 31 |
| Portfolio turnover rate | 7.50% |
Graphical Representation of Holdings (as of May 31, 2025)
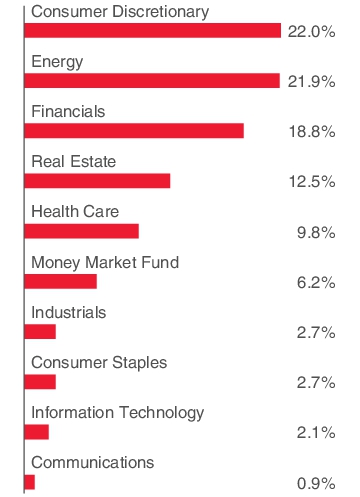
The tables below show the investment makeup of the Fund, representing the percentage of the total net assets of the Fund.
TOP TEN HOLDINGS
| Simon Property Group, Inc. – REIT | 6.7% |
| Amgen, Inc. | 5.3% |
| American Express Co. | 5.2% |
| Macerich Co. (The) – REIT | 5.2% |
| DR Horton, Inc. | 4.7% |
| Merck & Co., Inc. | 4.5% |
| Lennar Corp. – Class A | 4.4% |
| Cenovus Energy, Inc. | 4.3% |
| eBay, Inc. | 4.3% |
| NVR, Inc. | 4.1% |
SECTOR ALLOCATION

TOP TEN HOLDINGS
| Simon Property Group, Inc. – REIT | 6.7% |
| Amgen, Inc. | 5.3% |
| American Express Co. | 5.2% |
| Macerich Co. (The) – REIT | 5.2% |
| DR Horton, Inc. | 4.7% |
| Merck & Co., Inc. | 4.5% |
| Lennar Corp. – Class A | 4.4% |
| Cenovus Energy, Inc. | 4.3% |
| eBay, Inc. | 4.3% |
| NVR, Inc. | 4.1% |
Fund Expenses for the Last Six Months
(Based on a hypothetical $10,000 investment)
| Fund (Class) | Costs of a $10,000 investment | Costs paid as a percentage of a $10,000 investment |
| Smead Value Fund (Class C/SVFCX) |
$83 | 1.80% |
Management’s Discussion of Fund Performance
SUMMARY OF RESULTS
In the first half of fiscal year 2025, the Smead Value Fund (Class C/SVFCX) lost (15.27)% versus a loss in the S&P 500 Index of (1.35)% and a loss in the Russell 1000 Value Index of (4.51)%.
TOP PERFORMANCE CONTRIBUTORS
Our biggest gainers in the fiscal period were eBay Inc. (EBAY), ULTA Beauty (ULTA), and Millrose Properties (MRP).
TOP PERFORMANCE DETRACTORS
The top detractors for the fiscal period were Lennar Corp (LEN), D.R. Horton (DHI), and Macerich (MAC).
Fund Performance
The following graph compares the initial and subsequent account values at the end of each of the completed fiscal years of the Class C shares since its inception on April 16, 2020. It assumes a $25,000 initial investment at inception in an appropriate, broad-based securities market index for the same period.
GROWTH OF $25,000
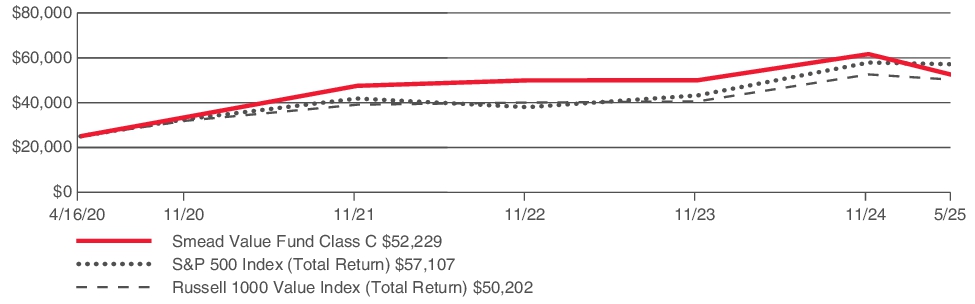
| AVERAGE ANNUAL TOTAL RETURN AS OF MAY 31, 2025 | 1 Year | 5 Year | Since Inception |
| Smead Value Fund (Class C/SVFCX) | (11.70)% | 13.18% | 15.46% |
| S&P 500® Index (Total Return) | 13.52% | 15.94% | 17.50% |
| Russell 1000® Value Index (Total Return) | 8.91% | 13.02% | 14.58% |
Key Fund Statistics (as of May 31, 2025)
The following table outlines key Fund statistics that you should pay attention to.
| Fund Net Assets | $4,448,078,252 |
| Total number of portfolio holdings | 31 |
| Portfolio turnover rate | 7.50% |
Graphical Representation of Holdings (as of May 31, 2025)
The tables below show the investment makeup of the Fund, representing the percentage of the total net assets of the Fund.
TOP TEN HOLDINGS
| Simon Property Group, Inc. – REIT | 6.7% |
| Amgen, Inc. | 5.3% |
| American Express Co. | 5.2% |
| Macerich Co. (The) – REIT | 5.2% |
| DR Horton, Inc. | 4.7% |
| Merck & Co., Inc. | 4.5% |
| Lennar Corp. – Class A | 4.4% |
| Cenovus Energy, Inc. | 4.3% |
| eBay, Inc. | 4.3% |
| NVR, Inc. | 4.1% |
SECTOR ALLOCATION

TOP TEN HOLDINGS
| Simon Property Group, Inc. – REIT | 6.7% |
| Amgen, Inc. | 5.3% |
| American Express Co. | 5.2% |
| Macerich Co. (The) – REIT | 5.2% |
| DR Horton, Inc. | 4.7% |
| Merck & Co., Inc. | 4.5% |
| Lennar Corp. – Class A | 4.4% |
| Cenovus Energy, Inc. | 4.3% |
| eBay, Inc. | 4.3% |
| NVR, Inc. | 4.1% |
Fund Expenses for the Last Six Months
(Based on a hypothetical $10,000 investment)
| Fund (Class) | Costs of a $10,000 investment | Costs paid as a percentage of a $10,000 investment |
| Smead Value Fund (Class I1/SVFFX) |
$44 | 0.95% |
Management’s Discussion of Fund Performance
SUMMARY OF RESULTS
In the first half of fiscal year 2025, the Smead Value Fund (Class I1/SVFFX) lost (14.90)% versus a loss in the S&P 500 Index of (1.35)% and a loss in the Russell 1000 Value Index of (4.51)%.
TOP PERFORMANCE CONTRIBUTORS
Our biggest gainers in the fiscal period were eBay Inc. (EBAY), ULTA Beauty (ULTA), and Millrose Properties (MRP).
TOP PERFORMANCE DETRACTORS
The top detractors for the fiscal period were Lennar Corp (LEN), D.R. Horton (DHI), and Macerich (MAC).
Fund Performance
The following graph compares the initial and subsequent account values at the end of each of the most recently completed 10 fiscal years of the Class I1 shares. It assumes a $1,000,000 initial investment at the beginning of the first fiscal year in an appropriate, broad-based securities market index for the same period.
GROWTH OF $1,000,000
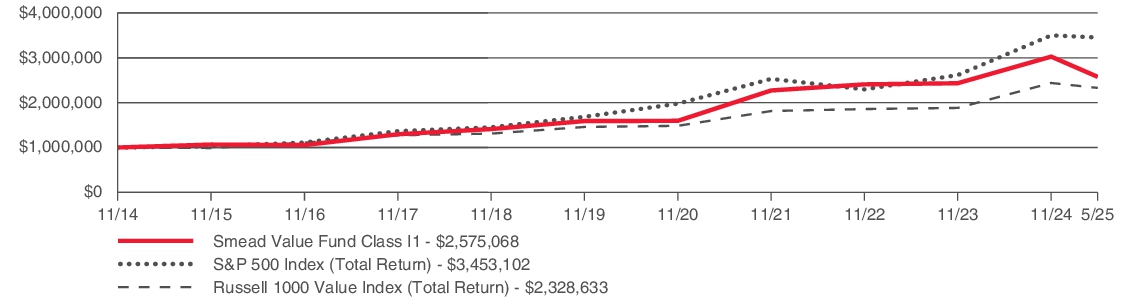
| AVERAGE ANNUAL TOTAL RETURN AS OF MAY 31, 2025 | 1 Year | 5 Year | 10 Year |
| Smead Value Fund (Class I1/SVFFX) | (10.92)% | 14.15% | 9.47% |
| S&P 500® Index (Total Return) | 13.52% | 15.94% | 12.86% |
| Russell 1000® Value Index (Total Return) | 8.91% | 13.02% | 8.60% |
Key Fund Statistics (as of May 31, 2025)
The following table outlines key Fund statistics that you should pay attention to.
| Fund Net Assets | $4,448,078,252 |
| Total number of portfolio holdings | 31 |
| Portfolio turnover rate | 7.50% |
Graphical Representation of Holdings (as of May 31, 2025)
The tables below show the investment makeup of the Fund, representing the percentage of the total net assets of the Fund.
TOP TEN HOLDINGS
| Simon Property Group, Inc. – REIT | 6.7% |
| Amgen, Inc. | 5.3% |
| American Express Co. | 5.2% |
| Macerich Co. (The) – REIT | 5.2% |
| DR Horton, Inc. | 4.7% |
| Merck & Co., Inc. | 4.5% |
| Lennar Corp. – Class A | 4.4% |
| Cenovus Energy, Inc. | 4.3% |
| eBay, Inc. | 4.3% |
| NVR, Inc. | 4.1% |
SECTOR ALLOCATION
TOP TEN HOLDINGS
| Simon Property Group, Inc. – REIT | 6.7% |
| Amgen, Inc. | 5.3% |
| American Express Co. | 5.2% |
| Macerich Co. (The) – REIT | 5.2% |
| DR Horton, Inc. | 4.7% |
| Merck & Co., Inc. | 4.5% |
| Lennar Corp. – Class A | 4.4% |
| Cenovus Energy, Inc. | 4.3% |
| eBay, Inc. | 4.3% |
| NVR, Inc. | 4.1% |
Fund Expenses for the Last Six Months
(Based on a hypothetical $10,000 investment)
| Fund (Class) | Costs of a $10,000 investment | Costs paid as a percentage of a $10,000 investment |
| Smead Value Fund (Class R1/SVFDX) |
$73 | 1.59% |
Management’s Discussion of Fund Performance
SUMMARY OF RESULTS
In the first half of fiscal year 2025, the Smead Value Fund (Class R1/SVFDX) lost (15.17)% versus a loss in the S&P 500 Index of (1.35)% and a loss in the Russell 1000 Value Index of (4.51)%.
TOP PERFORMANCE CONTRIBUTORS
Our biggest gainers in the fiscal period were eBay Inc. (EBAY), ULTA Beauty (ULTA), and Millrose Properties (MRP).
TOP PERFORMANCE DETRACTORS
The top detractors for the fiscal period were Lennar Corp (LEN), D.R. Horton (DHI), and Macerich (MAC).
Fund Performance
The following graph compares the initial and subsequent account values at the end of each of the most recently completed 10 fiscal years of the Class R1 shares. It assumes a $25,000 initial investment at the beginning of the first fiscal year in an appropriate, broad-based securities market index for the same period.
GROWTH OF $25,000
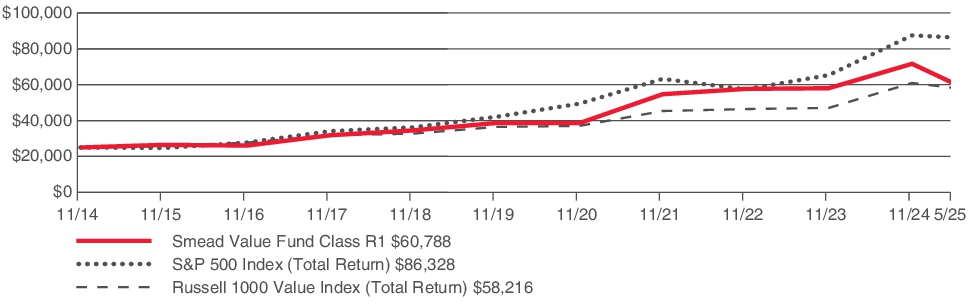
| AVERAGE ANNUAL TOTAL RETURN AS OF MAY 31, 2025 | 1 Year | 5 Year | 10 Year |
| Smead Value Fund (Class R1/SVFDX) | (11.57)% | 13.54% | 8.88% |
| S&P 500® Index (Total Return) | 13.52% | 15.94% | 12.86% |
| Russell 1000® Value Index (Total Return) | 8.91% | 13.02% | 8.60% |
Key Fund Statistics (as of May 31, 2025)
The following table outlines key Fund statistics that you should pay attention to.
| Fund Net Assets | $4,448,078,252 |
| Total number of portfolio holdings | 31 |
| Portfolio turnover rate | 7.50% |
Graphical Representation of Holdings (as of May 31, 2025)
The tables below show the investment makeup of the Fund, representing the percentage of the total net assets of the Fund.
TOP TEN HOLDINGS
| Simon Property Group, Inc. – REIT | 6.7% |
| Amgen, Inc. | 5.3% |
| American Express Co. | 5.2% |
| Macerich Co. (The) – REIT | 5.2% |
| DR Horton, Inc. | 4.7% |
| Merck & Co., Inc. | 4.5% |
| Lennar Corp. – Class A | 4.4% |
| Cenovus Energy, Inc. | 4.3% |
| eBay, Inc. | 4.3% |
| NVR, Inc. | 4.1% |
SECTOR ALLOCATION

TOP TEN HOLDINGS
| Simon Property Group, Inc. – REIT | 6.7% |
| Amgen, Inc. | 5.3% |
| American Express Co. | 5.2% |
| Macerich Co. (The) – REIT | 5.2% |
| DR Horton, Inc. | 4.7% |
| Merck & Co., Inc. | 4.5% |
| Lennar Corp. – Class A | 4.4% |
| Cenovus Energy, Inc. | 4.3% |
| eBay, Inc. | 4.3% |
| NVR, Inc. | 4.1% |
Fund Expenses for the Last Six Months
(Based on a hypothetical $10,000 investment)
| Fund (Class) | Costs of a $10,000 investment | Costs paid as a percentage of a $10,000 investment |
| Smead Value Fund (Class R2/SVFKX) |
$66 | 1.44% |
Management’s Discussion of Fund Performance
SUMMARY OF RESULTS
In the first half of fiscal year 2025, the Smead Value Fund (Class R2/SVFKX) lost (15.11)% versus a loss in the S&P 500 Index of (1.35)% and a loss in the Russell 1000 Value Index of (4.51)%.
TOP PERFORMANCE CONTRIBUTORS
Our biggest gainers in the fiscal period were eBay Inc. (EBAY), ULTA Beauty (ULTA), and Millrose Properties (MRP).
TOP PERFORMANCE DETRACTORS
The top detractors for the fiscal period were Lennar Corp (LEN), D.R. Horton (DHI), and Macerich (MAC).
Fund Performance
The following graph compares the initial and subsequent account values at the end of each of the most recently completed 10 fiscal years of the Class R2 shares. It assumes a $25,000 initial investment at the beginning of the first fiscal year in an appropriate, broad-based securities market index for the same period.
GROWTH OF $25,000
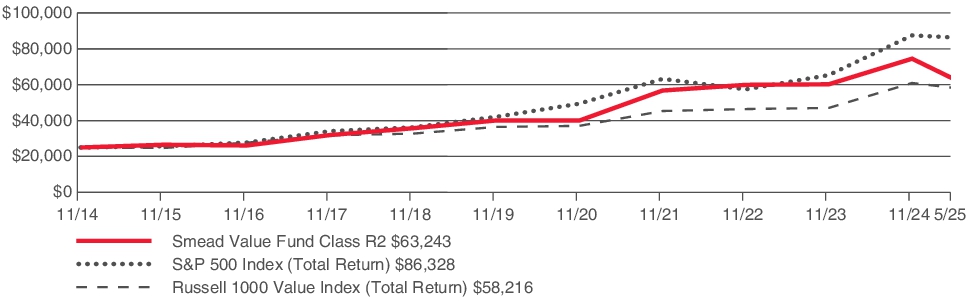
| AVERAGE ANNUAL TOTAL RETURN AS OF MAY 31, 2025 | 1 Year | 5 Year | 10 Year |
| Smead Value Fund (Class R2/SVFKX) | (11.45)% | 13.60% | 9.30% |
| S&P 500® Index (Total Return) | 13.52% | 15.94% | 12.86% |
| Russell 1000® Value Index (Total Return) | 8.91% | 13.02% | 8.60% |
Key Fund Statistics (as of May 31, 2025)
The following table outlines key Fund statistics that you should pay attention to.
| Fund Net Assets | $4,448,078,252 |
| Total number of portfolio holdings | 31 |
| Portfolio turnover rate | 7.50% |
Graphical Representation of Holdings (as of May 31, 2025)
The tables below show the investment makeup of the Fund, representing the percentage of the total net assets of the Fund.
TOP TEN HOLDINGS
| Simon Property Group, Inc. – REIT | 6.7% |
| Amgen, Inc. | 5.3% |
| American Express Co. | 5.2% |
| Macerich Co. (The) – REIT | 5.2% |
| DR Horton, Inc. | 4.7% |
| Merck & Co., Inc. | 4.5% |
| Lennar Corp. – Class A | 4.4% |
| Cenovus Energy, Inc. | 4.3% |
| eBay, Inc. | 4.3% |
| NVR, Inc. | 4.1% |
SECTOR ALLOCATION

TOP TEN HOLDINGS
| Simon Property Group, Inc. – REIT | 6.7% |
| Amgen, Inc. | 5.3% |
| American Express Co. | 5.2% |
| Macerich Co. (The) – REIT | 5.2% |
| DR Horton, Inc. | 4.7% |
| Merck & Co., Inc. | 4.5% |
| Lennar Corp. – Class A | 4.4% |
| Cenovus Energy, Inc. | 4.3% |
| eBay, Inc. | 4.3% |
| NVR, Inc. | 4.1% |
Fund Expenses for the Last Six Months
(Based on a hypothetical $10,000 investment)
| Fund (Class) | Costs of a $10,000 investment | Costs paid as a percentage of a $10,000 investment |
| Smead Value Fund (Class Y/SVFYX) |
$37 | 0.80% |
Management’s Discussion of Fund Performance
SUMMARY OF RESULTS
In the first half of fiscal year 2025, the Smead Value Fund (Class Y/SVFYX) lost (14.84)% versus a loss in the S&P 500 Index of (1.35)% and a loss in the Russell 1000 Value Index of (4.51)%.
TOP PERFORMANCE CONTRIBUTORS
Our biggest gainers in the fiscal period were eBay Inc. (EBAY), ULTA Beauty (ULTA), and Millrose Properties (MRP).
TOP PERFORMANCE DETRACTORS
The top detractors for the fiscal period were Lennar Corp (LEN), D.R. Horton (DHI), and Macerich (MAC).
Fund Performance
The following graph compares the initial and subsequent account values at the end of each of the most recently completed 10 fiscal years of the Class Y shares. It assumes a $10,000,000 initial investment at the beginning of the first fiscal year in an appropriate, broad-based securities market index for the same period.
GROWTH OF $10,000,000
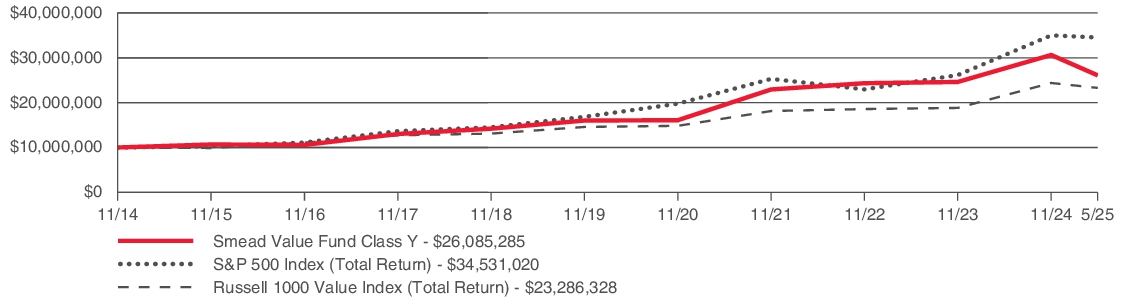
| AVERAGE ANNUAL TOTAL RETURN AS OF MAY 31, 2025 | 1 Year | 5 Year | 10 Year |
| Smead Value Fund (Class Y/SVFYX) | (10.86)% | 14.26% | 9.60% |
| S&P 500® Index (Total Return) | 13.52% | 15.94% | 12.86% |
| Russell 1000® Value Index (Total Return) | 8.91% | 13.02% | 8.60% |
Key Fund Statistics (as of May 31, 2025)
The following table outlines key Fund statistics that you should pay attention to.
| Fund Net Assets | $4,448,078,252 |
| Total number of portfolio holdings | 31 |
| Portfolio turnover rate | 7.50% |
Graphical Representation of Holdings (as of May 31, 2025)
The tables below show the investment makeup of the Fund, representing the percentage of the total net assets of the Fund.
TOP TEN HOLDINGS
| Simon Property Group, Inc. – REIT | 6.7% |
| Amgen, Inc. | 5.3% |
| American Express Co. | 5.2% |
| Macerich Co. (The) – REIT | 5.2% |
| DR Horton, Inc. | 4.7% |
| Merck & Co., Inc. | 4.5% |
| Lennar Corp. – Class A | 4.4% |
| Cenovus Energy, Inc. | 4.3% |
| eBay, Inc. | 4.3% |
| NVR, Inc. | 4.1% |
SECTOR ALLOCATION

TOP TEN HOLDINGS
| Simon Property Group, Inc. – REIT | 6.7% |
| Amgen, Inc. | 5.3% |
| American Express Co. | 5.2% |
| Macerich Co. (The) – REIT | 5.2% |
| DR Horton, Inc. | 4.7% |
| Merck & Co., Inc. | 4.5% |
| Lennar Corp. – Class A | 4.4% |
| Cenovus Energy, Inc. | 4.3% |
| eBay, Inc. | 4.3% |
| NVR, Inc. | 4.1% |
Fund Expenses for the Last Six Months
(Based on a hypothetical $10,000 investment)
| Fund (Class) | Costs of a $10,000 investment | Costs paid as a percentage of a $10,000 investment |
| Smead Value Fund (Investor Class/SMVLX) |
$56 | 1.22% |
Management’s Discussion of Fund Performance
SUMMARY OF RESULTS
In the first half of fiscal year 2025, the Smead Value Fund (Investor Class/SMVLX) lost (15.01)% versus a loss in the S&P 500 Index of (1.35)% and a loss in the Russell 1000 Value Index of (4.51)%.
TOP PERFORMANCE CONTRIBUTORS
Our biggest gainers in the fiscal period were eBay Inc. (EBAY), ULTA Beauty (ULTA), and Millrose Properties (MRP).
TOP PERFORMANCE DETRACTORS
The top detractors for the fiscal period were Lennar Corp (LEN), D.R. Horton (DHI), and Macerich (MAC).
Fund Performance
The following graph compares the initial and subsequent account values at the end of each of the most recently completed 10 fiscal years of the Investor Class shares. It assumes a $10,000 initial investment at the beginning of the first fiscal year in an appropriate, broad-based securities market index for the same period.
GROWTH OF $10,000
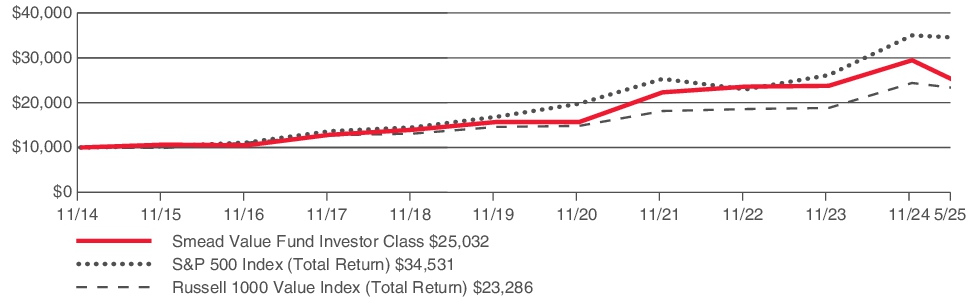
| AVERAGE ANNUAL TOTAL RETURN AS OF MAY 31, 2025 | 1 Year | 5 Year | 10 Year |
| Smead Value Fund (Investor Class/SMVLX) | (11.18)% | 13.84% | 9.17% |
| S&P 500® Index (Total Return) | 13.52% | 15.94% | 12.86% |
| Russell 1000® Value Index (Total Return) | 8.91% | 13.02% | 8.60% |
Key Fund Statistics (as of May 31, 2025)
The following table outlines key Fund statistics that you should pay attention to.
| Fund Net Assets | $4,448,078,252 |
| Total number of portfolio holdings | 31 |
| Portfolio turnover rate | 7.50% |
Graphical Representation of Holdings (as of May 31, 2025)
The tables below show the investment makeup of the Fund, representing the percentage of the total net assets of the Fund.
TOP TEN HOLDINGS
| Simon Property Group, Inc. – REIT | 6.7% |
| Amgen, Inc. | 5.3% |
| American Express Co. | 5.2% |
| Macerich Co. (The) – REIT | 5.2% |
| DR Horton, Inc. | 4.7% |
| Merck & Co., Inc. | 4.5% |
| Lennar Corp. – Class A | 4.4% |
| Cenovus Energy, Inc. | 4.3% |
| eBay, Inc. | 4.3% |
| NVR, Inc. | 4.1% |
SECTOR ALLOCATION

TOP TEN HOLDINGS
| Simon Property Group, Inc. – REIT | 6.7% |
| Amgen, Inc. | 5.3% |
| American Express Co. | 5.2% |
| Macerich Co. (The) – REIT | 5.2% |
| DR Horton, Inc. | 4.7% |
| Merck & Co., Inc. | 4.5% |
| Lennar Corp. – Class A | 4.4% |
| Cenovus Energy, Inc. | 4.3% |
| eBay, Inc. | 4.3% |
| NVR, Inc. | 4.1% |
Fund Expenses for the Last Six Months
(Based on a hypothetical $10,000 investment)
| Fund (Class) | Costs of a $10,000 investment | Costs paid as a percentage of a $10,000 investment |
| Smead International Value Fund (Class A/SVXAX) |
$75 | 1.42% |
Management’s Discussion of Fund Performance
SUMMARY OF RESULTS
The first half of fiscal year 2025 in the Smead International Value Fund (Class A/SVXAX) produced 12.69% for the shareholders compared to 14.21% for the MSCI EAFE NR Index and 11.81% for the MSCI ACWI ex-US NR Index.
TOP PERFORMANCE CONTRIBUTORS
Our best performers in the fiscal period were Bawag Group (BG AV), Unicredit SPA (UCG IM), and Bankinter (BKT SM).
TOP PERFORMANCE DETRACTORS
The top detractors for the fiscal period were West Fraser Timer (WFG CN), Cenovus Energy (CVE CN), and Whitehaven Coal (WHC AU).
Fund Performance
The following graph compares the initial and subsequent account values at the end of each of the completed fiscal years of the Class A shares since its inception on January 12, 2015. It assumes a $10,000 initial investment at inception in an appropriate, broad-based securities market index for the same period.
GROWTH OF $10,000
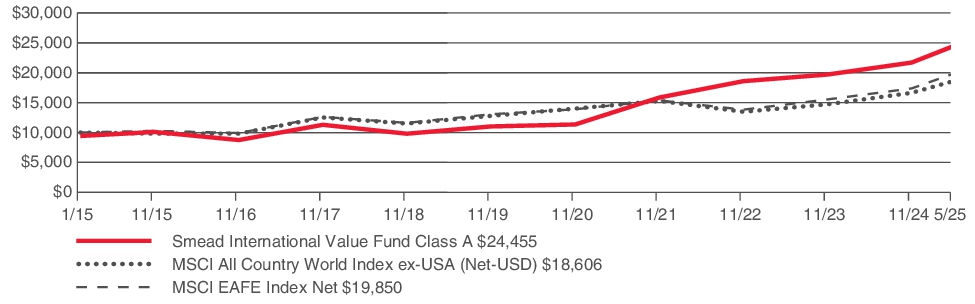
| AVERAGE ANNUAL TOTAL RETURN AS OF MAY 31, 2025 | 1 Year | 5 Year | 10 Year |
| Smead International Value Fund (Class A/SVXAX) with sales charge | (3.56)% | 22.71% | 8.06% |
| Smead International Value Fund (Class A/SVXAX) | 2.32% | 24.17% | 8.70% |
| MSCI All Country World Index ex-USA (Net-USD) | 13.75% | 10.37% | 5.47% |
| MSCI EAFE Index Net | 13.33% | 11.42% | 5.97% |
Key Fund Statistics (as of May 31, 2025)
The following table outlines key Fund statistics that you should pay attention to.
| Fund Net Assets | $168,890,712 |
| Total number of portfolio holdings | 28 |
| Portfolio turnover rate | 14.13% |
Graphical Representation of Holdings (as of May 31, 2025)
The tables below show the investment makeup of the Fund, representing the percentage of the total net assets of the Fund.
TOP TEN HOLDINGS
| BAWAG Group AG | 10.2% |
| Strathcona Resources Ltd. | 7.1% |
| MEG Energy Corp. | 6.9% |
| UniCredit SpA | 6.2% |
| Cenovus Energy, Inc. | 5.5% |
| Bankinter SA | 5.0% |
| Barclays PLC | 4.5% |
| Pandora AS | 4.2% |
| Glencore PLC | 4.0% |
| Frontline PLC | 3.7% |
SECTOR ALLOCATION

GEOGRAPHIC ALLOCATION
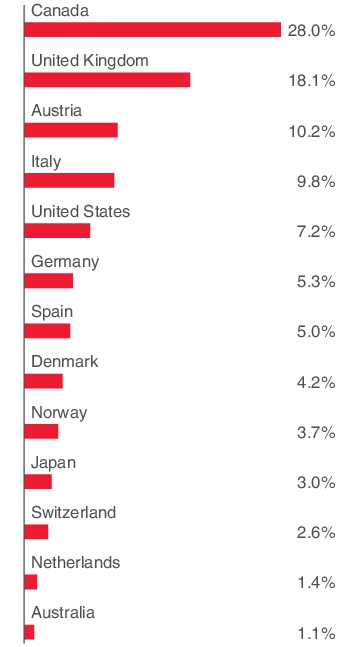
TOP TEN HOLDINGS
| BAWAG Group AG | 10.2% |
| Strathcona Resources Ltd. | 7.1% |
| MEG Energy Corp. | 6.9% |
| UniCredit SpA | 6.2% |
| Cenovus Energy, Inc. | 5.5% |
| Bankinter SA | 5.0% |
| Barclays PLC | 4.5% |
| Pandora AS | 4.2% |
| Glencore PLC | 4.0% |
| Frontline PLC | 3.7% |
Fund Expenses for the Last Six Months
(Based on a hypothetical $10,000 investment)
| Fund (Class) | Costs of a $10,000 investment | Costs paid as a percentage of a $10,000 investment |
| Smead International Value Fund (Class C/SVXCX) |
$106 | 2.00% |
Management’s Discussion of Fund Performance
SUMMARY OF RESULTS
The first half of fiscal year 2025 in the Smead International Value Fund (Class C/SVXCX) produced 12.38% for the shareholders compared to 14.21% for the MSCI EAFE NR Index and 11.81% for the MSCI ACWI ex-US NR Index.
TOP PERFORMANCE CONTRIBUTORS
Our best performers in the fiscal period were Bawag Group (BG AV), Unicredit SPA (UCG IM), and Bankinter (BKT SM).
TOP PERFORMANCE DETRACTORS
The top detractors for the fiscal period were West Fraser Timer (WFG CN), Cenovus Energy (CVE CN), and Whitehaven Coal (WHC AU).
Fund Performance
The following graph compares the initial and subsequent account values at the end of each of the completed fiscal years of the Class C shares since its inception on January 12, 2015. It assumes a $25,000 initial investment at inception in an appropriate, broad-based securities market index for the same period.
GROWTH OF $25,000
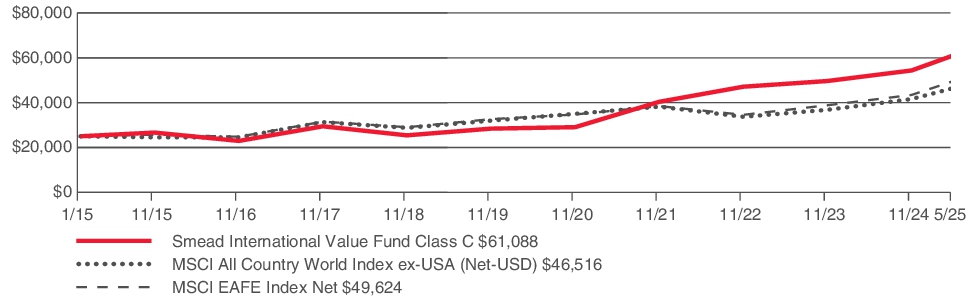
| AVERAGE ANNUAL TOTAL RETURN AS OF MAY 31, 2025 | 1 Year | 5 Year | 10 Year |
| Smead International Value Fund (Class C/SVXCX) | 1.72% | 23.48% | 8.08% |
| MSCI All Country World Index ex-USA (Net-USD) | 13.75% | 10.37% | 5.47% |
| MSCI EAFE Index Net | 13.33% | 11.42% | 5.97% |
Key Fund Statistics (as of May 31, 2025)
The following table outlines key Fund statistics that you should pay attention to.
| Fund Net Assets | $168,890,712 |
| Total number of portfolio holdings | 28 |
| Portfolio turnover rate | 14.13% |
Graphical Representation of Holdings (as of May 31, 2025)
The tables below show the investment makeup of the Fund, representing the percentage of the total net assets of the Fund.
TOP TEN HOLDINGS
| BAWAG Group AG | 10.2% |
| Strathcona Resources Ltd. | 7.1% |
| MEG Energy Corp. | 6.9% |
| UniCredit SpA | 6.2% |
| Cenovus Energy, Inc. | 5.5% |
| Bankinter SA | 5.0% |
| Barclays PLC | 4.5% |
| Pandora AS | 4.2% |
| Glencore PLC | 4.0% |
| Frontline PLC | 3.7% |
SECTOR ALLOCATION

GEOGRAPHIC ALLOCATION

TOP TEN HOLDINGS
| BAWAG Group AG | 10.2% |
| Strathcona Resources Ltd. | 7.1% |
| MEG Energy Corp. | 6.9% |
| UniCredit SpA | 6.2% |
| Cenovus Energy, Inc. | 5.5% |
| Bankinter SA | 5.0% |
| Barclays PLC | 4.5% |
| Pandora AS | 4.2% |
| Glencore PLC | 4.0% |
| Frontline PLC | 3.7% |
Fund Expenses for the Last Six Months
(Based on a hypothetical $10,000 investment)
| Fund (Class) | Costs of a $10,000 investment | Costs paid as a percentage of a $10,000 investment |
| Smead International Value Fund (Class I1/SVXFX) |
$61 | 1.15% |
Management’s Discussion of Fund Performance
SUMMARY OF RESULTS
The first half of fiscal year 2025 in the Smead International Value Fund (Class I1/SVXFX) produced 12.85% for the shareholders compared to 14.21% for the MSCI EAFE NR Index and 11.81% for the MSCI ACWI ex-US NR Index.
TOP PERFORMANCE CONTRIBUTORS
Our best performers in the fiscal period were Bawag Group (BG AV), Unicredit SPA (UCG IM), and Bankinter (BKT SM).
TOP PERFORMANCE DETRACTORS
The top detractors for the fiscal period were West Fraser Timer (WFG CN), Cenovus Energy (CVE CN), and Whitehaven Coal (WHC AU).
Fund Performance
The following graph compares the initial and subsequent account values at the end of each of the completed fiscal years of the Class I1 shares since its inception on January 12, 2015. It assumes a $1,000,000 initial investment at inception in an appropriate, broad-based securities market index for the same period.
GROWTH OF $1,000,000
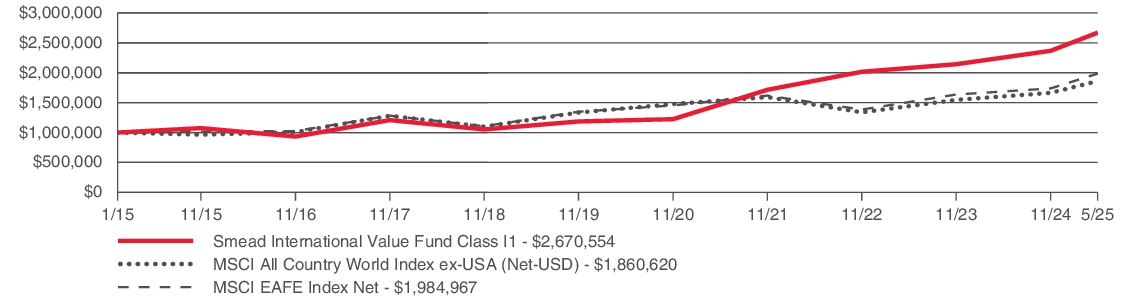
| AVERAGE ANNUAL TOTAL RETURN AS OF MAY 31, 2025 | 1 Year | 5 Year | 10 Year |
| Smead International Value Fund (Class I1/SVXFX) | 2.59% | 24.51% | 9.01% |
| MSCI All Country World Index ex-USA (Net-USD) | 13.75% | 10.37% | 5.47% |
| MSCI EAFE Index Net | 13.33% | 11.42% | 5.97% |
Key Fund Statistics (as of May 31, 2025)
The following table outlines key Fund statistics that you should pay attention to.
| Fund Net Assets | $168,890,712 |
| Total number of portfolio holdings | 28 |
| Portfolio turnover rate | 14.13% |
Graphical Representation of Holdings (as of May 31, 2025)
The tables below show the investment makeup of the Fund, representing the percentage of the total net assets of the Fund.
TOP TEN HOLDINGS
| BAWAG Group AG | 10.2% |
| Strathcona Resources Ltd. | 7.1% |
| MEG Energy Corp. | 6.9% |
| UniCredit SpA | 6.2% |
| Cenovus Energy, Inc. | 5.5% |
| Bankinter SA | 5.0% |
| Barclays PLC | 4.5% |
| Pandora AS | 4.2% |
| Glencore PLC | 4.0% |
| Frontline PLC | 3.7% |
SECTOR ALLOCATION

GEOGRAPHIC ALLOCATION

TOP TEN HOLDINGS
| BAWAG Group AG | 10.2% |
| Strathcona Resources Ltd. | 7.1% |
| MEG Energy Corp. | 6.9% |
| UniCredit SpA | 6.2% |
| Cenovus Energy, Inc. | 5.5% |
| Bankinter SA | 5.0% |
| Barclays PLC | 4.5% |
| Pandora AS | 4.2% |
| Glencore PLC | 4.0% |
| Frontline PLC | 3.7% |
Fund Expenses for the Last Six Months
(Based on a hypothetical $10,000 investment)
| Fund (Class) | Costs of a $10,000 investment | Costs paid as a percentage of a $10,000 investment |
| Smead International Value Fund (Class Y/SVXYX) |
$53 | 1.00% |
Management’s Discussion of Fund Performance
SUMMARY OF RESULTS
The first half of fiscal year 2025 in the Smead International Value Fund (Class Y/SVXYX) produced 12.95% for the shareholders compared to 14.21% for the MSCI EAFE NR Index and 11.81% for the MSCI ACWI ex-US NR Index.
TOP PERFORMANCE CONTRIBUTORS
Our best performers in the fiscal period were Bawag Group (BG AV), Unicredit SPA (UCG IM), and Bankinter (BKT SM).
TOP PERFORMANCE DETRACTORS
The top detractors for the fiscal period were West Fraser Timer (WFG CN), Cenovus Energy (CVE CN), and Whitehaven Coal (WHC AU).
Fund Performance
The following graph compares the initial and subsequent account values at the end of each of the completed fiscal years of the Class Y shares since its inception on January 12, 2015. It assumes a $10,000,000 initial investment at inception in an appropriate, broad-based securities market index for the same period.
GROWTH OF $10,000,000
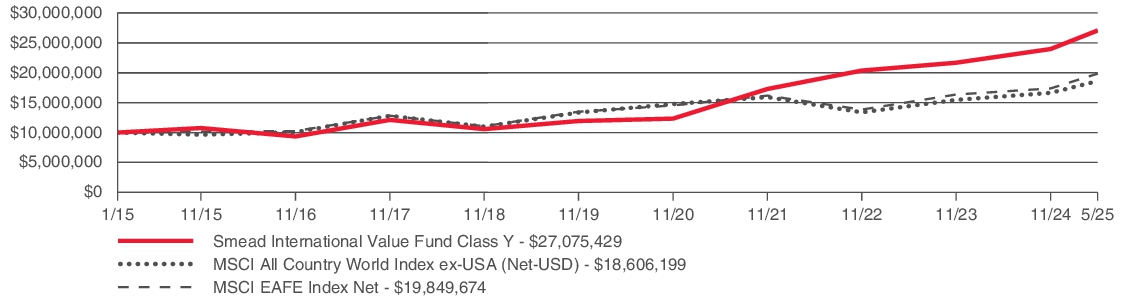
| AVERAGE ANNUAL TOTAL RETURN AS OF MAY 31, 2025 | 1 Year | 5 Year | 10 Year |
| Smead International Value Fund (Class Y/SVXYX) | 2.75% | 24.70% | 9.15% |
| MSCI All Country World Index ex-USA (Net-USD) | 13.75% | 10.37% | 5.47% |
| MSCI EAFE Index Net | 13.33% | 11.42% | 5.97% |
Key Fund Statistics (as of May 31, 2025)
The following table outlines key Fund statistics that you should pay attention to.
| Fund Net Assets | $168,890,712 |
| Total number of portfolio holdings | 28 |
| Portfolio turnover rate | 14.13% |
Graphical Representation of Holdings (as of May 31, 2025)
The tables below show the investment makeup of the Fund, representing the percentage of the total net assets of the Fund.
TOP TEN HOLDINGS
| BAWAG Group AG | 10.2% |
| Strathcona Resources Ltd. | 7.1% |
| MEG Energy Corp. | 6.9% |
| UniCredit SpA | 6.2% |
| Cenovus Energy, Inc. | 5.5% |
| Bankinter SA | 5.0% |
| Barclays PLC | 4.5% |
| Pandora AS | 4.2% |
| Glencore PLC | 4.0% |
| Frontline PLC | 3.7% |
SECTOR ALLOCATION

GEOGRAPHIC ALLOCATION

TOP TEN HOLDINGS
| BAWAG Group AG | 10.2% |
| Strathcona Resources Ltd. | 7.1% |
| MEG Energy Corp. | 6.9% |
| UniCredit SpA | 6.2% |
| Cenovus Energy, Inc. | 5.5% |
| Bankinter SA | 5.0% |
| Barclays PLC | 4.5% |
| Pandora AS | 4.2% |
| Glencore PLC | 4.0% |
| Frontline PLC | 3.7% |
Fund Expenses for the Last Six Months
(Based on a hypothetical $10,000 investment)
| Fund (Class) | Costs of a $10,000 investment | Costs paid as a percentage of a $10,000 investment |
| Smead International Value Fund (Investor Class/SVXLX) |
$66 | 1.25% |
Management’s Discussion of Fund Performance
SUMMARY OF RESULTS
The first half of fiscal year 2025 in the Smead International Value Fund (Investor Class/SVXLX) produced 12.80% for the shareholders compared to 14.21% for the MSCI EAFE NR Index and 11.81% for the MSCI ACWI ex-US NR Index.
TOP PERFORMANCE CONTRIBUTORS
Our best performers in the fiscal period were Bawag Group (BG AV), Unicredit SPA (UCG IM), and Bankinter (BKT SM).
TOP PERFORMANCE DETRACTORS
The top detractors for the fiscal period were West Fraser Timer (WFG CN), Cenovus Energy (CVE CN), and Whitehaven Coal (WHC AU).
Fund Performance
The following graph compares the initial and subsequent account values at the end of each of the completed fiscal years of the Investor Class shares since its inception on January 12, 2015. It assumes a $10,000 initial investment at inception in an appropriate, broad-based securities market index for the same period.
GROWTH OF $10,000
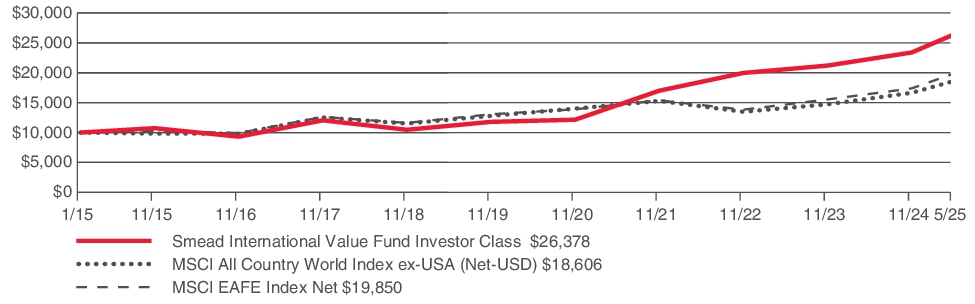
| AVERAGE ANNUAL TOTAL RETURN AS OF MAY 31, 2025 | 1 Year | 5 Year | 10 Year |
| Smead International Value Fund (Investor Class/SVXLX) | 2.50% | 24.38% | 8.88% |
| MSCI All Country World Index ex-USA (Net-USD) | 13.75% | 10.37% | 5.47% |
| MSCI EAFE Index Net | 13.33% | 11.42% | 5.97% |
Key Fund Statistics (as of May 31, 2025)
The following table outlines key Fund statistics that you should pay attention to.
| Fund Net Assets | $168,890,712 |
| Total number of portfolio holdings | 28 |
| Portfolio turnover rate | 14.13% |
Graphical Representation of Holdings (as of May 31, 2025)
The tables below show the investment makeup of the Fund, representing the percentage of the total net assets of the Fund.
TOP TEN HOLDINGS
| BAWAG Group AG | 10.2% |
| Strathcona Resources Ltd. | 7.1% |
| MEG Energy Corp. | 6.9% |
| UniCredit SpA | 6.2% |
| Cenovus Energy, Inc. | 5.5% |
| Bankinter SA | 5.0% |
| Barclays PLC | 4.5% |
| Pandora AS | 4.2% |
| Glencore PLC | 4.0% |
| Frontline PLC | 3.7% |
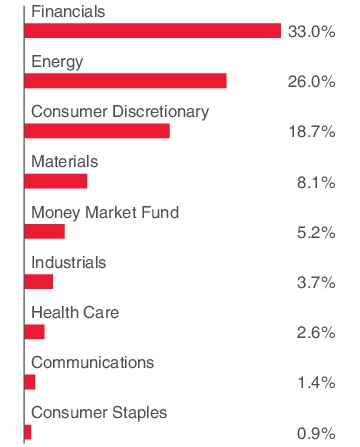
SECTOR ALLOCATION
GEOGRAPHIC ALLOCATION

TOP TEN HOLDINGS
| BAWAG Group AG | 10.2% |
| Strathcona Resources Ltd. | 7.1% |
| MEG Energy Corp. | 6.9% |
| UniCredit SpA | 6.2% |
| Cenovus Energy, Inc. | 5.5% |
| Bankinter SA | 5.0% |
| Barclays PLC | 4.5% |
| Pandora AS | 4.2% |
| Glencore PLC | 4.0% |
| Frontline PLC | 3.7% |