Exhibit 99.1
Explanatory Statement
Carrier Global Corporation ("we" or "our" or the "Company") is filing the following Exhibit 99.1 to recast certain amounts previously reported in the Company's 2024 Annual Report on Form 10-K filed with the SEC on February 11, 2025 (the "2024 Form 10-K") to conform with revisions to our reportable segments made during the quarter ended March 31, 2025.
As a result of our portfolio transformation, we revised our reportable segments to better reflect our business strategy, align our management reporting and increase transparency for investors. Under the revised segment structure, we have three new regional HVAC operating segments. Combined with the Climate Solutions Transportation operating segment, the four operating segments also serve as our reportable segments. In connection with the revised structure, we changed the measure used to evaluate segment profitability from Operating profit to Segment operating profit. All prior period comparative information has been recast to reflect the revised segment structure.
PART I
ITEM 1. BUSINESS
General
Carrier Global Corporation ("we" or "our" or the "Company") is a global leader in intelligent climate and energy solutions with a focus on providing differentiated, digitally-enabled lifecycle solutions to our customers. Our portfolio includes industry-leading brands such as Carrier, Viessmann, Toshiba, Automated Logic and Carrier Transicold that offer innovative heating, ventilating and air conditioning ("HVAC"), refrigeration and cold chain transportation solutions to help make the world safer and more comfortable. We also provide a broad array of related building services, including audit, design, installation, system integration, repair, maintenance and monitoring.
Through our performance-driven culture, we anticipate creating long-term shareowner value by investing strategically to strengthen our product position in homes, buildings and across the cold chain in order to drive profitable growth. We believe our business segments are well positioned to benefit from favorable secular trends, including the mega-trends of urbanization, population growth and demographic shifts, food security and safety, digitalization, global connectivity and energy efficiency. Coupled with our industry-leading brands and track record of innovation, we continue to provide market-leading solutions for our customers.
In addition, we continue to invest in product and technology innovation within our offerings as well as invest in new business models including Carrier Energy, our solution to reduce demands on power grids and energy infrastructure by better managing energy consumption and reducing end-customer energy costs. This new business model is also expected to provide a digital connection between the end-customers and Carrier, providing us with opportunities to offer services and aftermarket parts and components over the life of a product.
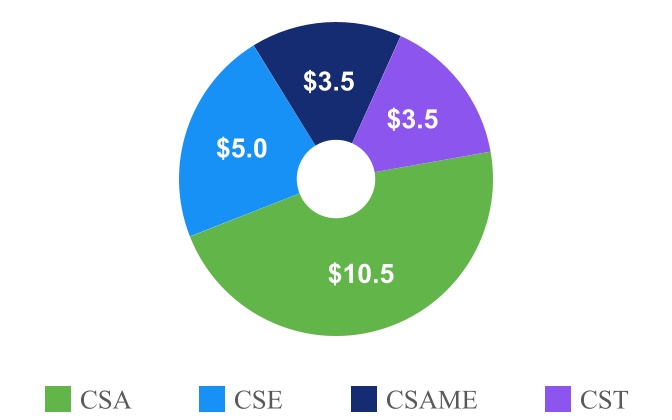
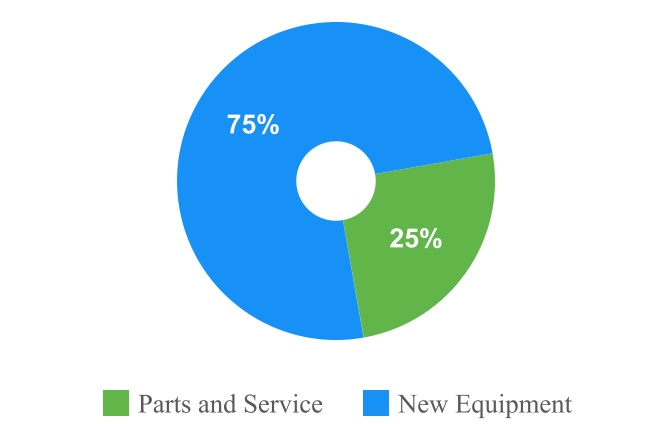
For the year ended December 31, 2024, our net sales were $22.5 billion and our operating profit was $2.6 billion. Our international operations, including U.S. export sales, represented approximately 50% of our net sales for 2024. During the same period, new equipment comprised 75% and parts and service comprised 25% of our net sales.
| | | | | | | | | | |
| Sales by Segment | | | | Sales by Type |
Separation from United Technologies Corporation
On April 3, 2020 (the "Distribution Date"), United Technologies Corporation, ("UTC"), since renamed RTX Corporation ("Raytheon Technologies Corporation" or "RTX") completed the spin-off of Carrier into an independent publicly traded company (the "Separation") through a pro rata distribution (the "Distribution") on a one-for-one basis of all of the outstanding shares of common stock of Carrier to UTC shareowners who held shares of UTC common stock as of the close of business on March 19, 2020, the record date of the Distribution. In addition, we entered into several agreements with UTC and Otis Worldwide Corporation ("Otis") that govern various aspects of the relationship among us, UTC and Otis following the Separation and Distribution. As of December 31, 2024, only certain portions of the Tax Matters Agreement ("TMA") remain in effect.
Business Segments
In May 2025, we announced changes to reportable segments to better reflect our business strategy, align our management reporting and increase transparency for investors. Under the revised segment structure, we globally manage our business operations through four segments: Climate Solutions Americas ("CSA"), Climate Solutions Europe ("CSE"), Climate Solutions Asia Pacific, Middle East & Africa ("CSAME") and Climate Solutions Transportation ("CST"). Each respective segment's major products, services and distribution methods are as follows:
The Climate Solutions Americas, Climate Solutions Europe and Climate Solutions Asia Pacific, Middle East & Africa segments provide products and controls, services and system solutions to meet the heating, cooling and ventilation needs of our customers while enhancing building performance, health and energy efficiency on a regional basis. Products and controls, services and systems include air conditioners, heat pumps, heating systems, home and building energy management systems, aftermarket components, repair and maintenance services and rentals as well as modernization and upgrades through the product lifecycle. We serve a wide range of customers, including in the residential, commercial, education, healthcare, technology, retail, hospitality, data center, and infrastructure markets, among others. Products and controls, services and systems are sold directly to building contractors and owners and indirectly through joint ventures, independent sales representatives, distributors, wholesalers, dealers and retail outlets. Our established brands include Carrier, Viessmann, Toshiba, Automated Logic, Bryant, CIAT, Day & Night, Heil, NORESCO and Riello which offer innovative solutions and a complete portfolio of products to our customers. These products and controls, services and systems, in addition to the markets they serve, provide future service opportunities including replacement components, preventative and on-demand contractual maintenance and repair, digital monitoring and modifications/upgrades.
The Climate Solutions Transportation segment provides climate and energy solutions for customers globally. Our products, services, systems and monitoring solutions offer reliable transport and preservation of food, medicine and other perishable cargo. Products include trucks, trailers, shipping containers and intermodal applications to meet customer needs for both ground transport and ocean freight, while services include maintenance, repair, and monitoring. Products and services are sold directly to transportation companies and indirectly through joint ventures, independent sales representatives, distributors, wholesalers and dealers. Products and services are sold under established brand names, including Carrier Transicold and Sensitech. We provide customers the flexibility to select solutions from a very broad range of technologies including fossil fuel applications and electric solutions to best adhere to their objectives and preferences as well as regulatory requirements. In addition, our focus on digitalization and innovation is expanding our offering of service and aftermarket solutions, including on-demand and subscription-based monitoring of customer cargo. Through the lifecycle of the product, we also offer modifications and upgrades to the current installed base, improving energy efficiency, noise or other customer requirements.
Portfolio Transformation
In 2023, we began the journey to further simplify our company and accelerate our business strategy. Our actions transformed our business portfolio in an effort to establish us as a pure-play, global leader in intelligent climate and energy solutions. We believe that our greater focus on breakthrough innovation, electrification, energy-efficient solutions, the use of environmentally friendly refrigerants and connected ecosystems will further strengthen our global leadership position in our end-markets and provide responsible solutions for our customers.
On April 25, 2023, we announced that we entered into a Share Purchase Agreement (the “Agreement”) to acquire the climate solutions business (the "VCS Business") of Viessmann Group GmbH & Co. KG (“Viessmann”), a privately-held company. The VCS Business develops intelligent, integrated and sustainable technologies, including heat pumps, boilers, photovoltaic systems, home battery storage and digital solutions, primarily for residential customers in Europe. The acquisition was completed on January 2, 2024, and reported primarily within our Climate Solutions Europe segment.
On June 2, 2024, we completed the sale of our Access Solutions business ("Access Solutions") to Honeywell International Inc. ("Honeywell") for cash proceeds of $5.0 billion. Access Solutions, historically reported in our Fire & Security segment, is a global supplier of physical security and digital access solutions supporting the hospitality, commercial, education and military markets. We recognized a net gain on the sale of $1.8 billion.
On July 1, 2024, we completed the sale of our Industrial Fire business ("Industrial Fire") for cash proceeds of $1.4 billion. Industrial Fire, historically reported in our Fire & Security segment, is a leading manufacturer of a full spectrum of fire detection and suppression solutions and services in critical high-hazard environments, including oil and gas, power generation, marine and offshore facilities, automotive, data centers and aircraft hangars. We recognized a net gain on the sale of $319 million.
On October 1, 2024, we completed the sale of our Commercial Refrigeration business ("CCR") for cash proceeds of $679 million. CCR, historically reported in our Climate Solutions Transportation segment, is a global supplier of turnkey solutions for commercial refrigeration systems and services, with a primary focus on serving food retail customers, cold storage facilities and warehouses. We recognized a net gain on the sale of $292 million. The net proceeds received are subject to working capital and other adjustments provided in the stock purchase agreement.
On December 2, 2024, we completed the sale of our Commercial and Residential Fire business ("CRF Business") for cash proceeds of $2.9 billion. The CRF Business, historically reported in our Fire & Security segment, is a leading manufacturer of fire detection and alarm solutions for both commercial and residential applications. We recognized a net gain on the sale of $1.4 billion. The net proceeds received are subject to working capital and other adjustments provided in the stock purchase agreement.
Business Strategy
Our vision is to be a global leader in intelligent climate and energy solutions with a focus on providing differentiated, digitally-enabled lifecycle solutions to our customers. To achieve our vision, our core business strategy is to create innovative, differentiated products and solutions to provide a fully-integrated customer experience in order to be our customer’s preferred provider. We believe our strategy is supported by significant favorable secular trends, our industry-leading brands and track record of innovation. Our business strategy is built around the following pillars to drive long-term growth and deliver shareholder value:
Differentiated Products, Channels and Brands
Our strategy involves driving organic growth by further enhancing our proven track record of innovation, which is focused on designing smarter, more connected and more efficient sustainable systems and solutions. Our strategy also relies on our iconic, industry-leading brands and on strengthening our long-term relationships with channel partners and customers by offering solutions that anticipate customer needs with a focus on technologies related to energy efficiency, emissions, air quality, electrification, refrigerants with lower global warming potential and noise reduction.
Digitally-Enabled Lifecycle Solutions
We are focused on offering a comprehensive and differentiated suite of sustainable technologies and services. We expect that these solutions increase our total available market opportunity, enhance our predictive service and maintenance capabilities, strengthen our customer intimacy and increase aftermarket growth. Beginning with product design, our product offerings are moving towards digitally-enabled solutions that connect us to our customers throughout the product’s full lifecycle and help us grow our aftermarket sales. We plan to meet our customer’s needs by offering a wider-range of aftermarket products and services including replacement components, preventative and on-demand maintenance and repair, digital monitoring and modifications/upgrades. Our digitally-enabled lifecycle solutions include Abound, a cloud-based building platform that unlocks and unites building data to create healthy, sustainable and intelligent solutions for indoor spaces. It gathers data from disparate systems, sensors and sources; identifies opportunities to optimize performance; and works with healthy building solutions to improve occupant experiences. In addition, our Lynx digital platform, developed in collaboration with Amazon Web Services (“AWS”), allows customers to leverage data to enhance visibility, resiliency, agility and efficiency in the cold chain to reduce loss of cargo, lower operations costs and support real-time decisions.
Expand Portfolio with Energy Management Solutions
As power grids and transportation infrastructure shift from fossil fuels to renewables, we will continue to position ourselves as a leader in innovative solutions that reduce emissions and energy consumption and promote power grid stability. Our solutions range from residential home energy management to sustainable solutions for commercial and industrial buildings to optimized low noise and low gas emission transport solutions. With the addition of the VCS Business on January 2, 2024, we are well positioned to provide complete energy solutions globally. Our portfolio includes environmentally friendly refrigerants, high temperature heat pumps for use in industrial and commercial applications, natural refrigerant heat pumps for residential buildings and a connected ecosystem for homes including solar PV, batteries and a differentiated digital platform, all supported by extensive service and aftermarket offerings.
Strategic Capital Allocation
Our priorities for capital deployment include funding organic growth, acquisitions and capital returns to shareowners through a growing and sustainable dividend and share repurchases. We pursue potential acquisitions to complement existing products and services and to expand the range of technologies and solutions available to our customers. We leverage our global operations, the strength of our iconic, industry-leading brands and our success in creating valuable partnerships to focus on targeted expansion into new locations and channels where we believe that we can drive profitable growth. These drivers are supported by research and development activities with a focus on new product development and new technology innovation. In addition, Carrier Ventures, our global venture capital wholly-owned subsidiary, focuses on investments to accelerate the development of sustainable innovations and disruptive technologies to transform future building and cold chain management. It engages in strategic partnerships with high growth organizations as they invest in the development of technologies to innovate and commercialize the next generation of integrated offerings.
Other Matters Relating to Our Business as a Whole
Competitive Conditions
Each of our businesses is subject to significant competition from a number of companies throughout the world. Due to the nature of our products and services and the markets we serve, our competition can vary from regional or specialized companies to larger public or private companies.
The most significant competitive factors we face are technology differentiation, product performance, service, delivery schedule and price. Brand reputation, service to customers and quality are also important competitive factors for our products and services. While our competitive position varies among our products and services, we are a significant competitor with respect to each of our major product and service offerings. We believe that the loss of any individual contract or customer would not have a material adverse effect on our results.
Raw Materials and Supplies
We rely on suppliers and commodity markets to secure components and raw materials such as copper, aluminum and steel. In addition, we also use semi-conductors and other electronic components in the manufacture of our products. To maximize our buying effectiveness and leverage our scale, we have a central strategic sourcing group that consolidates purchases of certain materials and components across our business segments. We work closely with our suppliers to ensure availability of products and implement other cost savings initiatives. In addition, we continue to invest in our supply chain to improve its resilience with a focus on automation, dual sourcing of critical components and localized manufacturing when feasible.
Intellectual Property
We maintain a broad portfolio of patents, trademarks, copyrights, trade secrets, licenses and franchises related to our business to protect our research and development investments and to maintain our competitive advantages. We hold approximately 12,000 active patents and pending patent applications worldwide. From time to time, we take actions to protect our business by asserting our intellectual property rights against third-party infringement. We believe that we have taken reasonable measures to build and protect this portfolio of intellectual property rights, but we cannot be assured that these rights will not be challenged, found invalid or unenforceable.
Operating System
We plan to continue to foster operational, financial and commercial excellence to drive sales and earnings growth. With roots in our legacy manufacturing and business processes, the Carrier operating system — Carrier Excellence — is our continuous improvement framework that is expected to drive operational excellence across our businesses. Our Supplier Excellence program is intended to apply these same operating principles to our supply base and we continue to focus on strategic cost reductions through operational efficiency, digitalization, automation and supply chain productivity.
Joint Ventures and Strategic Relationships
Our joint ventures and strategic relationships are an important part of our business. We hold direct ownership interests in approximately 55 joint ventures, the financial results of which are accounted for by the equity method of accounting or the cost basis of accounting, of which 61% relates to Climate Solutions Americas and 34% relates to Climate Solutions Asia Pacific, Middle East & Africa. These relationships engage in distribution, manufacturing and product development activities and are integral to our business operations and growth strategy.
Seasonality
Demand for certain of our products and services is seasonal and can be impacted by weather conditions. For instance, sales and services of our HVAC products to residential customers have historically been higher in the second and third quarters of the calendar year, which represent the peak seasons for air conditioning-related sales in North America markets. A change in building and remodeling activity also can affect our financial performance. In addition, our financial performance may be influenced by the production and utilization of transport equipment, including truck production cycles in North America and Europe.
Compliance with the Regulation of our Business and Operations
We operate our businesses and sell our products all over the world. As a result, rapid changes in legislation, regulations and government policies affect our operations and business in the countries, regions and localities in which we operate and sell our products. International accords such as the Paris Agreement and the subsequent U.S. climate policies to meet its nationally determined contributions as well as local regulations in the U.S. reducing the use of fossil fuels in buildings all have the potential to impact our products and service offerings. Such changes, which can render our products and technologies non-compliant, involve refrigerants, noise levels, product and fire safety, hydrofluorocarbon emissions, fluorinated gases, hazardous substances and electric and electronic equipment waste. Increased fragmentation of regulatory requirements changes the manner in which we conduct our business and increases our costs because it necessitates the development of country or regional specific variants, monitoring of and compliance with those regulations and additional testing and certifications. In addition, our operations are subject to and affected by environmental regulations promulgated by federal, state and local authorities in the U.S. and by authorities with jurisdiction over our foreign operations. We have made, and will be required to continue to make, capital expenditures to design and upgrade our products to comply with or exceed environmental and other regulations and energy efficiency standards. However, we believe that the costs related to compliance requirements for environmental or other government regulations will not have a material adverse effect on our capital expenditures, financial results or competitive position.
Environmental Goals
As a global leader in intelligent climate and energy solutions, we are committed to making the world safer, sustainable and more comfortable. We have set ambitious sustainability goals to be reached by 2030, which include the following:
•Invest over $4 billion to develop intelligent climate and energy solutions that reduce environmental impacts,
•Avoid more than 1 gigaton of customer greenhouse gas emissions,
•Achieve carbon neutral operations,
•Reduce energy intensity by 10% across our operations,
•Develop water stewardship programs across our global operations, prioritizing water-scarce locations, and
•Promote sustainability and positively impact communities and our workforce through education, partnerships, programs and volunteering our time and talent.
Human Capital Management
At Carrier, we strive to connect our people to our purpose, our vision, our strategic priorities, our culture and each other, with the ultimate goal to engage our teams, drive success and create value for our customers and shareowners.
Culture and People
Our operating fundamentals - The Carrier Way, Leading People The Carrier Way, and Carrier Excellence – serve as a basis for how we operate our company and drive success, as One Team. The Carrier Way outlines our vision, values, and cultural behaviors. Leading People The Carrier Way sets expectations for people leaders and how we build the best teams. Carrier Excellence is our continuous improvement operating system, a mindset that focuses the organization on enhancing efficiency, and delivering high-quality outcomes across all facets of our business.
Our employees collaborate as one team across more than 50 countries. We develop and deploy best-in-class programs and practices, provide enriching career opportunities, listen to employee feedback and always challenge ourselves to do better. As of December 31, 2024, we had approximately 48,000 employees worldwide, of which 35% are located in the Americas, 34% are located in Europe and 31% are located in Asia Pacific, Middle East & Africa.
We are an employer of choice and we focus on our Build Best Teams cultural behavior priority through the deployment of our talent ecosystem that connects strategy, embeds talent in our culture and activates it through people programs, processes and leadership. One of our core values in The Carrier Way, inclusion, is fundamental to who we are and what we do. We aspire to have an inclusive culture where each and every employee can come to work, every day, feeling like they _belong, and can contribute to their fullest and greatest potential. We continuously evaluate, modify and enhance our recruitment and retention strategies as part of the overall management of our business.
Aligned to our fundamentals and talent ecosystem, we promote learning and development through technical and leadership programs, as well as tuition assistance to enhance our employees’ skills and abilities. Our offerings include an online platform, strategic partnerships and on-site technical training centers. We conduct annual leadership development reviews to identify future leaders and foster succession planning. We also renew our talent pipeline with internships and early career rotational programs. Through a strategic approach to human capital, we are creating an environment where employees thrive, belong, and contribute to a more sustainable and resilient world.
Employee Well-being, Health and Safety
Creating an environment where employees thrive includes prioritizing health, safety, and overall well-being. We are committed to maintaining world-class standards.
Our Environmental, Health and Safety program is focused on eliminating the risk of serious injuries, illness and fatalities to employees, contractors and customers during manufacturing, installation, servicing and other business activities. We apply rigorous standards to ensure that our operations and premises comply with national and local regulations and our incident reporting requirements. For 2024, our total recordable incident rate ("TRIR"), based upon the number of employee injuries per 200,000 hours worked, was 0.32 and our lost time incident rate ("LTIR") was 0.15.
Our global well-being programs support employees’ physical, mental and financial health, offering flexible benefits, mental health resources, hybrid-work and financial planning tools. Our total rewards philosophy is designed to align the compensation of our employees with individual and company performance and to provide the appropriate market-competitive incentives to attract, retain and motivate employees to achieve superior results.
We measure the Pulse of our workforce three times per year through company-wide employee surveys to help us understand how employees feel about working at Carrier and what we can do to improve their experience.
As of December 31, 2024, in the U.S., 90% of our approximately 4,000 production and maintenance employees were covered under six collective bargaining agreements with expiration dates ranging from 2025 to 2027. In Europe, approximately 16,200 employees are represented by a European Works Council and, at national and local levels, we inform and consult with 49 local works councils and with unions representing employees at approximately 40 sites. Relations with our labor unions and works councils are generally positive.
Corporate Information
Carrier was incorporated in Delaware in connection with the Separation on March 15, 2019. Our principal executive offices are located at 13995 Pasteur Boulevard, Palm Beach Gardens, Florida 33418, and our telephone number is (561) 365-2000. We maintain an Internet website at www.corporate.carrier.com.
ITEM 2. PROPERTIES
We operate approximately 900 sites, which comprise approximately 36 million square feet of productive space. Of these, our facilities and key manufacturing sites greater than 100,000 square feet comprise approximately 27 million square feet of productive space. Approximately 26%, 24%, 30% and 9% of these significant properties are associated with our Climate Solutions Americas, Climate Solutions Europe, Climate Solutions Asia Pacific, Middle East & Africa and Climate Solutions Transportation segments, respectively, with approximately 11% not associated with a particular segment. Approximately 35% of these significant properties are leased and the remainder are owned. Approximately 30% of these significant properties are located in the U.S.
Our fixed assets as of December 31, 2024, include manufacturing facilities and non-manufacturing facilities, such as warehouses and machinery and equipment, most of which is general purpose machinery and equipment that use special jigs, tools and fixtures and that, in many instances, have automatic control features and special adaptations. The facilities, warehouses, machinery and equipment in use as of December 31, 2024, are in good operating condition, are well-maintained and substantially all are in regular use.
PART II
ITEM 7. MANAGEMENT'S DISCUSSION AND ANALYSIS OF FINANCIAL CONDITION AND RESULTS OF OPERATIONS
BUSINESS OVERVIEW
Business Summary
Carrier Global Corporation ("we" or "our") is a global leader in intelligent climate and energy solutions with a focus on providing differentiated, digitally-enabled lifecycle solutions to our customers. Our portfolio includes industry-leading brands such as Carrier, Viessmann, Toshiba, Automated Logic and Carrier Transicold that offer innovative heating, ventilating and air conditioning ("HVAC"), refrigeration and cold chain transportation solutions to help make the world safer and more comfortable. We also provide a broad array of related building services, including audit, design, installation, system integration, repair, maintenance and monitoring. Our operations are classified into four segments: Climate Solutions Americas, Climate Solutions Europe, Climate Solutions Asia Pacific, Middle East & Africa and Climate Solutions Transportation.
Through our performance-driven culture, we anticipate creating long-term shareowner value by investing strategically to strengthen our product position in homes, buildings and across the cold chain in order to drive profitable growth. We believe our business segments are well positioned to benefit from favorable secular trends, including the mega-trends of urbanization, population growth and demographic shifts, food security and safety, digitalization, global connectivity and energy efficiency. Coupled with our industry-leading brands and track record of innovation, we continue to provide market-leading solutions for our customers.
Our worldwide operations are affected by global and regional industrial, economic and political factors, trade policies and trends. They are also affected by changes in the general level of economic activity, such as changes in business and consumer spending, construction and shipping activity as well as short-term economic factors such as currency fluctuations, commodity price volatility and supply disruptions. We continue to invest in our business, take pricing actions to mitigate supply chain and inflationary pressures, develop new products and services in order to remain competitive in our markets and use risk management strategies to mitigate various exposures.
We are actively monitoring recent trade policy and tariff announcements including the three executive orders issued by the President in February 2025 directing the United States to impose new tariffs on imports from Canada, Mexico and China and the subsequent announcement that the Administration intended to pause tariffs on Canada and Mexico for a month. We are currently evaluating the potential impact of the announced tariffs on our business and financial condition and actions we may take to mitigate the impact. In addition, we are currently monitoring the potential impact, if any, of actions taken by these countries in response to the announced tariffs. There can be no assurance that the future imposition of any tariffs, changes thereto or potential actions taken by countries in response to the tariffs will not have a material adverse effect upon our results of operations, financial condition or liquidity in any period or that any actions we take to mitigate the impact of the tariffs will be effective.
Significant Events
Acquisition of Viessmann Climate Solutions
On April 25, 2023, we announced that we entered into a Share Purchase Agreement (the “Agreement”) to acquire the climate solutions business (the "VCS Business") of Viessmann Group GmbH & Co. KG (“Viessmann”), a privately-held company. The VCS Business develops intelligent, integrated and sustainable technologies, including heat pumps, boilers, photovoltaic systems, home battery storage and digital solutions, primarily for residential customers in Europe. The acquisition was completed on January 2, 2024. As a result, the assets, liabilities and results of operations of the VCS Business are consolidated in the accompanying Consolidated Financial Statements as of the date of acquisition and reported predominantly within our Climate Solutions Europe segment.
Portfolio Transformation
On June 2, 2024, we completed the sale of our Access Solutions business ("Access Solutions") for cash proceeds of $5.0 billion. Access Solutions, historically reported in our Fire & Security segment, is a global supplier of physical security and digital access solutions supporting the hospitality, commercial, education and military markets. We recognized a net gain on the sale of $1.8 billion, which is included in Discontinued operations, net of tax on the accompanying Consolidated Statement of Operations during the year ended December 31, 2024.
On July 1, 2024, we completed the sale of our Industrial Fire business ("Industrial Fire") for cash proceeds of $1.4 billion. Industrial Fire, historically reported in our Fire & Security segment, is a leading manufacturer of a full spectrum of fire detection and suppression solutions and services in critical high-hazard environments, including oil and gas, power generation, marine and offshore facilities, automotive, data centers and aircraft hangars. We recognized a net gain on the sale of $319 million, which is included in Discontinued operations, net of tax on the accompanying Consolidated Statement of Operations during the year ended December 31, 2024.
On October 1, 2024, we completed the sale of our Commercial Refrigeration business ("CCR") for cash proceeds of $679 million. CCR, historically reported in our Climate Solutions Transportation segment, is a global supplier of turnkey solutions for commercial refrigeration systems and services, with a primary focus on serving food retail customers, cold storage facilities and warehouses. We recognized a gross gain on the sale of $318 million, which is included in Other income (expense), net on the accompanying Consolidated Statement of Operations during the year ended December 31, 2024. The net proceeds received are subject to working capital and other adjustments provided in the stock purchase agreement.
On December 2, 2024, we completed the sale of our Commercial and Residential Fire business ("CRF Business") for cash proceeds of $2.9 billion. The CRF Business, historically reported in our Fire & Security segment, is a leading manufacturer of fire detection and alarm solutions for both commercial and residential applications. We recognized a net gain on the sale of $1.4 billion, which is included in Discontinued operations, net of tax on the accompanying Consolidated Statement of Operations during the year ended December 31, 2024. The net proceeds received are subject to working capital and other adjustments provided in the stock purchase agreement.
Segment Reorganization
As a result of our portfolio transformation, we revised our reportable segments to better reflect our business strategy, align our management reporting and increase transparency for investors. Under the revised segment structure, we have three new regional HVAC operating segments. Combined with the existing Climate Solutions Transportation operating segment, the four operating segments also serve as our reportable segments. This model is designed to create a simplified, more focused and customer-centric organization across the globe. Each segment reports through separate management teams which regularly review their operating results with our Chief Operating Decision Maker (the "CODM") determined in accordance with applicable accounting guidance. In connection with the revised structure, the CODM changed the measure used to evaluate segment profitability from Operating profit to Segment operating profit. All prior period comparative information has been recast to reflect the revised segment structure.
Deconsolidation of Kidde-Fenwal, Inc.
On May 14, 2023, Kidde-Fenwal, Inc. ("KFI"), an indirect wholly-owned subsidiary of ours, filed a petition for voluntary reorganization under Chapter 11 of the United States Bankruptcy Code ("Chapter 11") in the United States Bankruptcy Court for the District of Delaware. KFI, an industrial fire detection and suppression business historically reported in our Fire & Security segment, filed a voluntary petition with the United States Bankruptcy Court for the District of Delaware (the “Bankruptcy Court”) seeking relief under chapter 11 of the Bankruptcy Code. As of the petition date, KFI was deconsolidated and its respective assets and liabilities were derecognized from our Consolidated Financial Statements.
Acquisition of Toshiba Carrier Corporation
On February 6, 2022, we entered into a binding agreement to acquire a majority ownership interest in Toshiba Carrier Corporation ("TCC"), a variable refrigerant flow ("VRF") and light commercial HVAC joint venture between Carrier and Toshiba Corporation. The acquisition was completed on August 1, 2022. As a result, the assets, liabilities and results of operations of TCC are consolidated in the accompanying Consolidated Financial Statements as of the date of acquisition and reported predominantly within our Climate Solutions Asia Pacific, Middle East & Africa segment. Upon closing, Toshiba Corporation retained a 5% ownership interest in TCC.
Sale of Chubb Fire & Security Business
On July 26, 2021, we entered into a stock purchase agreement to sell our Chubb Fire & Security business ("Chubb") to APi Group Corporation ("APi"). Chubb, which was reported within our Fire & Security segment, delivered essential fire safety and security solutions from design and installation to monitoring, service and maintenance across more than 17 countries around the globe. On January 3, 2022, we completed the sale of Chubb (the "Chubb Sale") for net proceeds of $2.9 billion and recognized a gain on the sale of $1.1 billion during the year ended December 31, 2022.
RESULTS OF OPERATIONS
This discussion summarizes the significant factors affecting our consolidated results of operations, financial condition and liquidity for the year ended December 31, 2024, compared with December 31, 2023, as well as the year ended December 31, 2023, compared with December 31, 2022. This discussion should be read in conjunction with Item 8, the Consolidated Financial Statements and the accompanying Notes to the Consolidated Financial Statements in this Annual Report.
Year Ended December 31, 2024 Compared with Year Ended December 31, 2023
The following represents our consolidated net sales and operating results:
| | | | | | | | | | | | | | | | | | | | | | | | |
| (In millions) | 2024 | | 2023 | | Period Change | | % Change | |
| Net sales | $ | 22,486 | | | $ | 18,951 | | | $ | 3,535 | | | 19 | % | |
| Cost of products and services sold | (16,505) | | | (13,789) | | | (2,716) | | | 20 | % | |
| Gross margin | 5,981 | | | 5,162 | | | 819 | | | 16 | % | |
| | | | | | | | |
| | | | | | | | |
| | | | | | | | |
| | | | | | | | |
| Operating expenses | (3,335) | | | (3,002) | | | (333) | | | 11 | % | |
| Operating profit | 2,646 | | | 2,160 | | | 486 | | | 23 | % | |
| | | | | | | | |
| | | | | | | | |
| Non-operating income (expense), net | (372) | | | (161) | | | (211) | | | 131 | % | |
| Earnings (loss) before income taxes | 2,274 | | | 1,999 | | | 275 | | | 14 | % | |
| Income tax expense | (1,062) | | | (521) | | | (541) | | | 104 | % | |
| Earnings (loss) from continuing operations | 1,212 | | | 1,478 | | | (266) | | | (18) | % | |
| Discontinued operations, net of income taxes | 4,496 | | | (38) | | | 4,534 | | | (11932) | % | |
| Net earnings (loss) | 5,708 | | | 1,440 | | | 4,268 | | | 296 | % | |
| Less: Non-controlling interest in subsidiaries' earnings from operations | 104 | | | 91 | | | 13 | | | 14 | % | |
| Net earnings (loss) attributable to common shareowners | $ | 5,604 | | | $ | 1,349 | | | $ | 4,255 | | | 315 | % | |
Net Sales
For the year ended December 31, 2024, Net sales was $22.5 billion, a 19% increase compared with the same period of 2023.
The components of the year-over-year change were as follows:
| | | | | | |
| 2024 | |
| Organic / Operational | 3 | % | |
| | |
| Acquisitions and divestitures, net | 16 | % | |
| | |
| Total % change | 19 | % | |
Organic sales for the year ended December 31, 2024, increased by 3% compared with the same period of 2023. The organic increase was primarily due to our Climate Solutions Americas segment as strong end-market demand continued to drive higher volumes. Results in our Climate Solutions Europe segment were flat. These results were partially offset by lower end-market demand in both Climate Solutions Asia Pacific, Middle East & Africa and Climate Solutions Transportation. Refer to "Segment Review" below for a discussion of Net sales by segment.
Gross Margin
For the year ended December 31, 2024, gross margin was $6.0 billion, a 16% increase compared with the same period of 2023. The components were as follows:
| | | | | | | | | | | |
| (In millions) | 2024 | | 2023 |
| Net sales | $ | 22,486 | | | $ | 18,951 | |
| Cost of products and services sold | (16,505) | | | (13,789) | |
| Gross margin | $ | 5,981 | | | $ | 5,162 | |
| Percentage of net sales | 26.6 | % | | 27.2 | % |
Gross margin increased by $819 million compared with the year ended December 31, 2023. The main driver of the increase related to ongoing customer demand, pricing improvements and our continued focus on productivity initiatives. Operating results associated with the VCS Business since the date of acquisition further benefited gross margin during the period. However, the results of the VCS Business included inventory step-up, backlog amortization and intangible asset amortization resulting from the recognition of acquired assets at fair value. These costs had a 260 basis point unfavorable impact on gross margin as a percentage of Net sales. As a result, gross margin as a percentage of Net sales decreased by 60 basis points compared with the same period of 2023.
Operating Expenses
For the year ended December 31, 2024, operating expenses, including Equity method investment net earnings, was $3.3 billion, a 11% increase compared with the same period of 2023. The components were as follows:
| | | | | | | | | | | | | |
| For the Year Ended December 31, | | |
| (In millions) | 2024 | | 2023 | | |
| Selling, general and administrative | $ | (3,197) | | | $ | (2,607) | | | |
| Research and development | (686) | | | (493) | | | |
| Equity method investment net earnings | 231 | | | 211 | | | |
| Other income (expense), net | 317 | | | (113) | | | |
| Operating expenses | $ | (3,335) | | | $ | (3,002) | | | |
| Percentage of net sales | 14.8 | % | | 15.8 | % | | |
| | | | | |
For the year ended December 31, 2024, Selling, general and administrative expenses were $3.2 billion, a 23% increase compared with the same period of 2023. The increase is primarily due to incremental expenses associated with the VCS Business since the date of acquisition. In addition, higher compensation and other employee-related costs further contributed to the increase. The current year also included $95 million of acquisition and divestiture-related costs compared with $123 million during the year ended December 31, 2023.
Research and development costs relate to new product development and new technology innovation. Due to the variable nature of program development schedules, year-over-year spending levels can fluctuate. In addition, we continue to invest to prepare for future energy efficiency and refrigerant regulation changes and in digital controls technologies.
Investments over which we do not exercise control, but have significant influence, are accounted for using the equity method of accounting. For the year ended December 31, 2024, Equity method investment net earnings were $231 million, a 9% increase compared with the same period of 2023. The increase was primarily driven by higher earnings in joint ventures across all regions. The increase was partially offset by a $23 million charge associated with the devaluation of U.S. Dollar denominated balances at an equity investment located in Egypt and reported in Climate Solutions Asia Pacific, Middle East & Africa. In addition, prior year results include a $16 million benefit recognized in connection with a favorable tax ruling at a minority owned joint venture.
Other income (expense), net primarily includes the impact of gains and losses related to the sale of businesses or interests in our equity method investments, foreign currency gains and losses on transactions that are denominated in a currency other than an entity's functional currency and hedging-related activities. During the year ended December 31, 2024, we completed the sale of CCR and recognized a gain on the sale of $318 million. In addition, we recognized a $46 million gain associated with our share of United Technologies Corporation's conclusion of certain income tax matters from their 2017 and 2018 tax audit with the Internal Revenue Service ("IRS"). In connection with the acquisition of the VCS Business, we recognized an $86 million loss on the mark-to-market valuation of our window forward contracts associated with the expected cash outflows of the Euro-denominated purchase price.
During the year ended December 31, 2023, we recognized a $96 million loss on the mark-to-market valuation of our window forward contracts associated with the expected cash outflows of the Euro-denominated purchase price of the VCS Business. In addition, the carrying value of our previously held equity investments in TCC were recognized at fair value at the date of acquisition. As a result, we recognized an $8 million non-cash loss associated with the increase in our ownership interest.
Non-Operating Income (Expense), net
For the year ended December 31, 2024, Non-operating income (expense), net was $372 million, a 131% increase compared with the same period of 2023. The components were as follows:
| | | | | | | | | | | | |
| For the Year Ended December 31, | |
| (In millions) | 2024 | | 2023 | |
| Non-service pension benefit (expense) | $ | (1) | | | $ | (1) | | |
| | | | |
| Interest expense | (580) | | | (306) | | |
| Interest income | 209 | | | 146 | | |
| Interest (expense) income, net | (371) | | | (160) | | |
| | | | |
| Non-operating income (expense), net | $ | (372) | | | $ | (161) | | |
| | | | |
Non-operating income (expense), net includes the results from activities other than normal business operations such as interest expense, interest income and the non-service components of pension and post-retirement obligations. Interest expense is affected by the amount of debt outstanding and the interest rates on that debt. For the year ended December 31, 2024, interest expense was $580 million, a 90% increase compared with the same period of 2023. During 2024, we redeemed $1.0 billion aggregate principal amount of USD-denominated 5.80% notes due in 2025 and redeemed €750 million aggregate principal amount of 4.375% Euro-denominated notes due 2025 with the proceeds from the issuance of €750 million aggregate principal amount of 3.625% Euro-denominated notes due 2037. In addition, we completed tender offers to repurchase approximately $1.1 billion aggregate principal which included $125 million of notes due 2034, $350 million of notes due 2054, and approximately $600 million of notes due 2050. Combined, we incurred make-whole premiums of $14 million in Interest expense, wrote off $17 million of unamortized deferred financing costs in Interest expense and recognized a net gain of $97 million in Interest income. During 2023, we entered into several financing arrangements in connection with the acquisition of the VCS Business and capitalized $105 million of deferred financing costs. As a result, we amortized $55 million of deferred financing costs in Interest expense, of which $47 million related to our senior unsecured bridge term loan facility (the "Bridge Loan").
Income Taxes
| | | | | | | | | | | | | | | | |
| | | 2024 | | 2023 | | |
| Effective tax rate | | 46.7 | % | | 26.1 | % | | |
The effective tax rate for the year ended December 31, 2024, was higher than the statutory U.S. federal income tax rate. The increase was primarily driven by a net tax charge of $650 million related to a re-organization of the VCS Business and a non-deductible loss of $86 million on the mark-to-market valuation of our window forward contracts associated with the expected cash outflows of the Euro-denominated purchase price of the VCS Business, partially offset by the lower effective tax rate on the $318 million gain on the sale of CCR and $44 million of foreign tax credits generated and utilized in the current year.
The effective tax rate for the year ended December 31, 2023, was higher than the statutory U.S. federal income tax rate. The increase was primarily driven by a net tax charge of $27 million relating to the re-organization and disentanglement of the CCR businesses in advance of the planned divestiture. In addition, the effective tax rate was impacted by the recognition of a deferred tax liability for withholding tax of $19 million on repatriated foreign earnings, non-deductible divestiture-related costs and a non-deductible loss of $96 million on the mark-to-market valuation of our window forward contracts associated with the expected cash outflows of the Euro-denominated purchase price of the VCS Business.
Adjusted Operating Profit
We report our financial results in accordance with accounting principles generally accepted in the United States ("GAAP"). In addition, we supplement the reporting of our financial information determined under GAAP with certain non-GAAP financial information. Adjusted operating profit is a non-GAAP measure and defined as consolidated operating profit (a GAAP measure), excluding restructuring costs, amortization of acquired intangibles and other significant items of a nonoperational nature. This measure is useful to investors because it is how management assesses the operating performance of the business. A reconciliation of the amounts prepared in accordance with GAAP to the corresponding non-GAAP measure appears below and provides additional information as to the items and amounts that have been excluded from the adjusted measure.
| | | | | | | | | | | | | | |
| | For the Year Ended December 31, |
| (In millions) | | 2024 | | 2023 |
| Reconciliation to Adjusted operating profit | | | | |
| Operating profit | | $ | 2,646 | | | $ | 2,160 | |
| | | | |
| Restructuring costs | | 108 | | | 75 | |
| Amortization of acquired intangibles | | 689 | | | 143 | |
| Acquisition step-up amortization | | 282 | | | 41 | |
| Acquisition/divestiture-related costs | | 95 | | | 123 | |
| Viessmann-related hedges | | 86 | | | 96 | |
| CCR gain | | (318) | | | — | |
| Gain on liability adjustment | | (46) | | | — | |
| Bridge loan financing costs | | — | | | 3 | |
| TCC Acquisition-related gain | | — | | | 8 | |
| Adjusted operating profit | | $ | 3,542 | | | $ | 2,649 | |
Adjusted operating profit may not be comparable to similarly-titled measures used by other companies and should not be considered a substitute for Operating profit in accordance with GAAP. The non-GAAP information presented provides investors with additional useful information, but should not be considered in isolation or as a substitute for the related GAAP measure. Moreover, other companies may define non-GAAP measures differently, which limits the usefulness of these measures for comparisons with such other companies. We encourage investors to review our financial statements and publicly filed reports in their entirety and not to rely on any single financial measure.
Year Ended December 31, 2023 Compared with Year Ended December 31, 2022
The following represents our consolidated net sales and operating results:
| | | | | | | | | | | | | | | | | | | | | | | | |
| (In millions) | 2023 | | 2022 | | Period Change | | % Change | |
| Net sales | $ | 18,951 | | | $ | 17,288 | | | $ | 1,663 | | | 10 | % | |
| Cost of products and services sold | (13,789) | | | (12,991) | | | (798) | | | 6 | % | |
| Gross margin | 5,162 | | | 4,297 | | | 865 | | | 20 | % | |
| | | | | | | | |
| | | | | | | | |
| | | | | | | | |
| | | | | | | | |
| Operating expenses | (3,002) | | | (313) | | | (2,689) | | | 859 | % | |
| Operating profit | 2,160 | | | 3,984 | | | (1,824) | | | (46) | % | |
| | | | | | | | |
| | | | | | | | |
| Non-operating income (expense), net | (161) | | | (161) | | | — | | | — | % | |
| Earnings (loss) before income taxes | 1,999 | | | 3,823 | | | (1,824) | | | (48) | % | |
| Income tax expense | (521) | | | (616) | | | 95 | | | (15) | % | |
| Earnings (loss) from continuing operations | 1,478 | | | 3,207 | | | (1,729) | | | (54) | % | |
| Discontinued operations, net of income taxes | (38) | | | 377 | | | (415) | | | (110) | % | |
| Net earnings (loss) | 1,440 | | | 3,584 | | | (2,144) | | | (60) | % | |
| Less: Non-controlling interest in subsidiaries' earnings from operations | 91 | | | 50 | | | 41 | | | 82 | % | |
| Net earnings (loss) attributable to common shareowners | $ | 1,349 | | | $ | 3,534 | | | $ | (2,185) | | | (62) | % | |
Net Sales
For the year ended December 31, 2023, Net sales was $19.0 billion, a 10% increase compared with the same period of 2022. The components of the year-over-year change were as follows:
| | | | | |
| 2023 |
| Organic / Operational | 3 | % |
| |
| Acquisitions and divestitures, net | 7 | % |
| |
| Total % change | 10 | % |
Organic sales for the year ended December 31, 2023, increased by 3% compared with the same period of 2022. The organic increase was primarily due to our Climate Solutions Americas segment as strong end-market demand continued to drive higher volumes. In addition, higher volumes and pricing improvements benefited our Climate Solutions Asia Pacific, Middle East & Africa and Climate Solutions Europe segments. These results were partially offset by lower end-market demand in Climate Solutions Transportation. Refer to "Segment Review" below for a discussion of Net sales by segment.
On August 1, 2022, we acquired a majority ownership interest in TCC, a VRF and light commercial HVAC joint venture between Carrier and Toshiba Corporation. The results of TCC have been included in our Consolidated Financial Statements since the date of acquisition and reported predominantly within our Climate Solutions Asia Pacific, Middle East & Africa segment. The transaction added 6% to Net sales during the year ended December 31, 2023, and is included in Acquisitions and divestitures, net.
Gross Margin
For the year ended December 31, 2023, gross margin was $5.2 billion, a 20% increase compared with the same period of 2022. The components were as follows:
| | | | | | | | | | | |
| (In millions) | 2023 | | 2022 |
| Net sales | $ | 18,951 | | | $ | 17,288 | |
| Cost of products and services sold | (13,789) | | | (12,991) | |
| Gross margin | $ | 5,162 | | | $ | 4,297 | |
| Percentage of net sales | 27.2 | % | | 24.9 | % |
Gross margin increased by $865 million compared with the year ended December 31, 2022. A main driver of the increase related to ongoing customer demand, pricing improvements and our continued focus on productivity initiatives. In addition, operating results associated with TCC further benefited gross margin during the year. These amounts were partially offset by the higher cost of commodities and components used in our products and certain supply chain constraints. Although inflationary cost pressures have begun to moderate, they remain elevated and continue to impact the cost of products and services sold in each of our segments. Gross margin as a percentage of Net sales increased by 230 basis points compared with the same period of 2022.
Operating Expenses
For the year ended December 31, 2023, operating expenses, including Equity method investment net earnings, was $3.0 billion, an 859% increase compared with the same period of 2022. The components were as follows:
| | | | | | | | | | | | | |
| For the Year Ended December 31, | | |
| (In millions) | 2023 | | 2022 | | |
| Selling, general and administrative | $ | (2,607) | | | $ | (1,977) | | | |
| Research and development | (493) | | | (416) | | | |
| Equity method investment net earnings | 211 | | | 262 | | | |
| Other income (expense), net | (113) | | | 1,818 | | | |
| Operating expenses | $ | (3,002) | | | $ | (313) | | | |
| Percentage of net sales | 15.8 | % | | 1.8 | % | | |
| | | | | |
For the year ended December 31, 2023, Selling, general and administrative expenses were $2.6 billion, a 32% increase compared with the same period of 2022. The increase is primarily due to higher compensation, commissions and other employee-related costs during the current period. In addition, incremental selling, general and administrative expenses associated with TCC further contributed to the increase. The current year also included $123 million of acquisition and divestiture-related costs compared with $31 million during the year ended December 31, 2022.
Research and development costs relate to new product development and new technology innovation. Due to the variable nature of program development schedules, year-over-year spending levels can fluctuate. In addition, we continue to invest to prepare for future energy efficiency and refrigerant regulation changes and in digital controls technologies.
Investments over which we do not exercise control, but have significant influence, are accounted for using the equity method of accounting. For the year ended December 31, 2023, Equity method investment net earnings were $211 million, a 19% decrease compared with the same period of 2022. The decrease was primarily driven by the increase in our ownership interest in TCC on August 1, 2022. As a result, TCC is no longer accounted for under the equity method of accounting since the date of acquisition. The decrease was partially offset by a $16 million benefit recognized in connection with a favorable tax ruling at a minority owned joint venture. During the year ended December 31, 2022, pre-acquisition equity earnings of TCC totaled $87 million which included a $27 million gain on the sale of two minority owned subsidiaries.
Other income (expense), net primarily includes the impact of gains and losses related to the sale of businesses or interests in our equity method investments, foreign currency gains and losses on transactions that are denominated in a currency other than an entity's functional currency and hedging-related activities. During the year ended December 31, 2023, we recognized a $96 million loss on the mark-to-market valuation of our window forward contracts associated with the expected cash outflows of the Euro-denominated purchase price of the VCS Business.
In connection with the TCC acquisition, the carrying value of our previously held TCC equity investments were recognized at fair value at the date of acquisition. As a result, we recognized a $705 million non-cash gain associated with the increase in our ownership interest during the year ended December 31, 2022. In addition, we completed the Chubb Sale and recognized a net gain on the sale of $1.1 billion. Results for the year ended December 31, 2022 also included a $22 million charge resulting from a litigation matter within our Climate Solutions Asia Pacific, Middle East & Africa segment.
Non-Operating Income (Expense), net
For the year ended December 31, 2023, Non-operating income (expense), net was $161 million, flat compared with the same period of 2022. The components were as follows:
| | | | | | | | | | | | | |
| For the Year Ended December 31, | | |
| (In millions) | 2023 | | 2022 | | |
| Non-service pension benefit (expense) | $ | (1) | | | $ | (4) | | | |
| | | | | |
| Interest expense | (306) | | | (238) | | | |
| Interest income | 146 | | | 81 | | | |
| Interest (expense) income, net | (160) | | | (157) | | | |
| | | | | |
| Non-operating income (expense), net | $ | (161) | | | $ | (161) | | | |
| | | | | |
Non-operating income (expense), net includes the results from activities other than normal business operations such as interest expense, interest income and the non-service components of pension and post-retirement obligations. Interest expense is affected by the amount of debt outstanding and the interest rates on that debt. For the year ended December 31, 2023, interest expense was $306 million, a 29% increase compared with the same period of 2022. In connection with the proposed acquisition of the VCS Business, we entered into several financing arrangements and capitalized $105 million of deferred financing costs during 2023. As a result, we amortized $55 million of deferred financing costs in Interest expense, of which $47 million related to our senior unsecured bridge term loan facility (the "Bridge Loan"). During the year ended December 31, 2022, we completed tender offers to repurchase approximately $1.15 billion aggregate principal of our 2.242% Notes due 2025 and 2.493% Notes due 2027. Upon settlement, we wrote off $5 million of unamortized deferred financing costs in Interest expense and recognized a net gain of $33 million in Interest income.
Income Taxes
| | | | | | | | | | | | | | | | |
| | | 2023 | | 2022 | | |
| Effective tax rate | | 26.1 | % | | 16.1 | % | | |
The effective tax rate for the year ended December 31, 2023, was higher than our statutory U.S. federal income tax rate. The increase was primarily driven by a net tax charge of $27 million relating to the re-organization and disentanglement of the CCR businesses in advance of the planned divestiture. In addition, the effective tax rate was impacted by the recognition of a deferred tax liability for withholding tax of $19 million on repatriated foreign earnings, non-deductible divestiture-related costs and a non-deductible loss of $96 million on the mark-to-market valuation of our window forward contracts associated with the expected cash outflows of the Euro-denominated purchase price of the VCS Business.
The effective tax rate for the year ended December 31, 2022, was lower than our statutory U.S. federal income tax rate. The decrease was driven by a lower effective tax rate on the $705 million non-cash gain resulting from the recognition of our previously held TCC equity investments at fair value upon acquisition of TCC, a lower effective tax rate on the $1.1 billion Chubb gain and $45 million of foreign tax credits generated and utilized in 2022.
Adjusted Operating Profit
We report our financial results in accordance with accounting principles generally accepted in the United States ("GAAP"). In addition, we supplement the reporting of our financial information determined under GAAP with certain non-GAAP financial information. Adjusted operating profit is a non-GAAP measure and defined as consolidated operating profit (a GAAP measure), excluding restructuring costs, amortization of acquired intangibles and other significant items of a nonoperational nature. This measure is useful to investors because it is how management assesses the operating performance of the business. A reconciliation of the amounts prepared in accordance with GAAP to the corresponding non-GAAP measure appears below and provides additional information as to the items and amounts that have been excluded from the adjusted measure.
| | | | | | | | | | | | | | |
| | For the Year Ended December 31, |
| (In millions) | | 2023 | | 2022 |
| Reconciliation to Adjusted operating profit | | | | |
| Operating profit | | $ | 2,160 | | | $ | 3,984 | |
| | | | |
| Restructuring costs | | 75 | | | 20 | |
| Amortization of acquired intangibles | | 143 | | | 46 | |
| Acquisition step-up amortization | | 41 | | | 51 | |
| Acquisition/divestiture-related costs | | 123 | | | 31 | |
| Viessmann-related hedges | | 96 | | | — | |
| Bridge loan financing costs | | 3 | | | — | |
| TCC Acquisition-related gain | | 8 | | | (705) | |
| Chubb gain | | — | | | (1,105) | |
| Russia/Ukraine asset impairment | | — | | | 3 | |
| Charge resulting from legal matter | | — | | | 22 | |
| Adjusted operating profit | | $ | 2,649 | | | $ | 2,347 | |
Adjusted operating profit may not be comparable to similarly-titled measures used by other companies and should not be considered a substitute for Operating profit in accordance with GAAP. The non-GAAP information presented provides investors with additional useful information, but should not be considered in isolation or as a substitute for the related GAAP measure. Moreover, other companies may define non-GAAP measures differently, which limits the usefulness of these measures for comparisons with such other companies. We encourage investors to review our financial statements and publicly filed reports in their entirety and not to rely on any single financial measure.
Segment Review
We have four operating segments:
•Climate Solutions Americas provides products, controls, services and solutions to meet the heating, cooling and ventilation needs of residential and commercial customers in North and South America while enhancing building performance, health, energy efficiency and sustainability.
•Climate Solutions Europe provides products, controls, services and solutions to meet the heating, cooling and ventilation needs of residential and commercial customers in Europe while enhancing building performance, health, energy efficiency and sustainability.
•Climate Solutions Asia Pacific, Middle East & Africa provides products, controls, services and solutions to meet the heating, cooling and ventilation needs of residential and commercial customers in Asia Pacific, the Middle East and Africa while enhancing building performance, health, energy efficiency and sustainability.
•Climate Solutions Transportation includes global transport refrigeration and monitoring products, services and digital solutions for trucks, trailers, shipping containers, intermodal and rail.
Segment operating profit is the measure of profit and loss that our CODM uses to evaluate the financial performance of the business and as the basis for resource allocation, performance reviews and compensation. It represents operating profit (a GAAP measure) adjusted to exclude restructuring costs, amortization of acquired intangible assets and other significant items of a nonoperational nature.
Year Ended December 31, 2024 Compared with Year Ended December 31, 2023
Summary performance for each of our segments is as follows:
| | | | | | | | | | | | | | | | | | | | | | | | | | | | | | | | | | | | | | | | | | | | | | | |
| Net sales | | Segment operating profit | | Segment operating profit margin |
| (In millions) | 2024 | | 2023 | | | | | | 2024 | | 2023 | | | | | | 2024 | | 2023 | | | | |
| Climate Solutions Americas | $ | 10,527 | | | $ | 9,615 | | | | | | | $ | 2,323 | | | $ | 1,831 | | | | | | | 22.1 | % | | 19.0 | % | | | | |
| Climate Solutions Europe | 4,984 | | | 1,937 | | | | | | | 469 | | | 177 | | | | | | | 9.4 | % | | 9.1 | % | | | | |
| Climate Solutions Asia Pacific, Middle East & Africa | 3,500 | | | 3,581 | | | | | | | 466 | | | 361 | | | | | | | 13.3 | % | | 10.1 | % | | | | |
| Climate Solutions Transportation | 3,475 | | | 3,818 | | | | | | | 485 | | | 494 | | | | | | | 14.0 | % | | 12.9 | % | | | | |
| Total segment | $ | 22,486 | | | $ | 18,951 | | | | | | | $ | 3,743 | | | $ | 2,863 | | | | | | | 16.6 | % | | 15.1 | % | | | | |
A reconciliation of Segment operating profit to Adjusted operating profit is as follows:
| | | | | | | | | | | | | | |
| | For the Year Ended December 31, |
| (In millions) | | 2024 | | 2023 |
| Segment operating profit | | $ | 3,743 | | | $ | 2,863 | |
| Corporate and other | | (201) | | | (214) | |
| Adjusted operating profit | | $ | 3,542 | | | $ | 2,649 | |
Climate Solutions Americas
For the year ended December 31, 2024, Net sales were $10.5 billion, a 9% increase compared with the same period of 2023. The components of the year-over-year change were as follows:
| | | | | |
| Net sales |
| Organic / Operational | 8 | % |
| |
| Acquisitions and divestitures, net | 1 | % |
| |
| Total % change | 9 | % |
The organic increase in Net sales of 8% was driven by continued strong results in the segment. Growth in our residential business (up 10%) was primarily driven by strong end-market demand and pricing improvements compared to prior year. In addition, ongoing customer demand in our commercial business (up 11%) and pricing improvements in our light commercial business (up 3%) further benefited segment results.
For the year ended December 31, 2024, Segment operating profit was $2.3 billion, a 27% increase compared with the same period of 2023. The components of the year-over-year change were as follows:
| | | | | |
| Segment operating profit |
| Organic / Operational | 26 | % |
| Foreign currency translation | 1 | % |
| |
| |
| Total % change | 27 | % |
The operational profit increase of 26% was primarily attributable to ongoing customer demand in certain end-markets compared with the prior year. In addition, favorable productivity initiatives and pricing improvements further benefited segment results. These benefits were partially offset by increased research and development expenditures as well as lower earnings from equity method investments.
Climate Solutions Europe
For the year ended December 31, 2024, Net sales were $5.0 billion, a 157% increase compared with the same period of 2023. The components of the year-over-year change were as follows:
| | | | | |
| Net sales |
| Organic / Operational | — | % |
| Foreign currency translation | 1 | % |
| Acquisitions and divestitures, net | 156 | % |
| |
| Total % change | 157 | % |
Organic Net sales were flat as a result of mixed results across the segment compared with the prior year. Results in our commercial business (up 13%) benefited from ongoing end-market demand and pricing improvements. This growth was offset by results in our residential and light commercial business (down 16%) due to lower volumes across the region as economic conditions, inflationary cost pressures and regulatory uncertainty impacted end-market demand.
On January 2, 2024, we acquired the VCS Business, a leading manufacturer of high efficiency heating and renewable energy systems in Europe. The results of the VCS Business have been included in our Consolidated Financial Statements since the date of acquisition and primarily recorded in the Climate Solutions Europe segment. The transaction added 154% to Net sales for the year ended December 31, 2024, and is included in Acquisitions and divestitures, net.
For the year ended December 31, 2024, Segment operating profit was $469 million, a 165% increase compared with the same period of 2023. The components of the year-over-year change were as follows:
| | | | | |
| Segment operating profit |
| Organic / Operational | 2 | % |
| |
| Acquisitions and divestitures, net | 163 | % |
| |
| Total % change | 165 | % |
The segment operational profit increase of 2% was primarily attributable to favorable productivity initiatives and pricing improvements. In addition, results further benefited from increased demand in certain end-markets but were offset by reduced demand in other end-markets.
Results from the VCS Business acquisition added 157% to Segment operating profit for the year ended December 31, 2024, and is included in Acquisitions and divestitures, net.
Climate Solutions Asia Pacific, Middle East & Africa
For the year ended December 31, 2024, Net sales were $3.5 billion, a 2% decrease compared with the same period of 2023. The components of the year-over-year change were as follows:
| | | | | |
| Net sales |
| Organic / Operational | (3) | % |
| Foreign currency translation | (2) | % |
| Acquisitions and divestitures, net | 3 | % |
| |
| Total % change | (2) | % |
The organic decrease in Net sales of 3% was driven by volume reductions within certain end-markets compared with the prior year. Results in China decreased (down 10%) as both commercial and residential end-markets experienced economic challenges impacting demand. These results were partially offset by improved end-market demand in the remaining region.
For the year ended December 31, 2024, Segment operating profit was $466 million, a 29% increase compared with the same period of 2023. The components of the year-over-year change were as follows:
| | | | | |
| Segment operating profit |
| Organic / Operational | 22 | % |
| Foreign currency translation | (1) | % |
| Acquisitions and divestitures, net | 8 | % |
| |
| Total % change | 29 | % |
The segment operational profit increase of 22% was primarily attributable to favorable productivity initiatives and pricing improvements across the region. In addition, the segment benefited from higher earnings from equity method investments compared with the prior year. These benefits were partially offset by volume reductions in certain end-markets.
Climate Solutions Transportation
For the year ended December 31, 2024, Net sales were $3.5 billion, a 9% decrease compared with the same period of 2023. The components of the year-over-year change were as follows:
| | | | | |
| Net sales |
| Organic / Operational | (1) | % |
| |
| Acquisitions and divestitures, net | (8) | % |
| |
| Total % change | (9) | % |
The organic decrease in Net sales of 1% was primarily driven by volume reductions within certain end-markets compared with the prior year. Transport results decreased (down 8%) compared to the prior year primarily due to lower end-market demand in North America. The reduction was partially offset by higher volumes in Asia and Europe. Results in the Container business (up 24%) was primarily driven by strong end-market demand and improved pricing.
On October 1, 2024, we divested CCR, a global supplier of turnkey solutions for commercial refrigeration systems and services. The results of CCR are excluded from our Consolidated Financial Statements subsequent to the divestiture date. The transaction reduced Net Sales by 8% for the year ended December 31, 2024, and is included in Acquisitions and divestitures, net.
For the year ended December 31, 2024, Segment operating profit was $485 million, a 2% decrease compared with the same period of 2023. The components of the year-over-year change were as follows:
| | | | | |
| Segment operating profit |
| Organic / Operational | 3 | % |
| Foreign currency translation | (1) | % |
| Acquisitions and divestitures, net | (4) | % |
| |
| Total % change | (2) | % |
The segment increase in operational profit of 3% was primarily driven by favorable productivity initiatives and price improvements compared with the prior year. In addition, volume growth in certain end-markets further benefited the segment. These amounts were partially offset by volume reductions in certain other end-markets. Amounts reported in Other represent $10 million of divestiture-related costs associated with the sale of CCR. In addition, the prior year includes a $24 million gain on the sale of a business within the Transport business.
Year Ended December 31, 2023 Compared with Year Ended December 31, 2022
Summary performance for each of our segments is as follows:
| | | | | | | | | | | | | | | | | | | | | | | | | | | | | | | | | | | | | | | | | | | | | | | |
| | | Net sales | | | | Segment operating profit | | | | Segment operating profit margin |
| (In millions) | | | 2023 | | 2022 | | | | | | 2023 | | 2022 | | | | | | 2023 | | 2022 | | |
| Climate Solutions Americas | | | $ | 9,615 | | | $ | 9,153 | | | | | | | $ | 1,831 | | | $ | 1,557 | | | | | | | 19.0 | % | | 17.0 | % | | |
| Climate Solutions Europe | | | 1,937 | | | 1,631 | | | | | | | 177 | | | 96 | | | | | | | 9.1 | % | | 5.9 | % | | |
| Climate Solutions Asia Pacific, Middle East & Africa | | | 3,581 | | | 2,621 | | | | | | | 361 | | | 297 | | | | | | | 10.1 | % | | 11.3 | % | | |
| Climate Solutions Transportation | | | 3,818 | | | 3,883 | | | | | | | 494 | | | 523 | | | | | | | 12.9 | % | | 13.5 | % | | |
| Total segment | | | $ | 18,951 | | | $ | 17,288 | | | | | | | $ | 2,863 | | | $ | 2,473 | | | | | | | 15.1 | % | | 14.3 | % | | |
A reconciliation of Segment operating profit to Adjusted operating profit is as follows:
| | | | | | | | | | | | | | |
| | For the Year Ended December 31, |
| (In millions) | | 2023 | | 2022 |
| Segment operating profit | | $ | 2,863 | | | $ | 2,473 | |
| Corporate and other | | (214) | | | (126) | |
| Adjusted operating profit | | $ | 2,649 | | | $ | 2,347 | |
Climate Solutions Americas
For the year ended December 31, 2023, Net sales were $9.6 billion, a 5% increase compared with the same period of 2022. The components of the year-over-year change were as follows:
| | | | | |
| Net sales |
| Organic / Operational | 5 | % |
| Foreign currency translation | — | % |
| |
| |
| Total % change | 5 | % |
The organic increase in Net sales of 5% was driven by continued strong results in the segment. Growth in our commercial business (up 17%) was primarily driven by strong end-market demand and pricing improvements compared to the prior year. In addition, ongoing customer demand in our light commercial business (up 34%) further benefited segment results. These amounts were partially offset by reduced end-market demand in our residential business (down 7%).
For the year ended December 31, 2023, Segment operating profit was $1,831 million, an 18% increase compared with the same period of 2022. The components of the year-over-year change were as follows:
| | | | | |
| Segment operating profit |
| Organic / Operational | 18 | % |
| Foreign currency translation | — | % |
| |
| |
| Total % change | 18 | % |
The segment operational profit increase of 18% was primarily attributable to ongoing customer demand in certain end-markets compared with the prior year. In addition, favorable productivity initiatives and higher earnings from equity method investments further benefited segment results. These benefits more than offset volume reductions in certain end-markets and higher selling, general and administrative expenses.
Climate Solutions Europe
For the year ended December 31, 2023, Net sales were $1.9 billion, a 19% increase compared with the same period of 2022. The components of the year-over-year change were as follows:
| | | | | |
| Net sales |
| Organic / Operational | 1 | % |
| Foreign currency translation | 2 | % |
| Acquisitions and divestitures, net | 16 | % |
| |
| Total % change | 19 | % |
The organic increase in Net sales of 1% was driven by increased demand in certain end-markets and pricing improvements compared with the prior year. Results in our commercial business increased (up 14%) due to strong end-market demand and pricing improvements. Growth was partially offset by results in our residential and light commercial business (down 17%) due to lower volumes across the region as economic conditions, inflationary cost pressures and regulatory uncertainty impacted end-market demand.
On August 1, 2022, we acquired a majority ownership interest in TCC, a VRF and light commercial HVAC joint venture between Carrier and Toshiba Corporation. The results of TCC have been included in our Consolidated Financial Statements since the date of acquisition of which a portion is recorded in the Climate Solutions Europe segment. The transaction added 16% to Net sales for the year ended December 31, 2023, and is included in Acquisitions and divestitures, net.
For the year ended December 31, 2023, Segment operating profit was $177 million, an 85% increase compared with the same period of 2022. The components of the year-over-year change were as follows:
| | | | | |
| Segment operating profit |
| Organic / Operational | 15 | % |
| Foreign currency translation | 1 | % |
| Acquisitions and divestitures, net | 69 | % |
| |
| Total % change | 85 | % |
The segment operational profit increase of 15% was primarily attributable to pricing improvements and ongoing customer demand in certain end-markets compared with the prior year. The segment further benefited from favorable productivity initiatives and lower material costs. These benefits were partially offset by volume reductions in certain end-markets.
Acquisitions and divestitures, net primarily related to the results of operations associated with the acquisition of TCC. The transaction added 69% to Segment operating profit during the year ended December 31, 2023.
Climate Solutions Asia Pacific, Middle East & Africa
For the year ended December 31, 2023, Net sales were $3.6 billion, a 37% increase compared with the same period of 2022. The components of the year-over-year change were as follows:
| | | | | |
| Net sales |
| Organic / Operational | 6 | % |
| Foreign currency translation | (3) | % |
| Acquisitions and divestitures, net | 34 | % |
| |
| Total % change | 37 | % |
The organic increase in Net sales of 6% was driven by end-market demand within certain regions compared with the prior year. Results in China increased (up 6%) as a result of ongoing residential end-market demand and pricing improvements. These results were partially offset by economic challenges impacting commercial end-markets. Results across remaining geographies were flat.
On August 1, 2022, we acquired a majority ownership interest in TCC, a VRF and light commercial HVAC joint venture between Carrier and Toshiba Corporation. The results of TCC have been included in our Consolidated Financial Statements since the date of acquisition and primarily recorded in the Climate Solutions Asia Pacific, Middle East & Africa segment. The transaction added 36% to Net sales for the year ended December 31, 2023, and is included in Acquisitions and divestitures, net.
For the year ended December 31, 2023, Segment operating profit was $361 million, a 22% increase compared with the same period of 2022. The components of the year-over-year change were as follows:
| | | | | |
| Segment operating profit |
| Organic / Operational | (3) | % |
| |
| Acquisitions and divestitures, net | 25 | % |
| |
| Total % change | 22 | % |
The segment operational profit decrease of 3% was primarily driven by volume reductions within certain end-markets and lower earnings from equity method investments compared with the prior year. These results were partially offset by favorable productivity initiatives.
Acquisitions and divestitures, net primarily related to the results of operations associated with the acquisition of TCC. The transaction added 28% to Segment operating profit during the year ended December 31, 2023.
Climate Solutions Transportation
For the year ended December 31, 2023, Net sales were $3.8 billion, a 2% decrease compared with the same period of 2022. The components of the year-over-year change were as follows:
| | | | | |
| Net sales |
| Organic / Operational | (2) | % |
| Foreign currency translation | 1 | % |
| Acquisitions and divestitures, net | (1) | % |
| |
| Total % change | (2) | % |
The organic decrease in Net sales of 2% was primarily driven by volume reductions within certain end-markets compared with the prior year. Our commercial refrigeration business decreased (down 14%) compared to the prior year primarily due to lower end-market demand in Europe as economic conditions and inflationary cost pressures impacted end-market demand. In addition, Asia results were impacted by reduced end-market demand in China. Results in our container business (down 23%) were impacted by volume reductions in certain end-markets. These reductions were partially offset by results in our transport business (up 14%) primarily driven by pricing improvements and strong end-market demand across all regions.
For the year ended December 31, 2023, Segment operating profit was $494 million, a 6% decrease compared with the same period of 2022. The components of the year-over-year change were as follows:
| | | | | |
| Segment operating profit |
| Organic / Operational | (12) | % |
| Foreign currency translation | 1 | % |
| |
| Other | 5 | % |
| Total % change | (6) | % |
The decrease in segment operational profit of 12% primarily driven by lower volume in certain end-markets compared with the prior year. In addition, the higher costs of commodities and components used in our products further impacted segment results. These amounts were partially offset by pricing improvements and favorable productivity initiatives. Inflationary cost pressures have begun to moderate but continue to impact our results. Amounts reported in Other represent a $24 million gain on the sale of a business within Transport refrigeration.
LIQUIDITY AND FINANCIAL CONDITION
We assess liquidity in terms of our ability to generate adequate amounts of cash necessary to fund our current and future cash requirements to support our business and strategic initiatives. In doing so, we review and analyze our cash on hand, working capital, debt service requirements and capital expenditures. We rely on operating cash flows as our primary source of liquidity. In addition, we have access to other sources of capital to finance our strategic initiatives and fund growth.
As of December 31, 2024, we had Cash and cash equivalents of $4.0 billion, of which approximately 44% was held by our foreign subsidiaries. We manage our worldwide cash requirements by reviewing available funds and the cost effectiveness with which we can access funds held by foreign subsidiaries. On occasion, we are required to maintain cash deposits in connection with contractual obligations related to acquisitions or divestitures or other legal obligations. As of December 31, 2024 and 2023, the amount of such restricted cash was $3 million and $1 million, respectively.
We continue to actively manage and strengthen our business portfolio to meet the current and future needs of our customers. This is accomplished through research and development activities with a focus on new product development and new technology innovation as well as sustaining activities with a focus on improving existing products and reducing production costs. We also pursue potential acquisitions to complement existing products and services to enhance our product portfolio. In addition, we routinely conduct discussions, evaluate targets and enter into agreements regarding possible acquisitions, divestitures, joint ventures and equity investments to manage our business portfolio.
We believe that our available cash and operating cash flows will be sufficient to meet our future operating cash needs. Our committed credit facilities and access to the debt and equity markets provide additional sources of short-term and long-term capital to fund current operations, debt maturities and future investment opportunities. Although we believe that the arrangements currently in place permit us to finance our operations on acceptable terms and conditions, our access to and the availability of financing on acceptable terms and conditions in the future will be impacted by many factors, including: (1) our credit ratings or absence of credit ratings; (2) the level of our existing indebtedness; (3) the restrictions under our debt agreements; (4) the liquidity of the overall capital markets and (5) the state of the economy. There can be no assurance that we will be able to obtain additional financing on terms favorable to us, if at all.
The following table contains several key measures of our financial condition and liquidity:
| | | | | | | | | | | | | | | | |
| | As of December 31, |
| (In millions) | | 2024 | | 2023 | | |
| Cash and cash equivalents | | $ | 3,969 | | | $ | 9,852 | | | |
| Total debt | | $ | 12,278 | | | $ | 14,293 | | | |
| Total equity | | $ | 14,395 | | | $ | 9,005 | | | |
| | | | | | |
| Net debt (total debt less cash and cash equivalents) | | $ | 8,309 | | | $ | 4,441 | | | |
| Total capitalization (total debt plus total equity) | | $ | 26,673 | | | $ | 23,298 | | | |
| Net capitalization (total debt plus total equity less cash and cash equivalents) | | $ | 22,704 | | | $ | 13,446 | | | |
| Total debt to total capitalization | | 46 | % | | 61 | % | | |
| Net debt to net capitalization | | 37 | % | | 33 | % | | |
Acquisition of VCS Business
On April 25, 2023, we announced that we entered into an Agreement to acquire the VCS Business. Under the terms of the Agreement, 20% of the purchase price was to be paid in Carrier common stock, issued directly to Viessmann and subject to certain lock-up provisions and 80% was to be paid in cash. Simultaneously, we entered into commitment letters with JPMorgan Chase Bank, N.A., BofA Securities, Inc. and Bank of America, N.A. to provide a €8.2 billion senior unsecured bridge term loan facility (the "Bridge Loan") to fund a portion of the Euro-denominated purchase price.
On May 19, 2023, we entered into a 364-day, $500 million, senior unsecured revolving credit agreement with JPMorgan Chase Bank, N.A., as administrative agent and certain other lenders (the "Revolver"). In addition, we entered into a senior unsecured delayed draw term loan credit agreement with JPMorgan Chase Bank, N.A., as administrative agent and certain other lenders that permits aggregate borrowings of up to €2.3 billion (the "Delayed Draw Facility"). Upon entering into the Delayed Draw Facility, the aggregate principal amount of the Bridge Loan was reduced by €2.3 billion. In November 2023, we issued $3.0 billion principal amount of USD-denominated notes ("USD Notes") and €2.35 billion principal amount of Euro-denominated notes ("Euro Notes"). Upon issuance, the aggregate principal amount of the Bridge Loan was reduced by €5.4 billion. On January 2, 2024, we entered into a 60-day senior unsecured term loan agreement consisting of a Euro-denominated tranche in an aggregate amount of €113 million and a USD-denominated tranche in an aggregate amount of $349 million (the “60-day Loan”). Upon entering into the 60-day Loan, we reduced the final portion of the Bridge Loan by €500 million and subsequently terminated the agreement.
On January 2, 2024, we completed the acquisition of the VCS Business for $14.2 billion. The cash portion of the purchase price was funded through cash on hand, proceeds from the USD Notes and the Euro Notes and borrowings under the Delayed Draw Facility and the 60-day Loan. Proceeds from the Revolver became available upon closing.
In March 2024, borrowings under the 60-day loan were repaid. In May 2024, the Revolver was terminated and refinanced in order to extend its maturity to May 2025 (the "364-day Revolver"). In June 2024, we redeemed our $1.0 billion aggregate principal amount of 5.80% notes due in 2025 and repaid borrowings under the Delayed Draw Facility, which was subsequently terminated. In addition, we completed tender offers on certain tranches of our notes in August 2024 which included $125 million of notes due 2034, $350 million of notes due 2054 and approximately $600 million of notes due 2050. In November 2024, we issued €750 million aggregate principal amount of 3.625% notes due 2037 and used the proceeds to redeem €750 million aggregate principal amount of 4.375% notes due in 2025. In December 2024, we terminated the 364-day Revolver as part of a transaction to refinance and replace prior credit agreements.
Borrowings and Lines of Credit
We maintain a $2.0 billion unsecured, unsubordinated commercial paper program which we can use for general corporate purposes, including the funding of working capital and potential acquisitions. In addition, we maintain a $2.5 billion revolving credit agreement with various banks (the "Revolving Credit Facility") that matures in December 2029 which supports our commercial paper borrowing program and can be used for general corporate purposes. A ratings-based commitment fee is charged on unused commitments. As of December 31, 2024, we had no borrowings outstanding under our commercial paper program or our Revolving Credit Facility.
Our short-term obligations primarily consist of current maturities of long-term debt. Our long-term obligations primarily consist of long-term notes with maturity dates ranging between 2025 and 2054. Interest payments related to long-term notes are expected to approximate $420 million per year, reflecting an approximate weighted-average interest rate of 3.5%. Any borrowings from the Revolving Credit Facility are subject to variable interest rates. See Note 7 - Borrowings and Lines of Credit in the accompanying Notes to the Consolidated Financial Statements for additional information regarding the terms of our long-term debt obligations.
Scheduled maturities of long-term debt, excluding amortization of discount, are as follows:
| | | | | | | | | |
| (In millions) | | | |
| 2025 | | $ | 1,252 | | |
| 2026 | | $ | 70 | | |
| 2027 | | $ | 1,284 | | |
| 2028 | | $ | 803 | | |
| 2029 | | $ | 19 | | |
| Thereafter | | $ | 8,938 | | |
The following table presents our credit ratings and outlook as of December 31, 2024:
| | | | | | | | | | | | | | |
| Rating Agency | Long-term Rating (1) | Short-term Rating (2) | | Outlook (2) (3) |
S&P | BBB | A2 | | Positive |
Moody's | Baa2 | P2 | | Positive |
| Fitch Ratings | BBB+ | F1 | | Stable |
| | | | |
(1) The long-term rating was upgraded by Moody's to Baa2 on May 13, 2024. Fitch's was updated to BBB+ on October 18, 2024.
(2) Fitch upgraded its short-term rating to F1 from F2 and revised its outlook to stable from positive on October 18, 2024.
(3) S&P revised its outlook to positive from stable in December 2023.
Portfolio Transformation
On June 2, 2024, we completed the divestiture of Access Solutions for cash proceeds of $5.0 billion. On July 1, 2024, we completed the divestiture of Industrial Fire for cash proceeds of $1.4 billion. On October 1, 2024, we completed the divestiture of CCR for cash proceeds of $679 million, subject to customary working capital and other adjustments. On December 2, 2024, we completed the divestiture of the CRF Business for cash proceeds of $2.9 billion, subject to customary working capital and other adjustments. Consistent with our capital allocation strategy, the net proceeds will be used to fund repayment of debt, investments in organic and inorganic growth initiatives and capital returns to shareowners as well as for general corporate purposes.
Share Repurchase Program
We may purchase our outstanding common stock from time to time subject to market conditions and at our discretion. Repurchases occur in the open market or through one or more other public or private transactions pursuant to plans complying with Rules 10b5-1 and 10b-18 under the Exchange Act. Since the initial authorization in February 2021, the Company's Board of Directors authorized the repurchase of up to $7.1 billion of our outstanding common stock which includes a $3 billion increase approved in October 2024. As of December 31, 2024, the Company repurchased 70.1 million shares of common stock for an aggregate purchase price of $3.9 billion. As a result, the Company has approximately $3.2 billion remaining under the current authorization at December 31, 2024.
Dividends
We paid dividends on our common stock of $0.76 per share during the year ended December 31, 2024, totaling $670 million. On December 6, 2024, the Board of Directors declared a dividend of $0.225 per share payable on February 7, 2025, to shareowners of record at the close of business on December 20, 2024.
Discussion of Cash Flows
The following table reflects the major categories of cash flows for the following periods:
| | | | | | | | | | | | | | | | | | | | |
| | For the Years Ended December 31, |
| (In millions) | | 2024 | | 2023 | | 2022 |
| Net cash provided by (used in): | | | | | | |
| Continuing operating activities | | $ | 1,571 | | | $ | 2,252 | | | $ | 1,505 | |
| Continuing investing activities | | (11,025) | | | (504) | | | 1,801 | |
| Continuing financing activities | | (4,611) | | | 4,632 | | | (2,928) | |
| | | | | | |
| | | | | | |
Cash flows from continuing operating activities primarily represent inflows and outflows associated with our continuing operations. Primary activities include net earnings from continuing operations adjusted for non-cash transactions, working capital changes and changes in other assets and liabilities. The 2024 year-over-year decrease in net cash provided by continuing operating activities was primarily driven by an increase in working capital balances compared with the prior period. Improved inventory levels and lower customer receivable balances were more than offset by lower accounts payable balances. The 2023 year-over-year increase in net cash provided by operating activities was primarily driven by a reduction in working capital balances. Improved inventory management and higher accounts payable balances more than offset an increase in our accounts receivable balances. In addition, Accounts payable and accrued liabilities included a $96 million mark-to-market valuation adjustment on our window forward contracts associated with the Euro-denominated purchase price of the VCS.
Cash flows from continuing investing activities primarily represent inflows and outflows associated with long-term assets. Primary activities include capital expenditures, acquisitions, divestitures and proceeds from the sale of fixed assets. During the year ended December 31, 2024, net cash used in continuing investing activities was $11.0 billion. The primary driver of the outflow related to the acquisition of the VCS Business, which totaled $10.8 billion, net of cash acquired. Additional investing outflows include $264 million related to settlement of derivatives and $519 million of capital expenditures. These outflows were partially offset by net proceeds of $634 million related to divestitures. During the year ended December 31, 2023, net cash used in continuing investing activities was $504 million. The primary driver of the outflow related to $439 million of capital expenditures. In addition, we settled working capital and other transaction-related items associated with the acquisition of TCC and invested in several businesses. These amounts totaled $84 million, net of cash acquired and were partially offset by the proceeds from the sale of a business during the period. During the year ended December 31, 2022, net cash provided by continuing investing activities was $1.8 billion. The primary driver of the inflow related to the net proceeds from the Chubb Sale. This amount was partially offset by the acquisition of TCC and several other businesses and minority-owned businesses, which totaled $506 million, net of cash acquired and $317 million of capital expenditures.
Cash flows from continuing financing activities primarily represent inflows and outflows associated with equity or borrowings. Primary activities include debt transactions, paying dividends to shareowners and the repurchase of our common stock. During the year ended December 31, 2024, net cash used in continuing financing activities was $4.6 billion. The primary driver of the outflow is due to repayments of long-term debt of $5.3 billion which includes prepayments of the Delayed Draw Facility, redemption of our 5.80% notes due in 2025 and 4.375% notes due in 2025 and tender offers of approximately $1.1 billion. In addition, we made payments totaling $1.9 billion to repurchase shares of our common stock and dividend payments of $670 million to our common shareowners. These outflows were partially offset by the proceeds of borrowings used to fund the cash portion of the acquisition of the VCS Business and the November 2024 issuance of our 3.625% notes due 2037. During the year ended December 31, 2023, net cash provided by continuing financing activities was $4.6 billion. The primary driver of the inflow related to the issuance of the USD Notes and the Euro Notes related to the acquisition of the VCS Business. The inflow was partially offset by the payment of $620 million in dividends to our common shareowners. In addition, we paid $62 million to repurchase shares of our common stock. During the year ended December 31, 2022, net cash used in continuing financing activities was $2.9 billion. The primary driver of the outflow related to the payment of $1.4 billion to repurchase shares of our common stock. In addition, we settled our tender offers for $1.15 billion and paid $509 million in dividends to our common shareowners.
Summary of Other Sources and Uses of Cash
Rapid changes in legislation, regulations and government policies, including with respect to regulations intended to combat climate events, affect our operations and business in the countries, regions and localities in which we operate and sell our products. We are committed to comply with these regulations and to environmental stewardship. As a result, we have set goals to invest over $4 billion by 2030 to develop intelligent climate and energy solutions that reduce environmental impacts. In addition, to reach our goal to achieve carbon neutrality in our operations by 2030, we expect to incur capital expenditures for climate-related projects including upgrading our facilities, equipment and controls to optimize energy efficiency, transition our energy consumption from a dependency on fossil fuels to renewable energy and expanding the electrification of our fleet vehicles. See section entitled Environmental Goals under the headings "Other Matters Relating to Our Business as a Whole" for additional information.
We also have obligations related to environmental and asbestos matters, pension and post-retirement benefits and taxes. See Note 10 - Employee Benefit Plans, Note 17 - Income Taxes, and Note 23 - Commitments and Contingent Liabilities in the accompanying Notes to the Consolidated Financial Statements in this Annual Report for additional information.
CRITICAL ACCOUNTING ESTIMATES
Our financial statements are prepared in accordance with accounting principles generally accepted in the United States. The preparation of financial statements in conformity with those accounting principles requires management to use judgement in making estimates and assumptions based on the relevant information available at the end of each period. These estimates and assumptions have a significant effect on reported amounts of assets, liabilities, sales and expenses as well as the disclosure of contingent assets and liabilities because they result primarily from the need to make estimates and assumptions on matters that are inherently uncertain. Actual results could differ from management's estimates.
Business Combinations
In accordance with ASC 805, Business Combinations ("ASC 805"), acquisitions that meet the definition of a business are recorded using the acquisition method of accounting. We recognize and measure the identifiable assets acquired, liabilities assumed and any non-controlling interest as of the acquisition date at fair value. The valuation of intangible assets is determined by an income approach methodology, using assumptions such as projected future revenues, customer attrition rates, royalty rates, tax rates and discount rates. The excess, if any, of total consideration transferred in a business combination over the fair value of identifiable assets acquired, liabilities assumed and any non-controlling interest is recognized as goodwill. Costs incurred as a result of a business combination other than costs related to the issuance of debt or equity securities are recorded in the period the costs are incurred.
Goodwill and Indefinite-Lived Intangible Assets
In accordance with the Financial Accounting Standards Board ("FASB") Accounting Standards Codification ("ASC") 350, Intangibles - Goodwill and Other ("ASC 350"), goodwill and other indefinite-lived intangible assets are tested and reviewed annually for impairment or whenever there is a material change in events or circumstances that indicate that the fair value of the asset is more likely than not less than the carrying amount of the asset. We test our reporting units and indefinite-lived intangible assets for impairment annually as of the first day of our third quarter, or more frequently if events or circumstances occur.
ASC 350 provides entities with an option to perform a qualitative assessment (commonly referred to as “step zero”) to determine whether a quantitative analysis for impairment is necessary. In performing step zero for our impairment test, we are required to make assumptions and judgments, including but not limited to the following: the evaluation of macroeconomic conditions as related to our business, industry and market trends, and the overall future financial performance of our reporting units and future opportunities in the markets in which they operate. If impairment indicators are present after performing step zero, we would perform a quantitative impairment analysis to estimate fair value.
For our 2024 goodwill and indefinite-lived intangible assets impairment tests, we elected to perform qualitative step zero assessments for all tests (except one) to determine if it was more likely than not that the fair values of our reporting units and indefinite-lived intangible assets were below carrying value. We considered macroeconomic factors including global economic growth, general macroeconomic trends for the markets in which our reporting units operate and where the intangible assets are utilized and the forecasted growth of the global industrial products industry. In addition to these macroeconomic factors, among other things, we considered the reporting units’ current results and forecasts, changes in the nature of each business, any significant legal, regulatory, contractual, political or other business climate factors, changes in the industry and competitive environment, changes in the composition or carrying amount of net assets and any intention to sell or dispose of a reporting unit or cease the use of any indefinite-lived intangible assets. Based upon our qualitative analysis, we determined that our goodwill and indefinite-lived intangible assets were not impaired.
For the remaining goodwill test, we elected to perform a quantitative test to determine if it was more likely than not that the fair value of our Climate Solutions Transportation reporting unit was below carrying value. We utilized a discounted cash flow method under the income approach to estimate the fair value of the reporting unit. The approach relies on our estimates of future cash flows, long-term growth rates, discount rates and income tax rates and explicitly addressed factors such as timing, growth and margins with due consideration given to forecasting, market and geographic risk. The results did not indicate any goodwill impairment. A significant increase in the discount rate, decrease in the long-term growth rate or substantial reductions in our end markets and volume assumptions could have a negative impact on the estimated fair value of this reporting unit.
Revenue Recognition from Contracts with Customers
Revenue is recognized when control of a good or service promised in a contract (i.e., performance obligation) is transferred to a customer. Control is obtained when a customer has the ability to direct the use of and obtain substantially all of the remaining benefits from that good or service. A significant portion of our performance obligations are recognized at a point-in-time when control of the product transfers to the customer, which is generally the time of shipment. The remaining portion of our performance obligations are recognized over time as the customer simultaneously obtains control as we perform work under a contract, or if the product being produced for the customer has no alternative use and we have a contractual right to payment.
A performance obligation is a distinct good, service or a bundle of goods and services promised in a contract. Some of our contracts with customers contain a single performance obligation, while others contain multiple performance obligations most commonly when a contract spans multiple phases of a product life-cycle such as production, installation, maintenance and support. We identify performance obligations at the inception of a contract and allocate the transaction price to each distinct performance obligation. Revenue is recognized when or as the performance obligation is satisfied. When there are multiple performance obligations within a contract, we allocate the transaction price to each performance obligation based on its relative stand-alone selling price.
We primarily generate revenue from the sale of products to customers and recognize revenue at a point in time when control transfers to the customer. Transfer of control is generally based on the shipping terms of the contract. In addition, we recognize revenue on an over-time basis on installation and service contracts. For over-time performance obligations requiring the installation of equipment, revenue is recognized using costs incurred to date relative to total estimated costs at completion to measure progress. Incurred costs represent work performed, which correspond with and best depict transfer of control to the customer. Contract costs include direct costs such as labor, materials and subcontractors’ costs and, where applicable, indirect costs.
The transaction price allocated to performance obligations reflects our expectations about the consideration we will be entitled to receive from a customer. We include variable consideration in the estimated transaction price when there is a basis to reasonably estimate the amount and when it is probable that a significant reversal of revenue recognized would not occur when the uncertainty associated with variable consideration is subsequently resolved. In addition, we customarily offer our customers incentives to purchase products to ensure an adequate supply of our products in distribution channels. The principal incentive programs provide reimbursements to distributors for offering promotional pricing for products. We account for estimated incentive payments as a reduction in sales at the time a sale is recognized.
Income Taxes
We account for income taxes in accordance with ASC 740, Income Taxes ("ASC 740"). Deferred tax assets and liabilities are determined based on temporary differences between financial reporting and tax bases of assets and liabilities, applying enacted tax rates expected to be in effect for the year in which the differences are expected to reverse. We recognize future tax benefits to the extent that realizing these benefits is considered in our judgment to be more likely than not. For those jurisdictions where the expiration date of tax carryforwards or the projected operating results indicate that realization is not likely, a valuation allowance is provided. We review the realizability of our deferred tax asset valuation allowances on a quarterly basis, or whenever events or changes in circumstances indicate that a review is required and will adjust our estimate if significant events so dictate. To the extent that the ultimate results differ from our original or adjusted estimates, the effect will be recorded in the provision for income taxes in the period that the matter is finally resolved.
In the ordinary course of business, there is inherent uncertainty in quantifying our income tax positions. We assess our income tax positions and record tax benefits for all years subject to examination based upon management’s evaluation of the facts, circumstances and information available at the reporting date. For those tax positions where it is more likely than not that a tax benefit will be sustained, we have recorded the largest amount of tax benefit with a greater than 50% likelihood of being realized upon ultimate settlement with a taxing authority that has full knowledge of all relevant information. For those income tax positions where it is not more likely than not that a tax benefit will be sustained, no tax benefit has been recognized in the Consolidated Financial Statements.
Contingent Liabilities
We are involved in various litigation, claims and administrative proceedings, including those related to environmental (including asbestos) and legal matters. In accordance with ASC 450, Contingencies ("ASC 450"), we record accruals for loss contingencies when it is probable that a liability will be incurred and the amount of the loss can be reasonably estimated. These accruals are generally based upon a range of possible outcomes. If no amount within the range is a better estimate than any other, we accrue the minimum amount. In addition, these estimates are reviewed periodically and adjusted to reflect additional information when it becomes available. We are unable to predict the final outcome of these matters based on the information currently available. However, we do not believe that the resolution of any of these matters will have a material adverse effect upon our competitive position, results of operations, cash flows or financial condition.
As described in Note 23 – Commitments and Contingent Liabilities in the accompanying Notes to the Consolidated Financial Statements in this Annual Report, contractual, regulatory and other matters, including asbestos claims, may arise in the ordinary course of business that subject us to claims or litigation. We have recorded reserves in the consolidated financial statements related to these matters, which are developed using input derived from actuarial estimates and historical and anticipated experience depending on the nature of the reserve, and in certain instances in consultation with legal counsel, internal and external consultants and engineers. Subject to the uncertainties inherent in estimating future costs for these types of liabilities, we believe our estimated reserves are reasonable and do not believe the final determination of the liabilities with respect to these matters would have a material adverse effect upon our competitive position, results of operations, cash flows or financial condition. See the "Risk Factors" section in this Annual Report for additional information.
Recent Accounting Pronouncements
See Note 3 – Summary of Significant Accounting Policies in the accompanying Notes to the Consolidated Financial Statements in this Annual Report for a discussion of recent accounting pronouncements and their effect on our financial statements.
ITEM 8. FINANCIAL STATEMENTS AND SUPPLEMENTARY DATA
Report of Independent Registered Public Accounting Firm
To the Board of Directors and Shareowners of Carrier Global Corporation
Opinions on the Financial Statements and Internal Control over Financial Reporting
We have audited the accompanying consolidated balance sheets of Carrier Global Corporation and its subsidiaries (the “Company”) as of December 31, 2024 and 2023, and the related consolidated statements of operations, of comprehensive income (loss), of changes in equity and of cash flows for each of the three years in the period ended December 31, 2024, including the related notes (collectively referred to as the “consolidated financial statements”). We also have audited the Company's internal control over financial reporting as of December 31, 2024, based on criteria established in Internal Control - Integrated Framework (2013) issued by the Committee of Sponsoring Organizations of the Treadway Commission (COSO).
In our opinion, the consolidated financial statements referred to above present fairly, in all material respects, the financial position of the Company as of December 31, 2024 and 2023, and the results of its operations and its cash flows for each of the three years in the period ended December 31, 2024 in conformity with accounting principles generally accepted in the United States of America. Also in our opinion, the Company maintained, in all material respects, effective internal control over financial reporting as of December 31, 2024, based on criteria established in Internal Control - Integrated Framework (2013) issued by the COSO.
Basis for Opinions
The Company's management is responsible for these consolidated financial statements, for maintaining effective internal control over financial reporting, and for its assessment of the effectiveness of internal control over financial reporting, included in Management’s Report on Internal Control Over Financial Reporting (not presented herein) appearing under Item 9A of the Company's 2024 Annual Report on Form 10-K. Our responsibility is to express opinions on the Company’s consolidated financial statements and on the Company's internal control over financial reporting based on our audits. We are a public accounting firm registered with the Public Company Accounting Oversight Board (United States) (PCAOB) and are required to be independent with respect to the Company in accordance with the U.S. federal securities laws and the applicable rules and regulations of the Securities and Exchange Commission and the PCAOB.
We conducted our audits in accordance with the standards of the PCAOB. Those standards require that we plan and perform the audits to obtain reasonable assurance about whether the consolidated financial statements are free of material misstatement, whether due to error or fraud, and whether effective internal control over financial reporting was maintained in all material respects.
Our audits of the consolidated financial statements included performing procedures to assess the risks of material misstatement of the consolidated financial statements, whether due to error or fraud, and performing procedures that respond to those risks. Such procedures included examining, on a test basis, evidence regarding the amounts and disclosures in the consolidated financial statements. Our audits also included evaluating the accounting principles used and significant estimates made by management, as well as evaluating the overall presentation of the consolidated financial statements. Our audit of internal control over financial reporting included obtaining an understanding of internal control over financial reporting, assessing the risk that a material weakness exists, and testing and evaluating the design and operating effectiveness of internal control based on the assessed risk. Our audits also included performing such other procedures as we considered necessary in the circumstances. We believe that our audits provide a reasonable basis for our opinions.
As described in Management’s Report on Internal Control Over Financial Reporting, management has excluded the climate solutions business (the "VCS Business") of Viessmann Group GmbH & Co. KG from its assessment of internal control over financial reporting as of December 31, 2024 because it was acquired by the Company in a purchase business combination during 2024. We have also excluded the VCS Business from our audit of internal control over financial reporting. The VCS Business is a wholly-owned subsidiary whose total assets excluding intangible assets and goodwill arising from the acquisition and total net sales excluded from management’s assessment and our audit of internal control over financial reporting represent approximately 14% and 15%, respectively, of the related consolidated financial statement amounts as of and for the year ended December 31, 2024.
Definition and Limitations of Internal Control over Financial Reporting
A company’s internal control over financial reporting is a process designed to provide reasonable assurance regarding the reliability of financial reporting and the preparation of financial statements for external purposes in accordance with generally accepted accounting principles. A company’s internal control over financial reporting includes those policies and procedures that (i) pertain to the maintenance of records that, in reasonable detail, accurately and fairly reflect the transactions and dispositions of the assets of the company; (ii) provide reasonable assurance that transactions are recorded as necessary to permit preparation of financial statements in accordance with generally accepted accounting principles, and that receipts and expenditures of the company are being made only in accordance with authorizations of management and directors of the company; and (iii) provide reasonable assurance regarding prevention or timely detection of unauthorized acquisition, use, or disposition of the company’s assets that could have a material effect on the financial statements.
Because of its inherent limitations, internal control over financial reporting may not prevent or detect misstatements. Also, projections of any evaluation of effectiveness to future periods are subject to the risk that controls may become inadequate because of changes in conditions, or that the degree of compliance with the policies or procedures may deteriorate.
Critical Audit Matters
The critical audit matter communicated below is a matter arising from the current period audit of the consolidated financial statements that was communicated or required to be communicated to the audit committee and that (i) relates to accounts or disclosures that are material to the consolidated financial statements and (ii) involved our especially challenging, subjective, or complex judgments. The communication of critical audit matters does not alter in any way our opinion on the consolidated financial statements, taken as a whole, and we are not, by communicating the critical audit matter below, providing a separate opinion on the critical audit matter or on the accounts or disclosures to which it relates.
Acquisition of the VCS Business - Valuation of Intangible Assets Acquired
As described in Note 19 to the consolidated financial statements, on January 2, 2024, the Company completed the acquisition of the VCS Business for total consideration of $14.2 billion. Of the acquired intangible assets, $4,787 million of customer relationships, $679 million of a trademark, and $1,051 million of technology intangible assets (collectively, the “intangible assets acquired”) were recorded. The valuation of the intangible assets acquired was determined using an income approach methodology including the multi-period excess earnings method and the relief from royalty method. Key assumptions used in estimating future cash flows included short-term revenue growth rates, research and development expenses, earnings before interest, taxes, depreciation and amortization (EBITDA) margins, income tax rates, discount rates, customer attrition rate, royalty rates, contributory asset charge, and obsolescence rates, among others.
The principal considerations for our determination that performing procedures relating to the valuation of intangible assets acquired in the acquisition of the VCS Business is a critical audit matter are (i) the significant judgment by management when developing the fair value estimate of the intangible assets acquired; (ii) a high degree of auditor judgment, subjectivity, and effort in performing procedures and evaluating management's significant assumptions related to (a) short-term revenue growth rates, research and development expenses, EBITDA margins, income tax rates, discount rate, customer attrition rate, royalty rates, and contributory asset charge for the customer relationships, (b) short-term revenue growth rates, discount rate, and royalty rate for the trademark, and (c) short-term revenue growth rates, discount rate, royalty rates, and obsolescence rates for certain technologies; and (iii) the audit effort involved the use of professionals with specialized skill and knowledge.
Addressing the matter involved performing procedures and evaluating audit evidence in connection with forming our overall opinion on the consolidated financial statements. These procedures included testing the effectiveness of controls relating to the acquisition accounting, including controls over management’s valuation of the intangible assets acquired. These procedures also included, among others (i) reading the purchase agreement; (ii) testing management’s process for developing the fair value estimate of the intangible assets acquired; (iii) evaluating the appropriateness of the multi-period excess earnings and relief from royalty methods used by management; (iv) testing the completeness and accuracy of the underlying data used in the multi-period excess earnings and relief from royalty methods; and (v) evaluating the reasonableness of the significant assumptions used by management related to (a) short-term revenue growth rates, research and development expenses, EBITDA margins, income tax rates, discount rate, customer attrition rate, royalty rates, and contributory asset charge for the customer relationships, (b) short-term revenue growth rates, discount rate, and royalty rate for the trademark, and (c) short-term revenue growth rates, discount rate, royalty rates, and obsolescence rates for certain technologies. Evaluating management’s assumptions related to (a) short-term revenue growth rates, research and development expenses, EBITDA margins, and income tax rates for the customer relationships, (b) short-term revenue growth rates for the trademark, and (c) short-term revenue growth rates for certain technologies involved considering (i) the current and past performance of the VCS Business; (ii) the consistency with external market and industry data; and (iii) whether the assumptions were consistent with evidence obtained in other areas of the audit. Professionals with specialized skill and knowledge were used to assist in evaluating (i) the appropriateness of the multi-period excess earnings and relief from royalty methods and (ii) the reasonableness of the (a) discount rate, customer attrition rate, royalty rates, and contributory asset charge assumptions for the customer relationships, (b) discount rate and royalty rate assumptions for the trademark, and (c) discount rate, royalty rates, and obsolescence rates assumptions for certain technologies.
/s/ PricewaterhouseCoopers LLP
Miami, Florida
February 11, 2025, except with respect to our opinion on the consolidated financial statements insofar as it relates to the change in composition of reportable segments discussed in Note 2, as to which the date is July 29, 2025
We have served as the Company's auditor since 2019.
CARRIER GLOBAL CORPORATION AND SUBSIDIARIES
CONSOLIDATED STATEMENT OF OPERATIONS
| | | | | | | | | | | | | | | | | | |
| For the Year Ended December 31, | |
| (In millions, except per share amounts) | 2024 | | 2023 | | 2022 | |
| Net sales | | | | | | |
| Product sales | $ | 19,990 | | | $ | 16,665 | | | $ | 15,315 | | |
| Service sales | 2,496 | | | 2,286 | | | 1,973 | | |
| Total Net sales | 22,486 | | | 18,951 | | | 17,288 | | |
| Costs and expenses | | | | | | |
| Cost of products sold | (14,580) | | | (12,002) | | | (11,459) | | |
| Cost of services sold | (1,925) | | | (1,787) | | | (1,532) | | |
| Research and development | (686) | | | (493) | | | (416) | | |
| Selling, general and administrative | (3,197) | | | (2,607) | | | (1,977) | | |
| Total Costs and expenses | (20,388) | | | (16,889) | | | (15,384) | | |
| Equity method investment net earnings | 231 | | | 211 | | | 262 | | |
| Other income (expense), net | 317 | | | (113) | | | 1,818 | | |
| Operating profit | 2,646 | | | 2,160 | | | 3,984 | | |
| Non-service pension benefit (expense) | (1) | | | (1) | | | (4) | | |
| Interest (expense) income, net | (371) | | | (160) | | | (157) | | |
| Earnings before income taxes | 2,274 | | | 1,999 | | | 3,823 | | |
| Income tax (expense) benefit | (1,062) | | | (521) | | | (616) | | |
| Earnings from continuing operations | 1,212 | | | 1,478 | | | 3,207 | | |
| Discontinued operations, net of tax | 4,496 | | | (38) | | | 377 | | |
| Net earnings (loss) | 5,708 | | | 1,440 | | | 3,584 | | |
| Less: Non-controlling interest in subsidiaries' | 104 | | | 91 | | | 50 | | |
| Net earnings (loss) attributable to common shareowners | $ | 5,604 | | | $ | 1,349 | | | $ | 3,534 | | |
| Amounts attributable to common shareowners: | | | | | | |
| Continuing operations | $ | 1,108 | | | $ | 1,387 | | | $ | 3,157 | | |
| Discontinued operations | 4,496 | | | (38) | | | 377 | | |
| Net earnings (loss) attributable to common shareowners | $ | 5,604 | | | $ | 1,349 | | | $ | 3,534 | | |
| Earnings per share | | | | | | |
| Basic: | | | | | | |
| Continuing operations | $ | 1.23 | | | $ | 1.66 | | | $ | 3.74 | | |
| Discontinued operations | 5.01 | | | (0.05) | | | 0.45 | | |
| Net earnings (loss) | $ | 6.24 | | | $ | 1.61 | | | $ | 4.19 | | |
| Diluted: | | | | | | |
| Continuing operations | $ | 1.22 | | | $ | 1.63 | | | $ | 3.67 | | |
| Discontinued operations | 4.93 | | | (0.05) | | | 0.43 | | |
| Net earnings (loss) | $ | 6.15 | | | $ | 1.58 | | | $ | 4.10 | | |
| Weighted-average number of shares outstanding | | | | | | |
| Basic | 898.2 | | | 837.3 | | | 843.4 | | |
| Diluted | 911.7 | | | 853.0 | | | 861.2 | | |
| | | | | | |
The accompanying notes are an integral part of the Consolidated Financial Statements.
CARRIER GLOBAL CORPORATION AND SUBSIDIARIES
CONSOLIDATED STATEMENT OF COMPREHENSIVE INCOME (LOSS)
| | | | | | | | | | | | | | | | | | |
| For the Year Ended December 31, | |
| (In millions) | 2024 | | 2023 | | 2022 | |
| | | | | | |
| | | | | | |
| Net earnings (loss) | $ | 5,708 | | | $ | 1,440 | | | $ | 3,584 | | |
| Other comprehensive income (loss), net of tax: | | | | | | |
| | | | | | |
| Foreign currency translation: | | | | | | |
| Foreign currency translation adjustments arising during period | (1,173) | | | 157 | | | (551) | | |
| | | | | | |
| Divestitures | 564 | | | — | | | (574) | | |
| | | | | | |
| | | | | | |
| Foreign currency translation adjustments arising during period | (609) | | | 157 | | | (1,125) | | |
| | | | | | |
| Pension and post-retirement benefit plans: | | | | | | |
| Net actuarial gain (loss) arising during period | (15) | | | (17) | | | 63 | | |
| | | | | | |
| Amortization of actuarial (gain) loss and prior service credit | 2 | | | 1 | | | 11 | | |
| Divestitures | 7 | | | — | | | 329 | | |
| | | | | | |
| (6) | | | (16) | | | 403 | | |
| Tax (expense) benefit | (1) | | | — | | | (3) | | |
| Pension and post-retirement benefit plans adjustments arising during period | (7) | | | (16) | | | 400 | | |
| | | | | | |
| | | | | | |
| | | | | | |
| | | | | | |
| | | | | | |
| | | | | | |
| | | | | | |
| | | | | | |
| Change in unrealized cash flow hedging: | | | | | | |
| Unrealized cash flow hedging gain (loss) arising during period | — | | | 58 | | | — | | |
| Amortization of unrealized cash flow hedging gain (loss) | (6) | | | — | | | — | | |
| (6) | | | 58 | | | — | | |
| Tax (expense) benefit | 2 | | | — | | | — | | |
| Change in unrealized cash flow hedging adjustments arising during period | (4) | | | 58 | | | — | | |
| | | | | | |
| Other comprehensive income (loss), net of tax | (620) | | | 199 | | | (725) | | |
| Comprehensive income (loss) | 5,088 | | | 1,639 | | | 2,859 | | |
| Less: Comprehensive income (loss) attributable to non-controlling interest | (104) | | | (88) | | | (24) | | |
| Comprehensive income (loss) attributable to common shareowners | $ | 4,984 | | | $ | 1,551 | | | $ | 2,835 | | |
The accompanying notes are an integral part of the Consolidated Financial Statements.
CARRIER GLOBAL CORPORATION AND SUBSIDIARIES
CONSOLIDATED BALANCE SHEET
| | | | | | | | | | | |
| As of December 31, |
| (In millions, except share amounts) | 2024 | | 2023 |
| Assets | | | |
| Cash and cash equivalents | $ | 3,969 | | | $ | 9,852 | |
| Accounts receivable, net | 2,651 | | | 2,080 | |
| Inventories, net | 2,299 | | | 1,823 | |
| Assets held for sale | — | | | 5,093 | |
| Other assets, current | 972 | | | 728 | |
| Total current assets | 9,891 | | | 19,576 | |
| Future income tax benefits | 1,131 | | | 718 | |
| Fixed assets, net | 2,999 | | | 2,160 | |
| Operating lease right-of-use assets | 554 | | | 421 | |
| Intangible assets, net | 6,432 | | | 945 | |
| Goodwill | 14,601 | | | 7,520 | |
| Pension and post-retirement assets | 43 | | | 32 | |
| Equity method investments | 1,194 | | | 1,140 | |
| Other assets | 558 | | | 310 | |
| Total Assets | $ | 37,403 | | | $ | 32,822 | |
| | | |
| Liabilities and Equity | | | |
| Accounts payable | $ | 2,458 | | | $ | 2,483 | |
| Accrued liabilities | 4,182 | | | 2,997 | |
| Liabilities held for sale | — | | | 1,450 | |
| Current portion of long-term debt | 1,252 | | | 51 | |
| Total current liabilities | 7,892 | | | 6,981 | |
| Long-term debt | 11,026 | | | 14,242 | |
| Future pension and post-retirement obligations | 214 | | | 149 | |
| Future income tax obligations | 2,015 | | | 523 | |
| Operating lease liabilities | 432 | | | 333 | |
| Other long-term liabilities | 1,429 | | | 1,589 | |
| Total Liabilities | 23,008 | | | 23,817 | |
Commitments and contingent liabilities (Note 23) | | | |
| Equity | | | |
| | | |
Common stock, par value $0.01; 4,000,000,000 shares authorized; 948,068,772 and 883,068,393 shares issued; 878,337,677 and 839,910,275 outstanding as of December 31, 2024 and 2023, respectively | 9 | | | 9 | |
Treasury stock - 70,093,639 and 43,490,981 common shares, respectively | (3,915) | | | (1,972) | |
| Additional paid-in capital | 8,610 | | | 5,535 | |
| Retained earnings | 11,483 | | | 6,591 | |
| Accumulated other comprehensive income (loss) | (2,106) | | | (1,486) | |
| Non-controlling interest | 314 | | | 328 | |
| Total Equity | 14,395 | | | 9,005 | |
| Total Liabilities and Equity | $ | 37,403 | | | $ | 32,822 | |
The accompanying notes are an integral part of the Consolidated Financial Statements.
CARRIER GLOBAL CORPORATION AND SUBSIDIARIES
CONSOLIDATED STATEMENT OF CHANGES IN EQUITY
| | | | | | | | | | | | | | | | | | | | | | | | | | | | | | | | | | | | | | | | | | | | | | | | |
| (In millions) | | | | Accumulated Other Comprehensive Income (Loss) | | Common Stock | | Treasury Stock | | Additional Paid-In Capital | | Retained Earnings | | Non-Controlling Interest | | Total Equity | | |
| | | | | | | | | | | | | | | | | | |
| Balance, December 31, 2021 | | | | $ | (989) | | | $ | 9 | | | $ | (529) | | | $ | 5,411 | | | $ | 2,865 | | | $ | 327 | | | $ | 7,094 | | | |
| | | | | | | | | | | | | | | | | | |
| Net earnings (loss) | | | | — | | | — | | | — | | | — | | | 3,534 | | | 50 | | | 3,584 | | | |
| Other comprehensive income (loss), net of tax | | | | (699) | | | — | | | — | | | — | | | — | | | (26) | | | (725) | | | |
Dividends declared on common stock ($0.635 per share) | | | | — | | | — | | | — | | | — | | | (533) | | | — | | | (533) | | | |
| Shares issued under incentive plans, net | | | | — | | | — | | | — | | | (12) | | | — | | | — | | | (12) | | | |
| Stock-based compensation | | | | — | | | — | | | — | | | 77 | | | — | | | — | | | 77 | | | |
| Acquisition (sale) of non-controlling interest, net | | | | — | | | — | | | — | | | 5 | | | — | | | 17 | | | 22 | | | |
| Dividends attributable to non-controlling interest | | | | — | | | — | | | — | | | — | | | — | | | (50) | | | (50) | | | |
| Treasury stock repurchases | | | | — | | | — | | | (1,381) | | | — | | | — | | | — | | | (1,381) | | | |
| | | | | | | | | | | | | | | | | | |
| | | | | | | | | | | | | | | | | | |
| | | | | | | | | | | | | | | | | | |
| Balance at December 31, 2022 | | | | $ | (1,688) | | | $ | 9 | | | $ | (1,910) | | | $ | 5,481 | | | $ | 5,866 | | | $ | 318 | | | $ | 8,076 | | | |
| | | | | | | | | | | | | | | | | | |
| Net earnings (loss) | | | | — | | | — | | | — | | | — | | | 1,349 | | | 91 | | | 1,440 | | | |
| Other comprehensive income (loss), net of tax | | | | 202 | | | — | | | — | | | — | | | — | | | (3) | | | 199 | | | |
Dividends declared on common stock ($0.745 per share) | | | | — | | | — | | | — | | | — | | | (624) | | | — | | | (624) | | | |
| Shares issued under incentive plans, net | | | | — | | | — | | | — | | | (27) | | | — | | | — | | | (27) | | | |
| Stock-based compensation | | | | — | | | — | | | — | | | 81 | | | — | | | — | | | 81 | | | |
| Acquisition (sale) of non-controlling interest, net | | | | — | | | — | | | — | | | — | | | — | | | (22) | | | (22) | | | |
| Dividends attributable to non-controlling interest | | | | — | | | — | | | — | | | — | | | — | | | (56) | | | (56) | | | |
| Treasury stock repurchases | | | | — | | | — | | | (62) | | | — | | | — | | | — | | | (62) | | | |
| | | | | | | | | | | | | | | | | | |
| | | | | | | | | | | | | | | | | | |
| | | | | | | | | | | | | | | | | | |
| | | | | | | | | | | | | | | | | | |
| | | | | | | | | | | | | | | | | | |
| Balance at December 31, 2023 | | | | $ | (1,486) | | | $ | 9 | | | $ | (1,972) | | | $ | 5,535 | | | $ | 6,591 | | | $ | 328 | | | $ | 9,005 | | | |
| | | | | | | | | | | | | | | | | | |
| Net earnings (loss) | | | | — | | | — | | | — | | | — | | | 5,604 | | | 104 | | | 5,708 | | | |
| Other comprehensive income (loss), net of tax | | | | (620) | | | — | | | — | | | — | | | — | | | — | | | (620) | | | |
Dividends declared on common stock ($0.795 per share) | | | | — | | | — | | | — | | | — | | | (712) | | | — | | | (712) | | | |
| Shares issued under incentive plans, net | | | | — | | | — | | | — | | | (25) | | | — | | | — | | | (25) | | | |
| Stock-based compensation | | | | — | | | — | | | — | | | 100 | | | — | | | — | | | 100 | | | |
| Acquisition of VCS Business | | | | — | | | — | | | — | | | 3,000 | | | — | | | — | | | 3,000 | | | |
| Acquisition (sale) of non-controlling interest, net | | | | — | | | — | | | — | | | — | | | — | | | (36) | | | (36) | | | |
| Dividends attributable to non-controlling interest | | | | — | | | — | | | — | | | — | | | — | | | (82) | | | (82) | | | |
| Treasury stock repurchase | | | | — | | | — | | | (1,943) | | | — | | | — | | | — | | | (1,943) | | | |
| | | | | | | | | | | | | | | | | | |
| | | | | | | | | | | | | | | | | | |
| | | | | | | | | | | | | | | | | | |
| | | | | | | | | | | | | | | | | | |
| | | | | | | | | | | | | | | | | | |
| Balance as of December 31, 2024 | | | | $ | (2,106) | | | $ | 9 | | | $ | (3,915) | | | $ | 8,610 | | | $ | 11,483 | | | $ | 314 | | | $ | 14,395 | | | |
| | | | | | | | | | | | | | | | | | |
The accompanying notes are an integral part of the Consolidated Financial Statements.
CARRIER GLOBAL CORPORATION AND SUBSIDIARIES
CONSOLIDATED STATEMENT OF CASH FLOWS
| | | | | | | | | | | | | | | | | |
| | For the Year Ended December 31, |
| (In millions) | 2024 | | 2023 | | 2022 |
| Operating Activities | | | | | |
| Net earnings (loss) | $ | 5,708 | | | $ | 1,440 | | | $ | 3,584 | |
| Discontinued operations, net of tax | (4,496) | | | 38 | | | (377) | |
| Adjustments for non-cash items, net: | | | | | |
| Depreciation and amortization | 1,232 | | | 491 | | | 328 | |
| Deferred income tax provision | (352) | | | (243) | | | (106) | |
| Stock-based compensation cost | 86 | | | 71 | | | 65 | |
| Equity method investment net earnings | (231) | | | (211) | | | (262) | |
| | | | | |
| (Gain) loss on extinguishment of debt | (82) | | | — | | | (36) | |
| (Gain) loss on sale of investments / deconsolidation | (322) | | | (19) | | | (1,815) | |
| | | | | |
| Changes in operating assets and liabilities | | | | | |
| Accounts receivable, net | (40) | | | (161) | | | (51) | |
| Inventories, net | 292 | | | 123 | | | (173) | |
| Accounts payable and accrued liabilities | 87 | | | 541 | | | (17) | |
| Distributions from equity method investments | 46 | | | 129 | | | 148 | |
| Other operating activities, net | (357) | | | 53 | | | 217 | |
| Net cash flows provided by (used in) continuing operating activities | 1,571 | | | 2,252 | | | 1,505 | |
| Net cash flows provided by (used in) discontinued operating activities | (1,008) | | | 355 | | | 238 | |
| Net cash flows provided by (used in) operating activities | 563 | | | 2,607 | | | 1,743 | |
| | | | | |
| Investing Activities | | | | | |
| Capital expenditures | (519) | | | (439) | | | (317) | |
| | | | | |
| Investment in businesses, net of cash acquired | (10,890) | | | (84) | | | (506) | |
| Dispositions of businesses | 634 | | | 54 | | | 2,902 | |
| Settlement of derivative contracts, net | (264) | | | (50) | | | (194) | |
| Payment to former shareholders of TCC | — | | | — | | | (104) | |
| Other investing activities, net | 14 | | | 15 | | | 20 | |
| Net cash flows provided by (used in) continuing investing activities | (11,025) | | | (504) | | | 1,801 | |
| Net cash flows provided by (used in) discontinued investing activities | 9,000 | | | (156) | | | (56) | |
| Net cash flows provided by (used in) investing activities | (2,025) | | | (660) | | | 1,745 | |
| | | | | |
| Financing Activities | | | | | |
| (Decrease) increase in short-term borrowings, net | 50 | | | (5) | | | (149) | |
| Issuance of long-term debt | 3,412 | | | 5,609 | | | 432 | |
| Repayment of long-term debt | (5,345) | | | (111) | | | (1,275) | |
| Repurchases of common stock | (1,944) | | | (62) | | | (1,380) | |
| Dividends paid on common stock | (670) | | | (620) | | | (509) | |
| Dividends paid to non-controlling interest | (84) | | | (58) | | | (46) | |
| Other financing activities, net | (30) | | | (121) | | | (1) | |
| Net cash flows provided by (used in) continuing financing activities | (4,611) | | | 4,632 | | | (2,928) | |
| Net cash flows provided by (used in) discontinued financing activities | (25) | | | (20) | | | (3) | |
| Net cash flows provided by (used in) financing activities | (4,636) | | | 4,612 | | | (2,931) | |
| Effect of foreign exchange rate changes on cash and cash equivalents | (103) | | | 88 | | | (56) | |
| Net increase (decrease) in cash and cash equivalents and restricted cash, including cash classified in current assets held for sale | (6,201) | | | 6,647 | | | 501 | |
| Less: Change in cash balances classified as assets held for sale | (320) | | | 97 | | | (33) | |
| Net increase (decrease) in cash and cash equivalents and restricted cash | (5,881) | | | 6,550 | | | 534 | |
| Cash, cash equivalents and restricted cash, beginning of period | 9,853 | | | 3,303 | | | 2,769 | |
| Cash, cash equivalents and restricted cash, end of period | 3,972 | | | 9,853 | | | 3,303 | |
| Less: restricted cash | 3 | | | 1 | | | 5 | |
| Cash and cash equivalents, end of period | $ | 3,969 | | | $ | 9,852 | | | $ | 3,298 | |
The accompanying notes are an integral part of the Consolidated Financial Statements.
CARRIER GLOBAL CORPORATION AND SUBSIDIARIES
NOTES TO THE CONSOLIDATED FINANCIAL STATEMENTS
NOTE 1: DESCRIPTION OF THE BUSINESS
Carrier Global Corporation (the "Company") is a global leader in intelligent climate and energy solutions with a focus on providing differentiated, digitally-enabled lifecycle solutions to its customers. The Company's portfolio includes industry-leading brands such as Carrier, Viessmann, Toshiba, Automated Logic and Carrier Transicold that offer innovative heating, ventilating and air conditioning ("HVAC"), refrigeration and cold chain transportation solutions to help make the world safer and more comfortable. The Company also provides a broad array of related building services, including audit, design, installation, system integration, repair, maintenance and monitoring. The Company's operations are classified into four segments: Climate Solutions Americas, Climate Solutions Europe, Climate Solutions Asia Pacific, Middle East & Africa and Climate Solutions Transportation.
NOTE 2: BASIS OF PRESENTATION
The accompanying Consolidated Financial Statements reflect the consolidated operations of the Company and have been prepared in accordance with U.S. Generally Accepted Accounting Principles ("GAAP") as defined by the Financial Accounting Standards Board ("FASB") within the FASB Accounting Standards Codification ("ASC"). Inter-company accounts and transactions have been eliminated. Related party transactions between the Company and its equity method investees have not been eliminated.
The accompanying Consolidated Financial Statements include all majority-owned subsidiaries of the Company. A non-controlling interest in a subsidiary is considered an ownership interest in a majority-owned subsidiary that is not attributable to the parent. The Company includes Non-controlling interest as a component of Total equity in the accompanying Consolidated Balance Sheet and the Non-controlling interest in subsidiaries' earnings from operations are presented as an adjustment to Earnings before income taxes used to arrive at Net earnings (loss) attributable to common shareowners in the accompanying Consolidated Statement of Operations. Partially-owned equity affiliates represent 20 to 50% ownership interests in investments where the Company demonstrates significant influence, but does not have a controlling financial interest. Partially-owned equity affiliates are accounted for under the equity method.
Acquisition of Viessmann Climate Solutions
On April 25, 2023, the Company announced that it entered into a Share Purchase Agreement (the “Agreement”) to acquire the climate solutions business (the "VCS Business") of Viessmann Group GmbH & Co. KG (“Viessmann”), a privately-held company. The acquisition was completed on January 2, 2024. As a result, the assets, liabilities and results of operations of the VCS Business are consolidated in the accompanying Consolidated Financial Statements as of the date of acquisition and reported primarily within the Company’s Climate Solutions Europe segment. See Note 19 - Acquisitions for additional information.
Portfolio Transformation
On December 7, 2023, the Company entered into a stock purchase agreement to sell its Access Solutions business ("Access Solutions") to Honeywell International Inc. As a result, the assets and liabilities of Access Solutions are presented as held for sale on the accompanying Consolidated Balance Sheet as of December 31, 2023, and recorded at the lower of their carrying value or fair value less estimated cost to sell. The sale of Access Solutions was completed on June 2, 2024. See Note 20 - Divestitures for additional information.
During the fourth quarter of 2023, the net assets of the Company's Industrial Fire business ("Industrial Fire") met the criteria to be classified as held for sale. As a result, the assets and liabilities of Industrial Fire are presented as held for sale on the accompanying Consolidated Balance Sheet as of December 31, 2023, and recorded at the lower of their carrying value or fair value less estimated cost to sell. On March 5, 2024, the Company entered into a stock purchase agreement to sell Industrial Fire to Sentinel Capital Partners. The sale of Industrial Fire was completed on July 1, 2024. See Note 20 - Divestitures for additional information.
On December 12, 2023, the Company entered into a stock purchase agreement to sell its Commercial Refrigeration business ("CCR") to Haier Group Corporation. As a result, the assets and liabilities of CCR are presented as held for sale on the accompanying Consolidated Balance Sheet as of December 31, 2023, and recorded at the lower of their carrying value or fair value less estimated cost to sell. The sale of CCR was completed on October 1, 2024. See Note 20 - Divestitures for additional information.
On August 15, 2024, the Company entered into a stock purchase agreement to sell its Commercial and Residential Fire business (“CRF Business”) to an affiliate of Lone Star Funds. As a result, the assets and liabilities of the CRF Business are presented as held for sale on the accompanying Consolidated Balance Sheet as of December 31, 2023, and recorded at the lower of their carrying value or fair value less estimated cost to sell. The sale of CRF was completed on December 2, 2024. See Note 20 - Divestitures for additional information.
Segment Reorganization
As a result of the Company's portfolio transformation, the Company revised its reportable segments during the first quarter to better reflect its business strategy, align its management reporting and increase transparency for investors. Under the revised segment structure, the Company has three new regional HVAC operating segments. Combined with the Climate Solutions Transportation operating segment, the four operating segments also serve as the Company's reportable segments. This model is designed to create a simplified, more focused and customer-centric organization across the globe. Each segment reports through separate management teams which regularly review their operating results with the Company's Chief Operating Decision Maker (the "CODM") determined in accordance with applicable accounting guidance. In connection with the revised structure, the CODM changed the measure used to evaluate segment profitability from Operating profit to Segment operating profit. All prior period comparative information has been recast to reflect the revised segment structure. See Note 21 - Segment Financial Data for additional information.
Discontinued Operations
In 2023, the Company announced plans to exit its Fire & Security and Commercial Refrigeration businesses over the course of 2024. The announced plan to exit the Fire & Security segment represents a single disposal plan to separately divest multiple businesses over different reporting periods. Upon the CRF Business qualifying as held for sale during the year ended December 31, 2024, the components of the Fire & Security segment in aggregate met the criteria to be presented as discontinued operations in the accompanying Consolidated Statement of Operations and Consolidated Statement of Cash Flows. In addition, the assets and liabilities of the CRF Business have been reclassified to held for sale at December 31, 2023. The results of the CCR business did not meet the criteria to be presented as discontinued operations. See Note 20 - Divestitures for additional information.
Deconsolidation of Kidde-Fenwal, Inc.
On May 14, 2023, Kidde-Fenwal, Inc. ("KFI"), an indirect wholly-owned subsidiary of the Company, filed a petition for voluntary reorganization under Chapter 11 of the United States Bankruptcy Code ("Chapter 11") in the United States Bankruptcy Court for the District of Delaware. KFI, an industrial fire detection and suppression business historically reported in the Company's Fire & Security segment, filed a voluntary petition with the United States Bankruptcy Court for the District of Delaware (the “Bankruptcy Court”) seeking relief under chapter 11 of the Bankruptcy Code. As of the petition date, KFI was deconsolidated and its respective assets and liabilities were derecognized from the Company's Consolidated Financial Statements.
Acquisition of Toshiba Carrier Corporation
On February 6, 2022, the Company entered into a binding agreement to acquire a majority ownership interest in Toshiba Carrier Corporation (“TCC”), a variable refrigerant flow ("VRF") and light commercial HVAC joint venture between Carrier and Toshiba Corporation. The acquisition was completed on August 1, 2022. As a result, the assets, liabilities and results of operations of TCC are consolidated in the accompanying Consolidated Financial Statements as of the date of acquisition and primarily reported within the Company’s Climate Solutions Asia Pacific, Middle East & Africa segment. Upon closing, Toshiba Corporation retained a 5% ownership interest in TCC.
Sale of Chubb Fire & Security Business
On July 26, 2021, the Company entered into a stock purchase agreement to sell its Chubb Fire and Security business ("Chubb") to APi Group Corporation ("APi"). Chubb, which was reported within the Company's Fire & Security segment, delivered essential fire safety and security solutions from design and installation to monitoring, service and maintenance across more than 17 countries around the globe. On January 3, 2022, the Company completed the sale of Chubb (the "Chubb Sale") for net proceeds of $2.9 billion and recognized a gain on the sale of $1.1 billion, which is included in Other income (expense), net during the year ended December 31, 2022.
Separation from United Technologies
On April 3, 2020 (the "Distribution Date"), United Technologies Corporation ("UTC"), since renamed RTX Corporation ("Raytheon Technologies Corporation" or "RTX"), completed the spin-off of Carrier into an independent, publicly traded company (the "Separation") through a pro rata distribution (the "Distribution") on a one-for-one basis of all of the outstanding shares of common stock of Carrier to UTC shareowners who held shares of UTC common stock as of the close of business on March 19, 2020, the record date for the Distribution. In addition, the Company entered into several agreements with UTC and Otis Worldwide Corporation ("Otis") that govern various aspects of the relationship among the Company, UTC and Otis. As of December 31, 2024, only certain portions of the Tax Matters Agreement ("TMA") remain in effect.
NOTE 3: SUMMARY OF SIGNIFICANT ACCOUNTING POLICIES
A summary of significant accounting policies used in the preparation of the accompanying Consolidated Financial Statements is as follows:
Use of Estimates. The preparation of the Consolidated Financial Statements in conformity with GAAP requires management to make estimates and assumptions that affect the reported amounts of assets and liabilities and the disclosure of contingent assets and liabilities at the date of the financial statements as well as the reported amounts of revenues and expenses during the reporting period. Estimates are based on several factors including the facts and circumstances available at the time the estimates are made, historical experience and various other assumptions that are believed to be reasonable under the circumstances. Actual results could differ from those estimates.
Currency Translation. Assets and liabilities of non-U.S. subsidiaries, where the functional currency is not the U.S. dollar, have been translated at year-end exchange rates, and income and expense accounts have been translated using average exchange rates throughout the year. Adjustments resulting from the process of translating an entity’s financial statements into the U.S. dollar have been recorded in the equity section of the Consolidated Balance Sheet within Accumulated other comprehensive income (loss). Transactions that are denominated in a currency other than an entity’s functional currency are subject to changes in exchange rates with the resulting gains and losses recorded in Net earnings (loss).
Cash and Cash Equivalents. Cash and cash equivalents include cash on hand, demand deposits and short-term cash investments that are highly liquid in nature and have original maturities of three months or less. On occasion, the Company is required to maintain restricted cash deposits with certain banks due to contractual or other legal obligations. Restricted cash of $3 million and $1 million is included in Other assets, current as of December 31, 2024 and 2023, respectively.
Accounts Receivable. Accounts receivable consist of billed amounts owed for products shipped to or services performed for customers. Amounts are recorded net of an allowance for expected credit losses which represents the best estimate of probable loss inherent in the Company's accounts receivable portfolio. The allowance is determined using a combination of factors including a reserve based on the aging of the outstanding accounts receivable portfolio and the Company's historical credit loss experience with its end markets, customer base and products. In addition, the Company considers knowledge of specific customers, current market conditions as well as reasonable and supportable forecasts of future events and economic conditions. As of December 31, 2024 and 2023, the allowance for expected credit losses was $97 million and $91 million, respectively. These estimates and assumptions are reviewed periodically with the effects of changes, if any, reflected in the Consolidated Statement of Operations in the period that they are determined.
Fixed Assets. Property, plant and equipment are stated at cost less accumulated depreciation. Assets placed in service are recorded at cost and depreciated using the straight-line method over the estimated useful life of the asset. Assets acquired in a business combination are recorded at fair value at the date of acquisition. Major expenditures for replacements and significant improvements that increase asset values and extend useful lives are capitalized. Repairs and maintenance expenditures that do not extend the useful life of an asset are charged to expense as incurred.
Per ASC 360, Property, Plant and Equipment ("ASC 360"), the Company assesses the recoverability of the carrying value of its property, plant and equipment whenever events or changes in circumstances indicate that the carrying amount of an asset group may not be recoverable. Recoverability is measured by a comparison of the carrying amount of an asset group to the future net undiscounted cash flows expected to be generated by the asset group. If the undiscounted cash flows are less than the carrying amount of the asset group, an impairment loss is recognized for the amount by which the carrying amount of the asset group exceeds the fair value of the asset group.
Equity Method Investments. Investments in which the Company has the ability to exercise significant influence, but does not control, are accounted for under the equity method of accounting and are presented on the Consolidated Balance Sheet. Under this method of accounting, the Company’s share of the net earnings or losses of the investee is presented within Operating profit on the Consolidated Statement of Operations since the activities of the investee are closely aligned with the operations of the Company. The Company evaluates its equity method investments whenever events or changes in circumstance indicate that the carrying amounts of such investments may be impaired. If a decline in the value of an equity method investment is determined to be other than temporary, a loss is recorded in earnings in the current period. Distributions received from equity method investees are presented in the Consolidated Statement of Cash Flows based on the cumulative earnings approach.
Goodwill and Intangible Assets. The Company records goodwill as the excess of the purchase price over the fair value of the net assets acquired in a business combination. In accordance with ASC 350, Intangibles - Goodwill and Other ("ASC 350"), goodwill and other indefinite-lived intangibles are tested and reviewed annually for impairment on July 1 or whenever there is a material change in events or circumstances that indicate that the fair value of the asset is more likely than not less than the carrying amount of the asset.
Impairment of goodwill is assessed at the reporting unit level and begins with a qualitative assessment to determine if it is more likely than not that the fair value of each reporting unit is less than its carrying amount as a basis for determining whether it is necessary to perform the goodwill impairment test under ASC 350. For those reporting units that bypass or fail the qualitative assessment, the test compares the carrying amount of the reporting unit to its estimated fair value. If the estimated fair value of a reporting unit exceeds its carrying amount, goodwill of the reporting unit is not impaired. To the extent that the carrying amount of the reporting unit exceeds its estimated fair value, an impairment loss will be recognized for the amount by which the reporting unit's carrying amount exceeds its fair value, not to exceed the carrying amount of goodwill in that reporting unit.
Intangible assets such as patents, service contracts, monitoring lines and customer relationships with finite useful lives are amortized based on the pattern in which the economic benefits of the intangible assets are consumed. If a pattern of economic benefit cannot be reliably determined or if straight-line amortization approximates the pattern of economic benefit, a straight-line amortization may be used.
The range of useful lives approximate the following (in years):
| | | | | |
| Customer relationships | 1 to 30 |
| Patents and trademarks | 5 to 40 |
| Monitoring lines | 7 to 10 |
| Service portfolio and other | 1 to 50 |
The Company assesses the recoverability of the carrying amount of its intangible assets with finite useful lives whenever events or changes in circumstances indicate that the carrying amount of the asset group may not be recoverable. Recoverability is measured by a comparison of the carrying amount of an asset group to the future net undiscounted cash flows expected to be generated by the asset group. If the undiscounted cash flows are less than the carrying amount of the asset group, an impairment loss is recognized for the amount by which the carrying value of the asset group exceeds the fair value of the asset group.
Leases. The Company accounts for leases in accordance with ASC 842, Leases ("ASC 842"), which requires a lessee to record a right-of-use ("ROU") asset and a lease liability on the Consolidated Balance Sheet for all leases with terms longer than 12 months. ROU assets and liabilities are recognized at the commencement date based on the present value of lease payments over the lease term. The Company generally uses its incremental borrowing rate, which is based on information available at the lease commencement date, to determine the present value of lease payments except when an implicit interest rate is readily determinable. The lease term may include options to extend or terminate the lease when it is reasonably certain that the Company will exercise that option. The Company has elected not to recognize ROU assets and lease obligations for its short-term leases, which are defined as leases with an initial term of 12 months or less.
Income Taxes. The Company accounts for income taxes in accordance with ASC 740, Income Taxes ("ASC 740"). Deferred tax assets and liabilities are determined based on temporary differences between financial reporting and tax bases of assets and liabilities, applying enacted tax rates expected to be in effect for the year in which the differences are expected to reverse. The Company recognizes future tax benefits to the extent that realizing these benefits is considered in its judgment to be more likely than not. For those jurisdictions where the expiration date of tax carryforwards or the projected operating results indicate that realization is not likely, a valuation allowance is provided. The Company reviews the realizability of its deferred tax asset valuation allowances on a quarterly basis, or whenever events or changes in circumstances indicate that a review is required and will adjust its estimate if significant events so dictate. To the extent that the ultimate results differ from the Company's original or adjusted estimates, the effect will be recorded in the provision for income taxes in the period that the matter is finally resolved.
In the ordinary course of business, there is inherent uncertainty in quantifying the Company's income tax positions. The Company assesses its income tax positions and records tax benefits for all years subject to examination based upon management’s evaluation of the facts, circumstances and information available at the reporting date. For those tax positions where it is more likely than not that a tax benefit will be sustained, the Company has recorded the largest amount of tax benefit with a greater than 50% likelihood of being realized upon ultimate settlement with a taxing authority that has full knowledge of all relevant information. For those income tax positions where it is not more likely than not that a tax benefit will be sustained, no tax benefit has been recognized in the Consolidated Financial Statements.
Pension and Post-retirement Obligations. The Company provides a range of benefit plans to eligible current and former employees. The Company accounts for its benefit plans in accordance with ASC 715, Compensation - Retirement Benefits ("ASC 715") which requires balance sheet recognition of the overfunded or underfunded status of pension and post-retirement benefit plans. Determining the amounts associated with these benefits are performed by actuaries and dependent on various actuarial assumptions including discount rates, expected return on plan assets, compensation increases, mortality and health care cost trends. Actual results may differ from the actuarial assumptions and are generally recorded in Accumulated other comprehensive income (loss) and amortized into Net earnings (loss) over future periods. The Company reviews its actuarial assumptions at each measurement date and makes modifications to the assumptions based on current rates and trends, if appropriate. See Note 10 – Employee Benefit Plans for additional information.
Business Combinations. In accordance with ASC 805, Business Combinations ("ASC 805"), acquisitions that meet the definition of a business are recorded using the acquisition method of accounting. The Company recognizes and measures identifiable assets acquired, liabilities assumed and any non-controlling interest as of the acquisition date at fair value. The valuation of intangible assets is determined by an income approach methodology, using assumptions such as projected future revenues, customer attrition rates, royalty rates, tax rates and discount rates. The excess, if any, of total consideration transferred in a business combination over the fair value of identifiable assets acquired, liabilities assumed and any non-controlling interest is recognized as goodwill. Costs incurred as a result of a business combination other than costs related to the issuance of debt or equity securities are recorded in the period the costs are incurred.
Asset Retirement Obligations. The Company records the fair value of legal obligations associated with the retirement of tangible long-lived assets in the period in which a liability is determined to exist, if a reasonable estimate of fair value can be made. Upon initial recognition of a liability, the Company capitalizes the cost of the asset retirement obligation by increasing the carrying amount of the related long-lived asset. Over time, the liability is increased for changes in its present value and the capitalized cost is depreciated over the useful life of the related asset.
Research and Development. The Company conducts research and development activities with a focus on new product development and technology innovation. These costs are charged to expense as incurred. For the years ended December 31, 2024, 2023 and 2022, these costs amounted to $686 million, $493 million and $416 million, respectively.
Recent Pronouncements
The FASB ASC is the sole source of authoritative GAAP other than United States Securities and Exchange Commission ("SEC') issued rules and regulations that apply only to SEC registrants. The FASB issues Accounting Standards Updates ("ASU") to communicate changes to the codification. The Company considers the applicability and impact of all ASUs. ASUs not referenced below were assessed and determined to be either not applicable or are not expected to have a material impact on the Consolidated Financial Statements.
Recently Issued and Adopted Accounting Pronouncements
In November 2023, the FASB issued ASU 2023-07, Segment Reporting (Topic 280): Improvements to Reportable Segment Disclosures (“ASU 2023-07”), which requires public entities to disclose information about their reportable segments’ significant expenses on an interim and annual basis. In addition, the amendments clarify circumstances in which an entity can disclose multiple segment measures of profit or loss, provides new segment disclosure requirements for entities with a single reportable segment and contains other disclosure requirements. The Company adopted ASU 2023-07 on January 1, 2024, with no material impact on its financial statements.
In December 2023, the FASB issued ASU 2023-09, Income Taxes (Topic 740): Improvements to Income Tax Disclosures ("ASU 2023-09"), which requires public entities to disclose disaggregated information about their effective tax rate reconciliation as well as information on income taxes paid. ASU 2023-09 is effective for fiscal years beginning after December 15, 2024, with early adoption permitted. The Company is currently assessing the impact of this ASU on its financial statements.
On March 6, 2024, the SEC adopted new rules designed to enhance public company disclosures related to the risks and impacts of climate-related matters. The rules amend the provisions of both Regulation S-K and Regulation S-X to require disclosure of climate-related risks, transition plans, targets and goals, risk management and governance as well as require disclosure of the financial effects of severe weather events and other natural conditions as well as the use of carbon offsets or renewable energy credits. Disclosure requirements will begin phasing in for fiscal years beginning on or after January 1, 2025, subject to legal challenges and the SEC's voluntary stay of the disclosure requirements. The Company will continue to assess the impact of these new rules on its financial statements while the stay is in place.
In November 2024, the FASB issued ASU 2024-03, Disaggregation of Income Statement Expenses (DISE) ("ASU 2024-03"), which requires public entities to disclose disaggregated information about expenses by nature on an interim and annual basis. ASU 2024-03 is effective for fiscal years beginning after December 15, 2026 and interim periods within fiscal years beginning after December 15, 2027, with early adoption permitted. The Company is currently assessing the impact of this ASU on its financial statements.
NOTE 4: INVENTORIES, NET
Inventories are stated at the lower of cost or estimated net realizable value. Cost is primarily determined based on the first-in, first-out inventory method ("FIFO") or average cost methods, which approximates current replacement cost. However, certain Carrier entities use the last-in, first-out inventory method ("LIFO").
Inventories, net consisted of the following:
| | | | | | | | | | | |
| (In millions) | 2024 | | 2023 |
| Raw materials | $ | 625 | | | $ | 534 | |
| Work-in-process | 213 | | | 245 | |
| Finished goods | 1,461 | | | 1,044 | |
| | | |
| Inventories, net | $ | 2,299 | | | $ | 1,823 | |
The Company performs periodic assessments utilizing customer demand, production requirements and historical usage rates to determine the existence of excess and obsolete inventory and records necessary provisions to reduce such inventories to the lower of cost or estimated net realizable value. Raw materials, work-in-process and finished goods are net of valuation reserves of $215 million and $173 million as of December 31, 2024 and 2023, respectively.
Certain entities use LIFO to determine the cost of inventory. If inventories that were valued using the LIFO method had been valued under the FIFO method, the net book value of the inventories would have been higher by $238 million and $226 million as of December 31, 2024 and 2023, respectively. As of December 31, 2024 and 2023, approximately 39% and 42%, respectively, of all inventory utilized the LIFO method.
NOTE 5: FIXED ASSETS, NET
Fixed assets, net consisted of the following:
| | | | | | | | | | | | | | | | | |
| (In millions) | Estimated Useful Lives (Years) | | 2024 | | 2023 |
| Land | | | $ | 169 | | | $ | 109 | |
| Buildings and improvements | 20 to 40 | | 1,325 | | | 1,083 | |
| Machinery, tools and equipment | 3 to 25 | | 2,947 | | | 2,520 | |
| Rental assets | 3 to 12 | | 355 | | | 346 | |
| Other, including assets under construction | | | 715 | | | 415 | |
| Fixed assets, gross | | | 5,511 | | | 4,473 | |
| Accumulated depreciation | | | (2,512) | | | (2,313) | |
| Fixed assets, net | | | $ | 2,999 | | | $ | 2,160 | |
Depreciation expense was $385 million, $270 million and $224 million for the years ended December 31, 2024, 2023 and 2022, respectively.
NOTE 6: GOODWILL AND INTANGIBLE ASSETS
The Company records goodwill as the excess of the purchase price over the fair value of the net assets acquired in a business combination. Goodwill is tested and reviewed annually for impairment on July 1 or whenever there is a material change in events or circumstances that indicates that the fair value of the reporting unit may be less than its carrying value.
In connection with its revised segment structure, the Company performed a quantitative goodwill impairment test on its reporting units prior to the reorganization to determine if any impairment existed. The tests did not indicate any goodwill impairment. The Company then reassigned goodwill among its new reporting units using a relative fair value approach.
The changes in the carrying amount of goodwill were as follows:
| | | | | | | | | | | | | | | | | | | | | | | | | | | | | | | | |
| (In millions) | | Climate Solutions Americas | | Climate Solutions Europe | | Climate Solutions Asia Pacific, Middle East & Africa | | Climate Solutions Transportation | | Total |
| Balance at December 31, 2022 | | $ | 4,533 | | | $ | 712 | | | $ | 1,223 | | | $ | 1,158 | | | $ | 7,626 | |
Goodwill resulting from business combinations (1) | | 10 | | | — | | | (9) | | | (4) | | | (3) | |
Reclassified to held for sale (2) | | — | | | — | | | — | | | (72) | | | (72) | |
| Foreign currency translation | | — | | | (9) | | | 23 | | | (45) | | | (31) | |
| Balance at December 31, 2023 | | $ | 4,543 | | | $ | 703 | | | $ | 1,237 | | | $ | 1,037 | | | $ | 7,520 | |
Goodwill resulting from business combinations (1) | | 526 | | | 6,861 | | | 235 | | | 33 | | | 7,655 | |
| | | | | | | | | | |
| Foreign currency translation | | (10) | | | (529) | | | (92) | | | 57 | | | (574) | |
| Balance as of December 31, 2024 | | $ | 5,059 | | | $ | 7,035 | | | $ | 1,380 | | | $ | 1,127 | | | $ | 14,601 | |
(1) See Note 19 - Acquisitions for additional information.
(2) See Note 20 - Divestitures for additional information.
Indefinite-lived intangible assets are tested and reviewed annually for impairment on July 1 or whenever there is a material change in events or circumstances that indicates that the fair value of the asset may be less than the carrying amount of the asset. Intangible assets with finite useful lives are amortized over their estimated useful lives.
Identifiable intangible assets consisted of the following:
| | | | | | | | | | | | | | | | | | | | | | | | | | | | | | | | | | | | | | | |
| | | 2024 | | 2023 |
| (In millions) | | | Gross Amount | | Accumulated Amortization | | Net Amount | | Gross Amount | | Accumulated Amortization | | Net Amount |
| | | | | | | | | | | | | |
| Customer relationships | | | $ | 5,607 | | | $ | (939) | | | $ | 4,668 | | | $ | 1,056 | | | $ | (445) | | | $ | 611 | |
| Patents and trademarks | | | 885 | | | (147) | | | 738 | | | 255 | | | (96) | | | 159 | |
| | | | | | | | | | | | | |
| Service portfolios and other | | | 1,530 | | | (504) | | | 1,026 | | | 431 | | | (256) | | | 175 | |
| | | | | | | | | | | | | |
| | | | | | | | | | | | | |
| | | | | | | | | | | | | |
Total intangible assets (1) | | | $ | 8,022 | | | $ | (1,590) | | | $ | 6,432 | | | $ | 1,742 | | | $ | (797) | | | $ | 945 | |
(1) Indefinite-lived intangible assets were sold as part of the CRF Business divestiture.
Amortization of intangible assets was $843 million, $221 million and $104 million for the years ended December 31, 2024, 2023 and 2022, respectively.
The estimated future amortization of intangible assets is as follows:
| | | | | | | | | | | | | | | | | | | | | | | | | | | | | | | | | | | |
| (In millions) | 2025 | | 2026 | | 2027 | | 2028 | | 2029 | | Thereafter |
| Future amortization | $ | 819 | | | $ | 779 | | | $ | 731 | | | $ | 660 | | | $ | 581 | | | $ | 2,862 | |
Annual Impairment Assessment
The Company tested its goodwill and indefinite-lived intangible assets for impairment on July 1 as part of its annual assessment. For each test except one, the Company qualitatively assessed all relevant events or circumstances that could impact the estimate of fair value and determined it was more likely than not that the fair value of each reporting unit and indefinite-lived intangible assets exceeded their carrying amount. For the remaining test, the Company performed a quantitative goodwill impairment test to determine if any impairment existed. The test did not indicate any goodwill impairment.
NOTE 7: BORROWINGS AND LINES OF CREDIT
Long-term debt consisted of the following:
| | | | | | | | | | | | | | |
| | | | |
| (In millions) | | 2024 | | 2023 |
2.242% Notes due 2025 (1) | | 1,200 | | | 1,200 | |
4.375% Notes due 2025 | | — | | | 830 | |
5.800% Notes due 2025 | | — | | | 1,000 | |
2.493% Notes due 2027 | | 900 | | | 900 | |
4.125% Notes due 2028 | | 783 | | | 830 | |
2.722% Notes due 2030 | | 2,000 | | | 2,000 | |
2.700% Notes due 2031 | | 750 | | | 750 | |
4.500% Notes due 2032 | | 887 | | | 941 | |
5.900% Notes due 2034 | | 875 | | | 1,000 | |
3.625% Notes due 2037 | | 783 | | | — | |
3.377% Notes due 2040 | | 1,500 | | | 1,500 | |
3.577% Notes due 2050 | | 1,400 | | | 2,000 | |
6.200% Notes due 2054 | | 650 | | | 1,000 | |
| Total long-term notes | | 11,728 | | | 13,951 | |
| Japanese Term Loan Facility | | 342 | | | 379 | |
| Other debt (including project financing obligations and finance leases) | | 296 | | | 74 | |
| Discounts and debt issuance costs | | (88) | | | (111) | |
| Total debt | | 12,278 | | | 14,293 | |
| Less: current portion of long-term debt | | 1,252 | | | 51 | |
| Long-term debt, net of current portion | | $ | 11,026 | | | $ | 14,242 | |
(1) 2.242% Notes due February 15, 2025; reclassified to Current portion of long-term debt.
Acquisition Funding
On January 2, 2024, the Company completed the acquisition of the VCS Business for total consideration of $14.2 billion. Under the terms of the Agreement, 20% of the purchase price was paid in Carrier common stock, issued directly to Viessmann and subject to certain lock up provisions and 80% was paid in cash, subject to working capital and other adjustments. In order to fund the Euro-denominated cash portion of the purchase price, the Company used cash on hand, debt financing and various term loan facilities.
Debt Issuance
In November 2023, the Company issued $3.0 billion principal amount of USD-denominated notes in three tranches. The tranches consisted of $1.0 billion aggregate principal amount of 5.80% notes due 2025, $1.0 billion aggregate principal amount of 5.90% notes due 2034 and $1.0 billion aggregate principal amount of 6.20% notes due 2054 (collectively, the “USD Notes”). In addition, the Company issued €2.35 billion principal amount of Euro-denominated notes in three tranches. The tranches consisted of €750 million aggregate principal amount of 4.375% notes due 2025, €750 million aggregate principal amount of 4.125% notes due 2028 and €850 million aggregate principal amount of 4.50% notes due 2032 (collectively, the “Euro Notes”). The notes are subject to certain customary covenants and the Company has the option to redeem the notes in whole or in part at any time prior to their stated maturity date at the redemption price set forth in the indenture agreements. The Company capitalized $51 million of deferred financing costs which are being amortized over the term of their related notes. In June 2024, the Company redeemed the $1.0 billion aggregate principal amount of 5.80% notes due in 2025 and incurred a $8 million make-whole premium upon prepayment and wrote off $4 million of related unamortized debt financing costs.
In November 2024, the Company issued €750 million aggregate principal amount of 3.625% Euro-denominated notes due 2037. The notes are subject to certain customary covenants and the Company has the option to redeem the notes in whole or in part at any time, prior to their stated maturity date at the redemption price set forth in the indenture agreement. The Company capitalized $11 million of deferred financing costs which are being amortized over the term of the notes. The Company used the net proceeds, together with cash on hand, to redeem its €750 million aggregate principal amount of outstanding 4.375% Euro-denominated notes due 2025 and to pay fees and expenses in connection with the new offering. The Company incurred a $6 million make-whole premium upon prepayment and wrote off $2 million of related unamortized debt financing costs.
Bridge Loan
On April 25, 2023, the Company entered into commitment letters with JPMorgan Chase Bank, N.A., BofA Securities, Inc. and Bank of America, N.A. to provide a €8.2 billion aggregate principal, senior unsecured bridge term loan facility (the “Bridge Loan”). Euro-denominated borrowings bore interest at the EURIBOR Rate plus a ratings-based margin, USD-denominated borrowings bore interest at either a Term SOFR Rate plus 0.10% and a ratings-based margin or, alternatively, at a base rate plus a ratings-based margin. The Company capitalized $48 million of deferred financing costs associated with the Bridge Loan which were amortized over the commitment period. Upon entering into a senior unsecured delayed draw term loan facility and issuing the USD Notes and the Euro Notes, the Company reduced the Bridge Loan by €7.7 billion and accelerated the amortization on $25 million of deferred financing costs in Interest expense during 2023. On January 2, 2024, the Company entered into a 60-day senior unsecured term loan agreement consisting of a Euro-denominated tranche in an aggregate amount of €113 million and a USD-denominated tranche in an aggregate amount of $349 million (the “60-day Loan”). Upon entering into the 60-day Loan, the Company reduced the final portion of the Bridge Loan by €500 million and subsequently terminated the agreement. Borrowings under the 60-day Loan were repaid in March 2024.
Delayed Draw Facility
On May 19, 2023, the Company entered into a senior unsecured delayed draw term loan credit agreement with JPMorgan Chase Bank, N.A., as administrative agent and certain other lenders that permitted aggregate borrowings of up to €2.3 billion (the "Delayed Draw Facility"). The facility consisted of an 18-month, Euro-denominated tranche in an aggregate amount of €1.15 billion and a 3-year, Euro-denominated tranche in an aggregate amount of €1.15 billion. Euro-denominated borrowings bear interest at the EURIBOR Rate plus a ratings-based margin, USD-denominated borrowings bear interest at either a Term SOFR Rate plus 0.10% and a ratings-based margin or, alternatively, at a base rate plus a ratings-based margin. The Company capitalized $4 million of deferred financing costs which will be amortized over the respective term of the tranches. On January 2, 2024, the Company borrowed the full amount available under the Delayed Draw Facility in U.S. Dollars. Borrowings under the Delayed Draw Facility were repaid in June 2024 and the facility was subsequently terminated.
364-Day Revolver
On May 17, 2024, the Company entered into a 364-day, $500 million, senior unsecured revolving credit agreement with JPMorgan Chase Bank, N.A., as administrative agent and certain other lenders (the “364-day Revolver”). Borrowings are available in U.S. Dollars and Euros. USD-denominated borrowings bear interest at either a Term SOFR Rate plus 0.10% and a ratings-based margin or, alternatively, at a base rate plus a ratings-based margin, Euro-denominated borrowings bear interest at the Adjusted EURIBOR Rate plus a ratings-based margin. Upon entering into the 364-day Revolver, the Company terminated its existing $500 million senior unsecured revolving credit agreement that was set to mature in May 2024. In December 2024, the Company terminated the 364-day Revolver as part of a transaction to refinance and replace prior credit agreements.
Japanese Term Loan Facility
On July 15, 2022, the Company entered into a five-year, JPY 54 billion (approximately $400 million) senior unsecured term loan facility with MUFG Bank Ltd., as administrative agent and lender, and certain other lenders (the "Japanese Term Loan Facility"). Borrowings under the Japanese Term Loan Facility bear interest at a rate equal to the Tokyo Term Risk Free Rate plus 0.75%. In addition, the Japanese Term Loan Facility is subject to customary covenants including a covenant to maintain a maximum consolidated leverage ratio. The Company capitalized $2 million of deferred financing costs which are being amortized over the term of the facility. On July 25, 2022, the Company borrowed JPY 54 billion under the Japanese Term Loan Facility and used the proceeds to fund a portion of the TCC acquisition and to pay related fees and expenses.
Revolving Credit Facility
On December 20, 2024, the Company entered into a revolving credit agreement with JPMorgan Chase Bank, N.A., as administrative agent, and certain other lenders, permitting aggregate borrowings of up to $2.5 billion pursuant to an unsecured, unsubordinated revolving credit facility that matures in December 2029 (the "Revolving Credit Facility"). The Revolving Credit Facility supports the Company's commercial paper program and can be used for other general corporate purposes. Borrowings are available in U.S. Dollars and Euros. U.S. Dollar borrowings can bear interest at either a Term SOFR Rate plus 0.10% and a ratings-based margin or, alternatively, at an alternate base rate plus a ratings-based margin. Euro borrowings bear interest at an adjusted EURIBOR rate plus a ratings-based margin. A ratings-based commitment fee is charged on unused commitments. Upon entering into the agreement, the Company terminated its existing $2.0 billion revolving credit facility that was set to mature in May 2028 as part of a transaction to refinance and replace prior credit agreements. In addition, the Company capitalized $11 million of deferred financing costs which are being amortized over the term of the facility. As of December 31, 2024, there were no borrowings outstanding under the Revolving Credit Facility.
Commercial Paper Program
The Company has a $2.0 billion unsecured, unsubordinated commercial paper program, which can be used for general corporate purposes, including the funding of working capital and potential acquisitions. As of December 31, 2024, there were no borrowings outstanding under the commercial paper program.
Project Financing Arrangements
The Company is involved in long-term construction contracts in which it arranges project financing with certain customers. As a result, the Company issued $53 million and $39 million of debt during the year ended December 31, 2024 and 2023, respectively. Long-term debt repayments associated with these financing arrangements for the years ended December 31, 2024 and 2023, were $14 million and $111 million, respectively.
Debt Covenants
The Revolving Credit Facility, the indenture for the long-term notes and the Japanese Term Loan Facility contain affirmative and negative covenants customary for financings of these types, which, among other things, limit the Company's ability to incur additional liens, to make certain fundamental changes and to enter into sale and leaseback transactions. As of December 31, 2024, the Company was in compliance with the covenants under the agreements governing its outstanding indebtedness.
Tender Offers
In July 2024, the Company commenced tender offers to purchase up to $800 million ("Aggregate Tender Cap") aggregate purchase price of certain tranches of the Company's notes. The tender offers included payment of applicable accrued and unpaid interest up to the settlement date, along with a fixed spread for early repayment. Based on several factors, the Company elected to increase the Aggregate Tender Cap and settle the tender offers early. The aggregate principal amount tendered and accepted was approximately $1.1 billion, which included $125 million of notes due 2034, $350 million of notes due 2054 and approximately $600 million of notes due 2050. Upon settlement, the Company recognized a net gain of $97 million and wrote off $11 million of unamortized deferred financing costs within Interest (expense) income, net on the accompanying Consolidated Statement of Operations.
Schedule of Long-term Debt Maturities
Scheduled maturities of long-term debt, excluding amortization of discount, are as follows:
| | | | | | | | |
| (In millions) | | |
| 2025 | | $ | 1,252 | |
| 2026 | | $ | 70 | |
| 2027 | | $ | 1,284 | |
| 2028 | | $ | 803 | |
| 2029 | | $ | 19 | |
| Thereafter | | $ | 8,938 | |
As of December 31, 2024, the average maturity of the Company's long-term notes is approximately 10 years and the weighted-average interest rate on its total borrowings is approximately 3.5%. Interest expense associated with long-term debt for the years ended December 31, 2024, 2023 and 2022 was $580 million, $306 million and $238 million, respectively.
NOTE 8: FAIR VALUE MEASUREMENTS
ASC 820, Fair Value Measurement ("ASC 820"), defines fair value as the price that would be received if an asset is sold or the price paid to transfer a liability in an orderly transaction between market participants at the measurement date. ASC 820 also establishes a three-level fair value hierarchy that prioritizes information used in developing assumptions when pricing an asset or liability as follows:
•Level 1: Observable inputs such as quoted prices in active markets;
•Level 2: Inputs, other than quoted prices in active markets, that are observable either directly or indirectly; and
•Level 3: Unobservable inputs where there is little or no market data, which requires the reporting entity to develop its own assumptions.
ASC 820 requires the use of observable market data, when available, in making fair value measurements. When inputs used to measure fair value fall within different levels of the hierarchy, the level within which the fair value measurement is categorized is based on the lowest level input that is significant to the fair value measurement.
In the normal course of business, the Company is exposed to certain risks arising from business operations and economic factors, including foreign currency and commodity price risk. These exposures are managed through operational strategies and the use of undesignated hedging contracts. The Company's derivative assets and liabilities are measured at fair value on a recurring basis using internal models based on observable market inputs, such as forward, interest, contract and discount rates with changes in fair value reported in Other income (expense), net in the accompanying Consolidated Statement of Operations.
In connection with the TCC acquisition, the Company funded a portion of the Yen-denominated purchase price with cash on hand by entering into cross currency swaps with various financial institutions. The cross currency swaps are measured at fair value on a recurring basis using observable market inputs, such as forward, discount and interest rates as well as credit default swap spreads. The Company designated the cross currency swaps as a partial hedge of its investment in certain subsidiaries whose functional currency is the Japanese Yen in order to manage foreign currency translation risk. As a result, changes in the fair value of the swaps are recorded in Equity in the accompanying Consolidated Balance Sheet.
The remaining portion of the Yen-denominated purchase price was funded by the Japanese Term Loan Facility. The carrying value of the facility is translated on a recurring basis using the exchange rate at the end of the applicable period and approximates its fair value. The Company designated the Japanese Term Loan Facility as a partial hedge of its investment in certain subsidiaries whose functional currency is the Japanese Yen in order to manage foreign currency translation risk. As a result, changes in the carrying value of the Japanese Term Loan Facility associated with foreign exchange rate movements are recorded in Equity in the Consolidated Balance Sheet.
In connection with the acquisition of the VCS Business, the Company entered into window forward contracts with Bank of America N.A. and JPMorgan Chase Bank N.A. to mitigate the foreign currency risk of the expected cash outflows associated with the Euro-denominated purchase price. The instruments have an aggregate notional amount of €7 billion and are measured at fair value on a recurring basis using observable market inputs, such as forward, discount and interest rates with changes in fair value reported in Other income (expense), net in the accompanying Consolidated Statement of Operations. During the year ended December 31, 2023, the Company recognized a $96 million loss on the mark-to-market valuation of its window forward contracts. The Company settled the window forward contracts on January 2, 2024, upon the acquisition of the VCS Business and recognized an additional $86 million loss.
During 2023, the Company entered into several interest rate swap contracts to mitigate interest rate exposure on the forecasted issuance of long-term debt. The contracts had an aggregate notional amount of $1.5 billion and were designated as cash flow hedges with changes in fair value reported in Equity in the accompanying Consolidated Balance Sheet. Fair value was measured on a recurring basis using observable market inputs, such as forward, discount and interest rates. In November 2023, the contracts were settled upon the issuance of the underlying debt. As a result, the Company deferred a net unrecognized gain of $58 million in Equity which will be subsequently recognized in Interest expense over the term of the related notes which range from 2034 to 2044. The amount expected to be amortized during 2025 is a net gain of $4 million.
During 2024, the Company entered into cross currency swaps with Barclays Bank PLC as syndication swap arranger in order to manage foreign currency translation risk on Euro-denominated assets. The swaps have an aggregate notional amount of $2.0 billion and are measured at fair value on a recurring basis using observable market inputs, such as forward, discount and interest rates. The Company designated the cross currency swaps as a partial hedge of its investment in certain subsidiaries whose functional currency is the Euro. As a result, changes in the fair value of the swaps are recorded in Equity in the accompanying Consolidated Balance Sheet.
The following tables provide the valuation hierarchy classification of assets and liabilities that are recorded at fair value and measured on a recurring basis in the accompanying Consolidated Balance Sheet:
| | | | | | | | | | | | | | | | | | | | | | | | | | |
| (In millions) | | Total | | Level 1 | | Level 2 | | Level 3 |
| December 31, 2024 | | | | | | | | |
| Fair value measurement: | | | | | | | | |
| | | | | | | | |
Derivative assets (1)(3) | | $ | 82 | | | $ | — | | | $ | 82 | | | $ | — | |
Derivative liabilities (2)(3) | | $ | (41) | | | $ | — | | | $ | (41) | | | $ | — | |
| | | | | | | | |
| December 31, 2023 | | | | | | | | |
| Fair value measurement: | | | | | | | | |
Derivative assets (1) (3) | | $ | 32 | | | $ | — | | | $ | 32 | | | $ | — | |
Derivative liabilities (2)(3) | | $ | (126) | | | $ | — | | | $ | (126) | | | $ | — | |
(1) Included in Other assets, current and Other assets on the accompanying Consolidated Balance Sheet.
(2) Included in Accrued liabilities and Other long-tern liabilities on the accompanying Consolidated Balance Sheet.
(3) Includes cross currency swaps and window forward contracts (which were settled on January 2, 2024).
The following table provides the carrying amounts and fair values of the Company's long-term notes that are not recorded at fair value in the accompanying Consolidated Balance Sheet:
| | | | | | | | | | | | | | | | | | | | | | | | | | |
| | 2024 | | 2023 |
| (In millions) | | Carrying
Amount | | Fair
Value | | Carrying
Amount | | Fair
Value |
Total long-term notes (1) | | $ | 11,728 | | | $ | 10,798 | | | $ | 13,951 | | | $ | 13,194 | |
| | | | | | | | |
(1) Excludes debt discount and issuance costs.
The fair value of the Company's long-term debt is measured based on observable market inputs which are considered Level 1 within the fair value hierarchy. The carrying value of cash and cash equivalents, accounts receivable, accounts payable and short-term borrowings approximate fair value due to the short-term nature of these accounts and would be classified as Level 1 in the fair value hierarchy. The Company's financing leases and project financing obligations, included in Long-term debt and Current portion of long-term debt on the accompanying Consolidated Balance Sheet, approximate fair value and are classified as Level 3 in the fair value hierarchy.
NOTE 9: LEASES
The Company enters into operating and finance leases for the use of real estate, vehicles, information technology equipment and certain other equipment. At contract inception, the Company determines a lease exists if the arrangement conveys the right to control an identified asset for a period of time in exchange for consideration. Control is considered to exist when the lessee has the right to obtain substantially all of the economic benefits from the use of an identified asset as well as the right to direct the use of that asset. If a contract is considered to be a lease, the Company recognizes a lease liability based on the present value of the future lease payments with an offsetting entry to recognize a right-of-use asset.
Operating lease right-of-use assets and liabilities are reflected on the Consolidated Balance Sheet as follows:
| | | | | | | | | | | | | | |
| (In millions) | | 2024 | | 2023 |
| Operating lease right-of-use assets | | $ | 554 | | | $ | 421 | |
| | | | |
| Accrued liabilities | | $ | (135) | | | $ | (93) | |
| Operating lease liabilities | | (432) | | | (333) | |
| Total operating lease liabilities | | $ | (567) | | | $ | (426) | |
| | | | |
| Weighted-Average Remaining Lease Term (in years) | | 6.8 | | 7.0 |
| Weighted-Average Discount Rate | | 4.5 | % | | 3.9 | % |
Where applicable, the Company accounts for each separate lease component of a contract and its associated non-lease component as a single lease component.
Supplemental cash flow and lease expense information related to operating leases were as follows:
| | | | | | | | | | | | | | | | | | | | |
| (In millions) | | 2024 | | 2023 | | 2022 |
| | | | | | |
| Operating cash flows for measurement of operating lease liabilities | | $ | 173 | | | $ | 135 | | | $ | 119 | |
| Operating lease ROU assets obtained in exchange for operating lease obligations | | $ | 112 | | | $ | 50 | | | $ | 91 | |
| | | | | | |
| Operating lease expense | | $ | 175 | | | $ | 127 | | | $ | 121 | |
| | | | | | |
| | | | | | |
| | | | | | |
| | | | | | |
| | | | | | |
| | | | | | |
Operating lease expense is recognized on a straight-line basis over the lease term. In addition, the Company has certain leases that contain variable lease payments which are based on an index, a rate referenced in the lease or on the actual usage of the leased asset. These payments are not included in the right-of-use asset or lease liability and are expensed as incurred as variable lease expense.
Undiscounted maturities of operating lease liabilities as of December 31, 2024, are as follows:
| | | | | | | | |
| (In millions) | | |
| 2025 | | $ | 154 | |
| 2026 | | 128 | |
| 2027 | | 93 | |
| 2028 | | 68 | |
| 2029 | | 48 | |
| Thereafter | | 169 | |
| Total undiscounted lease payments | | 660 | |
| Less: imputed interest | | (93) | |
| Total discounted lease payments | | $ | 567 | |
| | |
NOTE 10: EMPLOYEE BENEFIT PLANS
The Company sponsors U.S. and international defined benefit pension and defined contribution plans. In addition, the Company contributes to various U.S. and international multi-employer defined benefit pension plans.
Pension Plans
Qualified U.S. pension plan benefits covering collectively bargained employees comprise approximately 35% of the projected benefit obligation. This noncontributory defined benefit plan provides benefits on a flat dollar formula based on an employee's location and is closed to new entrants. The non-U.S. plans comprise approximately 65% of the projected benefit obligation; certain of these plans provide participants with one-time payments upon separation of employment rather than a retirement annuity. The plans' benefits are based on plan specific parameters. Non-qualified U.S. pension plans provide supplementary retirement benefits to certain employees and are not a material component of the projected benefit obligation.
The following table details information regarding the Company's pension plans:
| | | | | | | | | | | |
| (In millions) | 2024 | | 2023 |
| Change in Benefit Obligation | | | |
| Benefit obligation at beginning of year | $ | 575 | | | $ | 760 | |
| Service cost | 14 | | | 15 | |
| Interest cost | 26 | | | 31 | |
| | | |
| | | |
| Actuarial (gain) loss | (9) | | | 27 | |
| Benefits paid | (24) | | | (25) | |
| | | |
| Curtailment, settlements and special termination benefits | (13) | | | (24) | |
| | | |
| Other, including expenses paid | (25) | | | 3 | |
Reclassified to held for sale (1) | — | | | (212) | |
Acquisitions (2) | 113 | | | — | |
| Benefit obligation at end of year | $ | 657 | | | $ | 575 | |
| | | |
| | | |
| Change in Plan Assets | | | |
| Fair value at beginning of year | $ | 468 | | | $ | 451 | |
| Actual return on plan assets | 1 | | | 39 | |
| Company contributions | 34 | | | 33 | |
| | | |
| Benefits paid | (24) | | | (25) | |
| | | |
| Settlements | (13) | | | (24) | |
| | | |
| Other, including expenses paid | (15) | | | 2 | |
Reclassified to held for sale (1) | — | | | (8) | |
Acquisitions (2) | 56 | | | — | |
| Fair value of assets end of year | $ | 507 | | | $ | 468 | |
| | | |
| | | |
| | | |
| | | |
| | | | | | | | | | | |
| Funded status of plans | $ | (150) | | | $ | (107) | |
| | | |
| Amounts included in the balance sheet: | | | |
| Other non-current assets | $ | 43 | | | $ | 32 | |
| Accrued compensation and benefits | (13) | | | (12) | |
| Post-employment and other benefit liabilities | (180) | | | (127) | |
| Net amount recognized | $ | (150) | | | $ | (107) | |
(1) See Note 20 - Divestitures for additional information.
(2) See Note 19 - Acquisitions for additional information.
The decrease in funded status was primarily driven by the acquisition of the VCS Business on January 2, 2024. However, the decrease was partially offset by the increase in discount rates over the measurement period which resulted in lower benefit obligations.
The pretax amounts recognized in Accumulated other comprehensive (income) loss are:
| | | | | | | | | | | | | | | | | | | | |
| (In millions) | | Prior Service Cost (Benefit) | | Net Actuarial (Gain) Loss | | Total |
| As of December 31, 2023 | | $ | 6 | | | $ | 120 | | | $ | 126 | |
| Current year changes recorded in AOCI | | — | | | 27 | | | 27 | |
| Amortization reclassified to earnings | | (1) | | | (1) | | | (2) | |
| Prior Service Cost or (Credit) Occurring During Fiscal Year | | (1) | | | — | | | (1) | |
| Settlement/curtailment reclassified to earnings | | — | | | (3) | | | (3) | |
| Currency translation and other | | — | | | (3) | | | (3) | |
| Divestitures | | — | | | (10) | | | (10) | |
| As of December 31, 2024 | | $ | 4 | | | $ | 130 | | | $ | 134 | |
Information for pension plans with accumulated benefit obligations in excess of plan assets:
| | | | | | | | | | | |
| (In millions) | 2024 | | 2023 |
| Projected benefit obligation | $ | 481 | | | $ | 378 | |
| Accumulated benefit obligation | $ | 456 | | | $ | 362 | |
| Fair value of plan assets | $ | 288 | | | $ | 239 | |
Information for pension plans with projected benefit obligations in excess of plan assets:
| | | | | | | | | | | |
| (In millions) | 2024 | | 2023 |
| Projected benefit obligation | $ | 481 | | | $ | 378 | |
| Accumulated benefit obligation | $ | 456 | | | $ | 362 | |
| Fair value of plan assets | $ | 288 | | | $ | 239 | |
The accumulated benefit obligation for all defined benefit plans was $0.6 billion and $0.6 billion as of December 31, 2024 and 2023, respectively.
Pension benefit payments, including amounts to be paid from corporate assets, and reflecting expected future service, as appropriate, are expected to be paid as follows:
| | | | | |
| (In millions) | |
| 2025 | $ | 37 | |
| 2026 | $ | 38 | |
| 2027 | $ | 47 | |
| 2028 | $ | 45 | |
| 2029 | $ | 46 | |
| 2030 through 2034 | $ | 242 | |
For the years ended December 31, 2024, 2023 and 2022, the Company made $34 million, $33 million and $16 million, respectively, of cash contributions to its defined benefit pension plans. The Company expects to make total contributions of approximately $6 million to its defined benefit pension plans in 2025.
The components of net periodic pension expense (benefit) for the defined benefit pension plans are as follows:
| | | | | | | | | | | | | | | | | | | | | |
| (In millions) | 2024 | | 2023 | | 2022 | | | | |
| Service cost | $ | 14 | | | $ | 15 | | | $ | 20 | | | | | |
| Interest cost | 26 | | | 31 | | | 18 | | | | | |
| Expected return on plan assets | (36) | | | (32) | | | (27) | | | | | |
| Amortization of prior service cost | 1 | | | 3 | | | 2 | | | | | |
| Recognized actuarial net loss | 1 | | | (2) | | | 9 | | | | | |
| Net settlement, curtailment and special termination benefit loss | 4 | | | 1 | | | 2 | | | | | |
| Net periodic pension expense (benefit) | $ | 10 | | | $ | 16 | | | $ | 24 | | | | | |
| | | | | | | | | |
| Amounts recorded in continuing operations | $ | 10 | | | $ | 16 | | | $ | 24 | | | | | |
| Amounts recorded in discontinued operations | — | | | — | | | — | | | | | |
| Net periodic pension expense (benefit) | $ | 10 | | | $ | 16 | | | $ | 24 | | | | | |
Major assumptions used in determining the benefit obligation and net cost for pension plans are presented in the following table as weighted-averages:
| | | | | | | | | | | | | | | | | | | | | | | | | | | | | | | | | | | |
| | Benefit Obligation | | Net Costs |
| | 2024 | | 2023 | | 2024 | | 2023 | | 2022 | |
| Discount rate | | | | | | | | | | | |
| Projected benefit obligation | 4.3% | | 4.3 | % | | 4.3% | | 4.2 | % | | 2.1 | % | |
Interest cost (1) | | —% | | — | % | | 4.2% | | 4.1 | % | | 1.9 | % | |
Service cost (1) | | —% | | — | % | | 4.5% | | 4.5 | % | | 2.8 | % | |
| Salary scale | | 2.6% | | 2.2 | % | | 2.2% | | 2.4 | % | | 3.1 | % | |
| Expected return on plan assets | —% | | — | % | | 6.3% | | 5.7 | % | | 5.0 | % | |
| | | | | | | | | | | |
(1) The 2024 and 2023 discount rates used to measure the service cost and interest cost applies to the significant plans of the Company. The projected benefit obligation discount rate is used for the service cost and interest cost measurements for non-significant plans.
The expected long-term rate of return on plan assets is determined by considering the relative weighting of plan assets, the historical performance of total plan assets, individual asset classes, economic and other indicators of future performance. Return projections are assessed for reasonableness using a simulation model that incorporates yield curves, credit spreads and risk premiums to project long-term prospective returns.
The Company's investment objective is to provide liquidity and asset levels needed to meet current and future benefit payments, while maintaining a prudent degree of portfolio diversification considering interest rate risk and market volatility. Globally, investment strategies target a mix of approximately 20% of growth seeking assets and 80% of income generating and hedging assets using a wide diversification of asset types, fund strategies and investment managers.
The growth seeking allocation consists of global public equities in developed and emerging countries and alternative asset class strategies. The income generating assets primarily consist of government and broadly diversified high quality corporate bonds. In addition, the Company's investment strategies seek to reduce interest rate risk and have incorporated liability hedging programs as part of the long-term investment strategy. Under this objective, the income generating and hedging assets typically increase as the plans' funded status improves. The Company monitors plan funded status and asset allocation regularly in addition to investment manager performance.
The fair values of pension plan assets by asset category are as follows:
| | | | | | | | | | | | | | | | | | | | | | | | | | | | | | | | |
| (In millions) | | Quoted Prices in Active Markets for Identical Assets | | Significant Observable Inputs | | Significant Unobservable Inputs | | Not Subject
to Leveling | | Total |
| Asset Category | | (Level 1) | | (Level 2) | | (Level 3) | | | | |
| Public Equities: | | | | | | | | | | |
| Global Equities | | $ | — | | | $ | 23 | | | $ | — | | | $ | — | | | $ | 23 | |
| | | | | | | | | | |
| | | | | | | | | | |
Global Equity Funds at net asset value (1) (2) | | — | | | — | | | — | | | 125 | | | 125 | |
| | | | | | | | | | |
| Fixed Income Securities: | | | | | | | | | | |
| Governments | | — | | | 23 | | | — | | | 25 | | | 48 | |
| Corporate Bonds | | — | | | 93 | | | — | | | — | | | 93 | |
Fixed Income Securities (2) | | — | | | — | | | — | | | 156 | | | 156 | |
Real Estate (3) | | — | | | 1 | | | — | | | — | | | 1 | |
Other (4) (5) | | — | | | 15 | | | — | | | 8 | | | 23 | |
Cash & Cash Equivalents (2)(6) | | — | | | 28 | | | — | | | 9 | | | 37 | |
| Subtotal | | $ | — | | | $ | 183 | | | $ | — | | | $ | 323 | | | $ | 506 | |
Other assets and liabilities (7) | | | | | | | | | | 1 | |
Total as of December 31, 2024 | | | | | | | | | | $ | 507 | |
| | | | | | | | | | |
| | | | | | | | | | |
| (In millions) | | Quoted Prices in Active Markets for Identical Assets | | Significant Observable Inputs | | Significant Unobservable Inputs | | Not Subject
to Leveling | | Total |
| Asset Category | | (Level 1) | | (Level 2) | | (Level 3) | | | | |
| Public Equities: | | | | | | | | | | |
| Global Equities | | $ | — | | | $ | 26 | | | $ | — | | | $ | — | | | $ | 26 | |
| | | | | | | | | | |
| | | | | | | | | | |
Global Equity Funds at net asset value (1) (2) | | — | | | — | | | — | | | 125 | | | 125 | |
| | | | | | | | | | |
| Fixed Income Securities: | | | | | | | | | | |
| Governments | | — | | | 40 | | | — | | | 23 | | | 63 | |
| Corporate Bonds | | — | | | 44 | | | — | | | — | | | 44 | |
Fixed Income Securities (2) | | — | | | 9 | | | — | | | 172 | | | 181 | |
Real Estate (3) | | — | | | 1 | | | — | | | — | | | 1 | |
Other (4)(5) | | — | | | 10 | | | — | | | — | | | 10 | |
Cash & Cash Equivalents (2)(6) | | — | | | 13 | | | — | | | 3 | | | 16 | |
| Subtotal | | $ | — | | | $ | 143 | | | $ | — | | | $ | 323 | | | $ | 466 | |
Other assets and liabilities (7) | | | | | | | | | | 2 | |
Total as of December 31, 2023 | | | | | | | | | | $ | 468 | |
| | | | | | | | | | |
| | | | | | | | | | |
| | | | | | | | | | |
| | | | | | | | | | |
(1) Represents commingled funds that invest primarily in common stocks.
(2) In accordance with ASU 2015-07, Fair Value Measurement (Topic 820), certain investments that are measured at fair value using the net asset value per share (or its equivalent) practical expedient have not been classified in the fair value hierarchy. The fair value amounts presented in this table are intended to permit reconciliation of the fair value hierarchy to the amounts presented for the total pension plan assets.
(3) Represents investments in real estate, including commingled funds and directly held properties.
(4) Represents insurance contracts and global balanced risk commingled funds consisting mainly of equity, bonds and some commodities.
(5) Includes fixed income repurchase agreements entered into for purposes of pension asset and liability matching.
(6) Represents short-term commercial paper, bonds and other cash or cash-like instruments.
(7) Represents trust receivables and payables that are not leveled.
Derivatives in the plan are primarily used to manage risk and gain asset class exposure while still maintaining liquidity. Derivative instruments mainly consist of fixed income repurchase agreements, interest rate swaps, total return swaps and currency forward contracts.
Quoted market prices are used to value investments when available. Investments in securities traded on exchanges, including listed futures and options, are valued at the last reported sale prices on the last business day of the year or, if not available, the last reported bid prices. Fixed income securities are primarily measured using a market approach pricing methodology, whereby observable prices are obtained by market transactions involving identical or comparable securities of issuers with similar credit ratings. Over-the-counter securities and government obligations are valued at the bid prices or the average of the bid and ask prices on the last business day of the year from published sources or, if not available, from other sources considered reliable, including broker quotes. Temporary cash investments are stated at cost, which approximates fair value.
Multiemployer Benefit Plans
The Company contributes to various domestic and foreign multiemployer defined benefit pension plans. The risks of participating in these multiemployer plans are different from those of single-employer plans in that assets contributed are pooled and may be used to provide benefits to employees of other participating employers. If a participating employer stops contributing to the plan, the unfunded obligations of the plan may be borne by the remaining participating employers. The Company's contributions to these plans for the years ended December 31, 2024 and 2023, was $15 million and $15 million, respectively.
Employee Savings Plans
The Company sponsors various employee savings plans. Employer contributions are determined based on criteria specific to each plan and were $138 million, $125 million and $123 million for the years ended December 31, 2024, 2023 and 2022, respectively.
NOTE 11: PRODUCT WARRANTIES
In the ordinary course of business, the Company provides standard warranty coverage on its products. Provisions for these amounts are established at the time of sale and estimated primarily based on product warranty terms and historical claims experience. In addition, the Company incurs discretionary costs to service its products in connection with specific product performance issues. Provisions for these amounts are established when they are known and estimable. The Company assesses the adequacy of its initial provisions and will make adjustments as necessary based on known or anticipated claims or as new information becomes available that suggests it is probable that future costs will be different than estimated amounts. Amounts associated with these provisions are classified on the accompanying Consolidated Balance Sheet as Accrued liabilities or Other long-term liabilities based on their anticipated settlement date.
The changes in the carrying amount of warranty related provisions are as follows:
| | | | | | | | | | | |
| (In millions) | 2024 | | 2023 |
| Balance as of January 1, | $ | 568 | | | $ | 544 | |
| Warranties, performance guarantees issued and changes in estimated liability | 327 | | | 239 | |
| Settlements made | (346) | | | (194) | |
| Other | 5 | | | (11) | |
Acquisitions (1) | 232 | | | — | |
Reclassified to held for sale (2) | — | | | (10) | |
| Balance as of December 31, | $ | 786 | | | $ | 568 | |
(1) See Note 19 - Acquisitions for additional information.
(2) See Note 20 - Divestitures for additional information.
NOTE 12: EQUITY
The authorized number of shares of common stock of Carrier is 4,000,000,000 shares of $0.01 par value. As of December 31, 2024 and December 31, 2023, 948,068,772 and 883,068,393 shares of common stock were issued, respectively, which includes 70,093,639 and 43,490,981 shares of treasury stock, respectively.
Share Repurchase Program
The Company may purchase its outstanding common stock from time to time subject to market conditions and at the Company's discretion. Repurchases occur in the open market or through one or more other public or private transactions pursuant to plans complying with Rules 10b5-1 and 10b-18 under the Exchange Act. Shares acquired are recognized at cost and presented separately on the balance sheet as a reduction to Equity. Since the initial authorization in February 2021, the Company's Board of Directors authorized the repurchase of up to $7.1 billion of the Company's outstanding common stock which includes a $3 billion increase approved in October 2024. As of December 31, 2024, the Company repurchased 70.1 million shares of common stock for an aggregate purchase price of $3.9 billion. As a result, the Company has approximately $3.2 billion remaining under the current authorization at December 31, 2024.
Accumulated Other Comprehensive Income (Loss)
A summary of changes in the components of Accumulated other comprehensive income (loss) is as follows:
| | | | | | | | | | | | | | | | | | | | | | | | | | | |
| (In millions) | Foreign Currency Translation | | Defined Benefit Pension and Post-retirement Plans | | | | | | Unrealized Hedging Gains (Losses) | | Accumulated Other Comprehensive Income (Loss) |
| Balance as of January 1, 2022 | $ | (505) | | | $ | (484) | | | | | | | $ | — | | | $ | (989) | |
| Other comprehensive income (loss) before reclassifications, net | (525) | | | 63 | | | | | | | — | | | (462) | |
| Amounts reclassified, pre-tax | — | | | 11 | | | | | | | — | | | 11 | |
| Tax benefit reclassified | — | | | (3) | | | | | | | — | | | (3) | |
| Chubb divestiture | (574) | | | 329 | | | | | | | — | | | (245) | |
| Balance as of December 31, 2022 | $ | (1,604) | | | $ | (84) | | | | | | | $ | — | | | $ | (1,688) | |
| Other comprehensive income (loss) before reclassifications, net | 160 | | | (17) | | | | | | | 58 | | | 201 | |
| Amounts reclassified, pre-tax | — | | | 1 | | | | | | | — | | | 1 | |
| | | | | | | | | | | |
| | | | | | | | | | | |
| Balance as of December 31, 2023 | $ | (1,444) | | | $ | (100) | | | | | | | $ | 58 | | | $ | (1,486) | |
| Other comprehensive income (loss) before reclassifications, net | (1,173) | | | (15) | | | | | | | — | | | (1,188) | |
| Amounts reclassified, pre-tax | — | | | 2 | | | | | | | (6) | | | (4) | |
| Tax benefit reclassified | — | | | (1) | | | | | | | 2 | | | 1 | |
| Divestitures, net | 564 | | | 7 | | | | | | | — | | | 571 | |
| Balance as of December 31, 2024 | $ | (2,053) | | | $ | (107) | | | | | | | $ | 54 | | | $ | (2,106) | |
NOTE 13: REVENUE RECOGNITION
The Company accounts for revenue in accordance with ASC 606: Revenue from Contracts with Customers. Revenue is recognized when control of a good or service promised in a contract (i.e., performance obligation) is transferred to a customer. Control is obtained when a customer has the ability to direct the use of and obtain substantially all of the remaining benefits from that good or service. A significant portion of the Company's performance obligations are recognized at a point-in-time when control of the product transfers to the customer, which is generally the time of shipment. The remaining portion of the Company’s performance obligations are recognized over time as the customer simultaneously obtains control as the Company performs work under a contract, or if the product being produced for the customer has no alternative use and the Company has a contractual right to payment.
Performance Obligations
A performance obligation is a distinct good, service or a bundle of goods and services promised in a contract. Some of the Company's contracts with customers contain a single performance obligation, while others contain multiple performance obligations most commonly when a contract spans multiple phases of a product life-cycle such as production, installation, maintenance and support. The Company identifies performance obligations at the inception of a contract and allocates the transaction price to each distinct performance obligation. Revenue is recognized when or as the performance obligation is satisfied. When there are multiple performance obligations within a contract, the Company allocates the transaction price to each performance obligation based on its relative stand-alone selling price.
The Company primarily generates revenue from the sale of products to customers and recognizes revenue at a point in time when control transfers to the customer. Transfer of control is generally based on the shipping terms of the contract. In addition, the Company recognizes revenue on an over-time basis on installation and service contracts. For over-time performance obligations requiring the installation of equipment, revenue is recognized using costs incurred to date relative to total estimated costs at completion to measure progress. Incurred costs represent work performed, which correspond with and best depict transfer of control to the customer. Contract costs include direct costs such as labor, materials and subcontractors’ costs and where applicable, indirect costs.
External segment sales disaggregated by product and service are as follows:
| | | | | | | | | | | | | | | | | | | | |
| | | |
| (In millions) | | 2024 | | 2023 | | 2022 |
| Sales Type | | | | | | |
| Product | | $ | 9,428 | | | $ | 8,538 | | | $ | 8,237 | |
| Service | | 1,099 | | | 1,077 | | | 916 | |
| Climate Solutions Americas sales | | 10,527 | | | 9,615 | | | 9,153 | |
| | | | | | |
| Product | | 4,652 | | | 1,722 | | | 1,449 | |
| Service | | 332 | | | 215 | | | 182 | |
| Climate Solutions Europe sales | | 4,984 | | | 1,937 | | | 1,631 | |
| | | | | | |
| Product | | 2,849 | | | 3,053 | | | 2,197 | |
| Service | | 651 | | | 528 | | | 424 | |
| Climate Solutions Asia Pacific, Middle East & Africa sales | | 3,500 | | | 3,581 | | | 2,621 | |
| | | | | | |
| Product | | 3,061 | | | 3,352 | | | 3,432 | |
| Service | | 414 | | | 466 | | | 451 | |
| Climate Solutions Transportation sales | | 3,475 | | | 3,818 | | | 3,883 | |
| | | | | | |
| Net sales | | $ | 22,486 | | | $ | 18,951 | | | $ | 17,288 | |
The transaction price allocated to performance obligations reflects the Company’s expectations about the consideration it will be entitled to receive from a customer. The Company includes variable consideration in the estimated transaction price when there is a basis to reasonably estimate the amount and when it is probable that a significant reversal of revenue recognized would not occur when the uncertainty associated with variable consideration is subsequently resolved. In addition, the Company customarily offers its customers incentives to purchase products to ensure an adequate supply of its products in distribution channels. The principal incentive programs provide reimbursements to distributors for offering promotional pricing for products. The Company accounts for estimated incentive payments as a reduction in sales at the time a sale is recognized.
Contract Balances
Total contract assets and liabilities consisted of the following:
| | | | | | | | | | | |
| (In millions) | 2024 | | 2023 |
Contract assets, current (included within Other current assets) | $ | 366 | | | $ | 306 | |
Contract assets, non-current (included within Other assets) | 65 | | | 26 | |
| Total contract assets | 431 | | | 332 | |
| | | |
Contract liabilities, current (included within Accrued liabilities) | (553) | | | (419) | |
Contract liabilities, non-current (included within Other long-term liabilities) | (164) | | | (160) | |
| Total contract liabilities | (717) | | | (579) | |
| Net contract assets (liabilities) | $ | (286) | | | $ | (247) | |
The timing of revenue recognition, billings and cash collections results in contract assets and contract liabilities. Contract assets relate to the conditional right to consideration for any completed performance under a contract when costs are incurred in excess of billings under the percentage-of-completion methodology. Contract liabilities relate to payments received in advance of performance under a contract or when the Company has a right to consideration that is conditioned upon transfer of a good or service to the customer. Contract liabilities are recognized as revenue as (or when) the Company performs under the contract.
The Company recognized revenue of $469 million for the year ended December 31, 2024, that was related to contract liabilities as of January 1, 2024. The Company expects a majority of its contract liabilities at the end of the period to be recognized as revenue over the next 12 months. There were no individually significant customers with sales exceeding 10% of total sales for the years ended December 31, 2024, 2023 and 2022.
NOTE 14: STOCK-BASED COMPENSATION
The Company accounts for stock-based compensation plans in accordance with ASC 718, Compensation - Stock Compensation, which requires a fair-value based method for measuring the value of stock-based compensation. Fair value is measured at the date of grant and is generally not adjusted for subsequent changes. The Company's stock-based compensation plans include programs for stock appreciation rights, restricted stock and performance share units.
Stock Options and Appreciation Rights
Eligible participants may receive stock options or stock appreciation rights as part of the Company's long-term incentive program. The fair value of each instrument is determined as of the date of grant using a binomial lattice model and expensed on a straight-line basis over the required service period, which is generally a three-year vesting period. However, in the event of retirement, awards held for at least one year may vest and become exercisable (if applicable), subject to certain terms and conditions.
The following table summarizes fair value information for stock options and stock appreciation rights:
| | | | | | | | | | | | | | | | | | | | |
| | 2024 (1) | | 2023 (1) | | 2022 (1) |
| Stock options and stock appreciation rights weighted-average fair value per award | | $ | 14.84 | | | $ | 11.64 | | | $ | 10.68 | |
| Assumptions: | | | | | | |
| Volatility | | 30.6% to 31.7% | | 30.9% | | 30.8% to 31.3% |
| | | | | | |
| Expected term (in years) | | 5.6 to 7.8 | | 5.8 | | 6.1 |
| Expected dividend yield | | 1.8% | | 1.8% | | 1.5% |
| Range of risk-free rates | | 4.0% to 4.3% | | 3.6% | | 1.7% to 3.0% |
(1) Carrier has limited historical trading data and used peer group data to estimate expected volatility for the 2024, 2023 and 2022 awards.
The Company used historical employee data, including data prior to the Separation and the Distribution, to estimate expected term. The expected dividend yield is consistent with management's expectations. The risk-free rate is based on the term structure of interest rates at the time the awards were granted.
Changes in stock options and stock appreciation rights outstanding were as follows:
| | | | | | | | | | | | | | | | | | | | | | | |
| Shares Subject to Option
(in thousands) | | Weighted-Average Exercise Price | | Aggregate Intrinsic Value
(in millions) | | Weighted- Average Remaining Life
(in years) |
| As of December 31, 2021 | 32,441 | | | $ | 22.02 | | | | | |
| Granted | 2,715 | | | $ | 47.72 | | | | | |
| Exercised | (3,495) | | | $ | 17.76 | | | | | |
| Cancelled | (883) | | | $ | 30.33 | | | | | |
| As of December 31, 2022 | 30,778 | | | $ | 24.53 | | | | | |
| Granted | 3,494 | | | $ | 46.13 | | | | | |
| Exercised | (8,432) | | | $ | 20.48 | | | | | |
| Cancelled | (769) | | | $ | 42.94 | | | | | |
| As of December 31, 2023 | 25,071 | | | $ | 28.34 | | | | | |
| Granted | 4,187 | | | $ | 56.46 | | | | | |
| Exercised | (8,041) | | | $ | 23.21 | | | | | |
| Cancelled | (430) | | | $ | 50.77 | | | | | |
| Outstanding as of December 31, 2024 | 20,787 | | | $ | 35.52 | | | $ | 681 | | | 5.8 |
| | | | | | | |
| Exercisable as of December 31, 2024 | 12,746 | | | $ | 25.48 | | | $ | 545 | | | 4.1 |
Restricted Stock Units
Eligible participants may receive restricted stock units ("RSU") as part of the Company's long-term incentive program. The fair value of restricted stock units are based on the closing market price of the Company's common stock on the date of grant and expensed on a straight-line basis over the required service period (which is generally a three-year vesting period). However, in the event of retirement, awards held for at least one year may vest and become exercisable (if applicable), subject to certain terms and conditions. Dividends accrue during the vesting period and are paid in shares of the Company's common stock.
Changes in restricted stock units were as follows:
| | | | | | | | | | | |
| RSUs (in thousands) | | Weighted-Average Grant Date Fair Value |
| Outstanding and unvested as of December 31, 2021 | 3,570 | | | $ | 23.33 | |
| Granted | 555 | | | $ | 41.88 | |
| Vested | (1,915) | | | $ | 20.85 | |
| Cancelled | (143) | | | $ | 32.92 | |
| Outstanding and unvested as of December 31, 2022 | 2,067 | | | $ | 29.87 | |
| Granted | 577 | | | $ | 45.71 | |
| Vested | (1,140) | | | $ | 26.09 | |
| Cancelled | (161) | | | $ | 35.09 | |
| Outstanding and unvested as of December 31, 2023 | 1,343 | | | $ | 39.22 | |
| Granted | 264 | | | $ | 59.88 | |
| Vested | (448) | | | $ | 38.17 | |
| Cancelled | (68) | | | $ | 49.14 | |
| Outstanding and unvested as of December 31, 2024 | 1,091 | | | $ | 43.94 | |
Performance Share Units
The Company has a performance share program for key employees whereby awards are provided in the form of performance share units ("PSU") based on performance against pre-established objectives. The annual target level is expressed as shares of the Company's common stock based on the fair value of its stock on the date of grant. Awards are generally earned over a three-year performance period based equally on a performance condition, measured by the compound annual growth rate of the Company's earnings per share and on a market condition, measured by the Company's relative total shareowner return compared to the total shareowner return of a subset of industrial companies in the S&P 500 Index. The fair value of the market condition is estimated using a Monte Carlo simulation approach. The fair value of the PSU awards are expensed over the required service period, which is generally a three-year vesting period. In the event of retirement, performance share units held for at least one year remain eligible to vest based on actual performance relative to pre-established metrics. Dividends do not accrue on the performance share units during the performance period.
Changes in PSUs were as follows:
| | | | | | | | | | | |
| PSUs (in thousands) | | Weighted-Average Grant Date Fair Value |
Outstanding and unvested as of December 31, 2021 | 1,421 | | | $ | 30.75 | |
| Granted | 653 | | | $ | 46.93 | |
| Vested | (5) | | | $ | 41.81 | |
| Forfeited | (139) | | | $ | 35.45 | |
Outstanding and unvested as of December 31, 2022 | 1,930 | | | $ | 35.86 | |
| Granted | 902 | | | $ | 47.93 | |
| Vested | (607) | | | $ | 18.23 | |
| Forfeited | (183) | | | $ | 46.52 | |
Outstanding and unvested as of December 31, 2023 | 2,042 | | | $ | 45.47 | |
| Granted | 1,741 | | | $ | 50.75 | |
| Vested | (1,339) | | | $ | 41.49 | |
| Forfeited | (121) | | | $ | 52.56 | |
Outstanding and unvested as of December 31, 2024 | 2,323 | | | $ | 51.35 | |
Compensation Expense
Stock-based compensation expense, net of estimated forfeitures, is included in Cost of products sold, Selling, general and administrative and Research and development, in the accompanying Consolidated Statement of Operations.
Stock-based compensation cost by award type are as follows:
| | | | | | | | | | | | | | | | | |
| (In millions) | 2024 | | 2023 | | 2022 |
| Equity compensation costs - equity settled | $ | 98 | | | $ | 81 | | | $ | 77 | |
Equity compensation costs - cash settled (1) | 2 | | | 3 | | | (15) | |
| Total stock-based compensation cost | $ | 100 | | | $ | 84 | | | $ | 62 | |
| | | | | |
| Amounts recorded in continuing operations | $ | 87 | | | $ | 74 | | | $ | 53 | |
| Amounts recorded in discontinued operations | 13 | | | 10 | | | 9 | |
| Total stock-based compensation cost | $ | 100 | | | $ | 84 | | | $ | 62 | |
| | | | | |
| Income tax benefit | $ | 13 | | | $ | 11 | | | $ | 9 | |
(1) The cash settled awards are classified as liability awards and are measured at fair value at each balance sheet date.
As of December 31, 2024 and 2023, there were $112 million and $63 million of unrecognized stock-based compensation costs related to non-vested awards granted under the plan, respectively, which will be recognized ratably over the awards weighted-average remaining vesting period of 3 years.
NOTE 15: RESTRUCTURING COSTS
The Company incurs costs associated with restructuring initiatives intended to improve operating performance, profitability and working capital levels. Actions associated with these initiatives may include improving productivity, workforce reductions and the consolidation of facilities. Due to the size, nature and frequency of these discrete plans, they are fundamentally different from the Company’s ongoing productivity initiatives.
The Company recorded net pre-tax restructuring costs for new and ongoing restructuring actions as follows:
| | | | | | | | | | | | | | | | | |
| (In millions) | 2024 | | 2023 | | 2022 |
| Climate Solutions Americas | $ | 9 | | | $ | 11 | | | $ | 2 | |
| Climate Solutions Europe | 70 | | | 10 | | | 5 | |
| Climate Solutions Asia Pacific, Middle East & Africa | 10 | | | 23 | | | 1 | |
| Climate Solutions Transportation | 8 | | | 21 | | | 10 | |
| Total Segment | 97 | | | 65 | | | 18 | |
| Corporate and other | 11 | | | 10 | | | 2 | |
Total restructuring costs (1) | $ | 108 | | | $ | 75 | | | $ | 20 | |
| | | | | |
| Cost of sales | $ | 42 | | | $ | 13 | | | $ | 6 | |
| Selling, general and administrative | 66 | | | 62 | | | 14 | |
| | | | | |
Total restructuring costs (1) | $ | 108 | | | $ | 75 | | | $ | 20 | |
(1) 2024 restructuring costs include period-related charges.
The following table summarizes changes in the restructuring reserve, included in Accrued liabilities on the accompanying Consolidated Balance Sheet:
| | | | | | | | | | | | | | |
| (In millions) | | 2024 | | 2023 |
| Balance as of January 1, | | $ | 41 | | | $ | 21 | |
| Net pre-tax restructuring costs | | 98 | | | 75 | |
Acquisitions (1) | | 8 | | | — | |
| Utilization, foreign exchange and other | | (78) | | | (48) | |
Reclassified to held for sale (2) | | — | | | (7) | |
| Balance as of December 31, | | $ | 69 | | | $ | 41 | |
(1) See Note 19 - Acquisitions for additional information.
(2) See Note 20 - Divestitures for additional information.
As of December 31, 2024, the Company had $69 million accrued for costs associated with its announced restructuring initiatives. The balance relates to cost reduction efforts, primarily severance, across each of the Company's segments. In addition, reserves associated with the Company's planned portfolio transformation were established during the year, all of which are expected to be paid within 12 months.
NOTE 16: OTHER INCOME (EXPENSE), NET
Other income (expense), net consisted of the following:
| | | | | | | | | | | | | | | | | |
| (In millions) | 2024 | | 2023 | | 2022 |
| | | | | |
| | | | | |
| Viessmann-related hedges | (86) | | | (96) | | | — | |
| CCR gain | 318 | | | — | | | — | |
| TMA-related gain | 46 | | | — | | | — | |
| TCC acquisition-related gain | — | | | (8) | | | 705 | |
| Chubb gain | — | | | — | | | 1,105 | |
| Other | 39 | | | (9) | | | 8 | |
| Other income (expense), net | $ | 317 | | | $ | (113) | | | $ | 1,818 | |
Other income (expense), net primarily includes the impact of gains and losses related to the sale of businesses or interests in equity method investments, foreign currency gains and losses on transactions that are denominated in a currency other than the entity's functional currency and hedging-related activities. During the year ended December 31, 2024, the Company completed the sale of CCR and recognized a gain on the sale of $318 million. In addition, the Company recognized a $46 million gain associated with its share of UTC's conclusion of certain income tax matters from their 2017 and 2018 tax audit with the IRS. In connection with the acquisition of the VCS Business, the Company recognized a $86 million loss on the mark-to-market valuation of its window forward contracts associated with the cash outflows of the Euro-denominated purchase price.
During the year ended December 31, 2023, the Company recognized a $96 million loss on the mark-to-market valuation of its window forward contracts associated with the cash outflows of the Euro-denominated purchase price of the VCS Business. During the year ended December 31, 2022, the carrying value of the Company's previously held equity investments in TCC were recognized at fair value at the date of acquisition. As a result, the Company recognized a $697 million non-cash gain associated with the increase in its ownership interest. In addition, the Company completed the Chubb Sale and recognized a gain on the sale of $1.1 billion.
NOTE 17: INCOME TAXES
Income Before Income Taxes
The sources of Income from operations before income taxes are as follows:
| | | | | | | | | | | | | | | | | |
| (In millions) | 2024 | | 2023 | | 2022 |
| United States | $ | 1,948 | | | $ | 1,398 | | | $ | 1,528 | |
| Foreign | 326 | | | 601 | | | 2,295 | |
| Total | $ | 2,274 | | | $ | 1,999 | | | $ | 3,823 | |
Provision for Income Taxes
The income tax expense (benefit) consisted of the following components:
| | | | | | | | | | | | | | | | | |
| (In millions) | 2024 | | 2023 | | 2022 |
| Current: | | | | | |
| United States: | | | | | |
| Federal | $ | 920 | | | $ | 361 | | | $ | 405 | |
| State | 120 | | | 110 | | | 106 | |
| Foreign | 374 | | | 293 | | | 211 | |
| 1,414 | | | 764 | | | 722 | |
| Future: | | | | | |
| United States: | | | | | |
| Federal | (90) | | | (135) | | | (10) | |
| State | (13) | | | (28) | | | (26) | |
| Foreign | (249) | | | (80) | | | (70) | |
| (352) | | | (243) | | | (106) | |
| Income tax expense | $ | 1,062 | | | $ | 521 | | | $ | 616 | |
| | | | | |
| | | | | |
| | | | | |
Reconciliation of Effective Income Tax Rate
The differences between the effective income tax rate and the statutory U.S. federal income tax rate are as follows:
| | | | | | | | | | | | | | | | | | |
| 2024 | | 2023 | | 2022 | |
| Statutory U.S. federal income tax rate | 21.0 | % | | 21.0 | % | | 21.0 | % | |
| State income tax | 2.4 | | | 2.4 | | | 1.4 | | |
| Taxes on international activities | (0.2) | | | 4.9 | | | (0.9) | | |
| CCR divestiture impact | (2.0) | | | — | | | — | | |
| VCS reorganization impact | 28.6 | | | — | | | — | | |
| TCC acquisition impact | — | | | — | | | (4.7) | | |
| | | | | | |
| Other | (3.1) | | | (2.2) | | | (0.7) | | |
| Effective income tax rate | 46.7 | % | | 26.1 | % | | 16.1 | % | |
The effective tax rate for the year ended December 31, 2024 was higher than the Company's statutory U.S. federal income tax rate. The increase was primarily driven by a net tax charge of $650 million related to a re-organization of the VCS Business and a non-deductible loss of $86 million on the mark-to-market valuation of the Company's window forward contracts associated with the expected cash outflows of the Euro-denominated purchase price of the VCS Business, partially offset by the lower effective tax rate on the $318 million gain on the sale of CCR and $44 million of foreign tax credits generated and utilized in the current year.
The effective tax rate for the year ended December 31, 2023 was higher than the Company's statutory U.S. federal income tax rate. The increase was primarily driven by a net tax charge of $27 million relating to the re-organization and disentanglement of the CCR businesses in advance of the planned divestiture. In addition, the effective tax rate was impacted by the recognition of a deferred tax liability for withholding tax of $19 million on repatriated foreign earnings, non-deductible divestiture-related costs and a non-deductible loss of $96 million on the mark-to-market valuation of the Company's window forward contracts associated with the expected cash outflows of the Euro-denominated purchase price of the VCS Business.
The effective tax rate for the year ended December 31, 2022 was lower than the Company's statutory U.S. federal income tax rate. The decrease was driven by a lower effective tax rate on the $705 million non-cash gain resulting from the recognition of the Company's previously held TCC equity investments at fair value upon acquisition of TCC, a lower effective tax rate on the $1.1 billion Chubb gain and $45 million of foreign tax credits generated and utilized in the current year.
Deferred Tax Assets and Liabilities
Future income taxes represent the tax effects of transactions, which are reported in different periods for tax and GAAP purposes. These amounts consist of the tax effects of differences between tax and GAAP that are expected to be reversed in the future and tax carryforwards. Future income tax benefits and obligations within the same tax paying component of a particular jurisdiction are offset for presentation in the Consolidated Balance Sheet.
The tax effects of temporary differences and tax carryforwards which give rise to future income tax benefits and obligations as of December 31, 2024 and 2023, are as follows:
| | | | | | | | | | | |
| (In millions) | 2024 | | 2023 |
| Future income tax benefits: | | | |
| Insurance and employee benefits | $ | 142 | | | $ | 155 | |
| Other assets basis differences | 576 | | | 413 | |
| Other liabilities basis differences | 674 | | | 531 | |
| Tax loss carryforwards | 178 | | | 159 | |
| Tax credit carryforwards | 1,404 | | | 1,332 | |
| Valuation allowances | (1,442) | | | (1,372) | |
| Future income tax benefits | $ | 1,532 | | | $ | 1,218 | |
| | | |
| Future income tax obligations: | | | |
| Goodwill and intangible assets | $ | (1,769) | | | $ | (401) | |
| Other asset basis differences | (381) | | | (389) | |
| Future income tax obligations | $ | (2,150) | | | $ | (790) | |
Valuation allowances have been established primarily for tax credit carryforwards, tax loss carryforwards and certain foreign temporary differences to reduce future income tax benefits to expected realizable amounts.
Changes to valuation allowances consisted of the following:
| | | | | | | | |
| (In millions) | | |
| | |
| Balance as of January 1, 2022 | | $ | 90 | |
| Additions charged to income tax expense | | 18 | |
| Reduction credited to income tax expense | | (22) | |
| Other adjustments | | 14 | |
| Reclassified to held for sale | | (17) | |
| Balance at December 31, 2022 | | $ | 83 | |
| Additions charged to income tax expense | | 27 | |
| Reduction credited to income tax expense | | (22) | |
Other adjustments (1) | | 1,303 | |
| Reclassified to held for sale | | (19) | |
| Balance at December 31, 2023 | | $ | 1,372 | |
| Additions charged to income tax expense | | 46 | |
| Reduction credited to income tax expense | | (41) | |
| Other adjustments | | 65 | |
| | |
| Balance as of December 31, 2024 | | $ | 1,442 | |
| | |
(1) See discussion below regarding the Swiss tax credit.
Tax Credit and Loss Carryforwards
As of December 31, 2024, tax credit carryforwards and tax loss carryforwards were as follows:
| | | | | | | | | | | |
| (In millions) | Tax Loss Carryforwards | | Tax Credit Carryforwards |
| Expiration period: | | | |
| 2025-2029 | $ | 525 | | | $ | 15 | |
| 2030-2034 | 21 | | | 1,375 | |
| 2035-2044 | 77 | | | — | |
| Indefinite | 457 | | | 14 | |
| Total | $ | 1,080 | | | $ | 1,404 | |
The Company assesses the realizability of its deferred tax assets on a quarterly basis through an analysis of potential sources of future taxable income, including prior year taxable income available to absorb a carryback of tax losses, reversals of existing taxable temporary differences, tax planning strategies and forecasts of taxable income. The Company considers all negative and positive evidence, including the weight of the evidence, to determine if valuation allowances against deferred tax assets are required. The Company maintains valuation allowances against certain deferred tax assets.
In conjunction with the announced portfolio transformation, the Company is implementing changes to its corporate structure, including intra-entity transfers of certain intellectual property to a subsidiary in Switzerland. During 2025, the Company will begin transferring certain intellectual property from wholly-owned legal entities to the Swiss subsidiary. During 2023, the Company’s Swiss subsidiary was granted a tax credit of approximately $1.3 billion that is available to offset cantonal income tax liability over a ten-year period. As the Company is in the preliminary stages of the reorganization, a full valuation allowance was recorded against this tax credit. As operations in the Swiss subsidiary expand in future years it will be necessary to reassess the estimated realizable tax benefit associated with the tax credit.
Unrecognized Tax Benefits
As of December 31, 2024, the Company had unrecognized tax benefits of $365 million, all of which, if recognized, would impact its effective tax rate. A reconciliation of the beginning and ending amounts of unrecognized tax benefits and related interest expense is as follows:
| | | | | | | | | | | | | | | | | |
| (In millions) | 2024 | | 2023 | | 2022 |
| Balance at beginning of period | $ | 382 | | | $ | 291 | | | $ | 251 | |
| Additions for tax positions related to the current year | 34 | | | 37 | | | 34 | |
Additions for tax positions of prior years (1) | 30 | | | 81 | | | 32 | |
| Reductions for tax positions of prior years | (7) | | | — | | | (13) | |
| Settlements | (68) | | | (27) | | | (13) | |
| Reclassified to other accounts | (6) | | | — | | | — | |
| Balance at end of period | $ | 365 | | | $ | 382 | | | $ | 291 | |
| Gross interest expense related to unrecognized tax benefits | $ | 19 | | | $ | 18 | | | $ | 16 | |
| Total accrued interest balance at end of period | $ | 57 | | | $ | 64 | | | $ | 48 | |
(1) Includes $73 million during the year ended December 31, 2023, related to acquisitions.
The Company conducts business globally and, as a result, the Company and its subsidiaries file income tax returns in the U.S. federal, various state and foreign jurisdictions. In certain jurisdictions, the Company's operations were included in UTC's combined tax returns for the periods through the date of the Separation and Distribution. The IRS finalized the examination of UTC's tax years 2017 and 2018 resulting in the recognition of a tax benefit of $21 million in the first quarter of 2024. The IRS examination of UTC's tax year 2020, which Carrier was included in through the date of Separation and Distribution, is expected to conclude in 2025. The U.S. Federal statute of limitations for Carrier's tax year ending on December 31, 2020 expired during the three months ended December 31, 2024 resulting in a recognized tax benefit of $8 million. The IRS has begun an examination of Carrier's tax year 2022 with the examination in an early stage. In the normal course of business, the Company is subject to examination by taxing authorities throughout the world, including the U.S., Australia, Belgium, Canada, China, France, Germany, India, Italy, Malaysia, Poland, Singapore, Spain, and the United Kingdom. The Company is no longer subject to U.S. federal income tax examination for years prior to 2020 and, with few exceptions, is no longer subject to U.S. state and local and foreign income tax examinations for tax years before 2013.
In the ordinary course of business, there is inherent uncertainty in quantifying the Company's income tax positions. The Company assesses its income tax positions and records tax benefits for all years subject to examination based upon management’s evaluation of the facts, circumstances and information available at the reporting date. The Company believes that it is reasonably possible that a net decrease in unrecognized tax benefits of $10 million to $40 million may occur within 12 months as a result of additional uncertain tax positions, the revaluation of uncertain tax positions arising from examinations, appeals, court decisions or the closure of tax statutes.
In October 2021, the Organization for Economic Co-operation and Development ("OECD")/G20 finalized the significant components of a two-pillar global tax reform plan, which has now been agreed to by the majority of OECD members. Pillar One allows countries to reallocate amongst other taxing jurisdictions a portion of residual profits earned by multinational enterprises ("MNE"), with annual global revenue exceeding €20 billion and a profit margin over 10%. The adoption of Pillar One and its potential effective date remain uncertain. Pillar Two requires MNEs with annual global revenue exceeding €750 million to pay a global minimum tax of 15%. On January 13, 2025, the OECD published additional administrative guidance on Pillar Two regarding deferred tax accounting for loss carryforwards and tax credits. The Company is evaluating the impact this additional guidance may have on the utilization of the income tax credit generated by the Company's Swiss subsidiary as discussed above.
As a result of the Tax Cuts and Jobs Act ("TCJA"), the Company no longer intends to reinvest certain undistributed earnings of its international subsidiaries including some earnings which have been previously taxed in the U.S. As such, the Company has recorded tax liabilities associated with the future remittance of these earnings. For the remainder of the Company's undistributed international earnings, unless it becomes tax effective to repatriate, the Company intends to continue to permanently reinvest these earnings. As of December 31, 2024, such undistributed earnings were approximately $11.5 billion, excluding other comprehensive income amounts. It is not practicable to estimate the amount of tax that might be payable on the remaining amounts. In addition, the TCJA subjects the Company to a tax on global intangible low-taxed income ("GILTI"). GILTI is a tax on foreign income in excess of a deemed return on tangible assets of foreign corporations which the Company has elected to account for as a period cost.
NOTE 18: EARNINGS PER SHARE
Earnings per share is computed by dividing Net earnings (loss) attributable to common shareowners by the weighted-average number of shares of common stock outstanding during the period (excluding treasury stock). Diluted earnings per share is computed by giving effect to all potentially dilutive stock awards that are outstanding. The computation of diluted earnings per share excludes the effect of the potential exercise of stock-based awards, including stock appreciation rights and stock options, when the effect of the potential exercise would be anti-dilutive.
The following table summarizes the weighted-average number of shares of common stock outstanding for basic and diluted earnings per share calculations:
| | | | | | | | | | | | | | | | | | | | | | |
| (In millions, except per share amounts) | | 2024 | | 2023 | | 2022 | | |
| Net earnings (loss) attributable to common shareowners | | $ | 5,604 | | | $ | 1,349 | | | $ | 3,534 | | | |
| | | | | | | | |
| Basic weighted-average number of shares outstanding | | 898.2 | | | 837.3 | | | 843.4 | | | |
| Stock awards and equity units (share equivalent) | | 13.5 | | | 15.7 | | | 17.8 | | | |
| Diluted weighted-average number of shares outstanding | | 911.7 | | | 853.0 | | | 861.2 | | | |
| | | | | | | | |
| Antidilutive shares excluded from computation of diluted earnings per share | | 0.1 | | | 2.0 | | | 2.9 | | | |
| | | | | | | | |
| | | | | | | | |
| | | | | | | | |
| | | | | | | | |
NOTE 19: ACQUISITIONS
During the year ended December 31, 2024, the Company acquired consolidated and minority-owned businesses. The aggregate cash paid, net of cash acquired, totaled $10.9 billion. Acquisitions are recorded using the acquisition method of accounting in accordance with ASC 805. As a result, the aggregate purchase price has been allocated to assets acquired and liabilities assumed based on the estimate of fair market value of such assets and liabilities at the date of acquisition. The excess purchase price over the estimated fair value of net assets acquired is recognized as goodwill.
Viessmann Climate Solutions
On January 2, 2024, the Company completed the acquisition of the VCS Business from Viessmann for total consideration of $14.2 billion. The purchase price consisted of (i) $11.2 billion in cash and (ii) 58,608,959 shares of the Company's common stock, subject to certain lock-up provisions and anti-dilution protection. The Company funded the cash portion of the purchase price with a combination of cash on hand, net proceeds from the USD Notes and Euro Notes and borrowings under the Delayed Draw Facility and the 60-day Loan.
The VCS Business develops intelligent, integrated and sustainable technologies, including heat pumps, boilers, photovoltaic systems, home battery storage and digital solutions, primarily for residential customers in Europe. The Company believes that secular trends in these areas will drive significant, sustained future growth. In addition, the Company anticipates realizing significant operational synergies including savings through supplier rationalization and leverage, reduced manufacturing costs and lower general and administrative costs. Longer term, the Company expects to benefit from synergies related to service revenue expansion, leverage of distribution channels and cross-selling opportunities.
The components of the purchase price are as follows:
| | | | | | | | |
| (In millions) | | January 2, 2024 |
| Cash | | $ | 11,156 | |
Common shares (58,608,959 shares at $51.20 per share) | | 3,001 | |
| Total consideration | | $ | 14,157 | |
The preliminary allocation of the purchase price is as follows:
| | | | | | | | | | | | | | | | | | | | |
| (In millions) | | Preliminary January 2, 2024 | | Measurement Period Adjustments | | As Adjusted January 2, 2024 |
| Cash and cash equivalents | | $ | 394 | | | $ | (1) | | | $ | 393 | |
| Accounts receivable | | 408 | | | 5 | | | 413 | |
| Inventories | | 948 | | | (28) | | | 920 | |
| Other current assets | | 17 | | | — | | | 17 | |
| Fixed assets | | 913 | | | 6 | | | 919 | |
| Intangible assets | | 6,640 | | | 5 | | | 6,645 | |
| Other assets | | 284 | | | 15 | | | 299 | |
| Accounts payable | | (288) | | | (2) | | | (290) | |
| Other liabilities, current | | (626) | | | (37) | | | (663) | |
| Future income tax obligations | | (1,825) | | | 15 | | | (1,810) | |
| Other liabilities | | (284) | | | (17) | | | (301) | |
| Total identifiable net assets | | 6,581 | | | (39) | | | 6,542 | |
| Goodwill | | 7,576 | | | 31 | | | 7,607 | |
| Total consideration | | $ | 14,157 | | | $ | (8) | | | $ | 14,149 | |
The excess purchase price over the estimated fair value of the net identifiable assets acquired was recognized as goodwill and totaled $7.6 billion, which is not deductible for tax purposes. Accounts receivable and current liabilities were stated at their historical carrying value, which approximates fair value given the short-term nature of these assets and liabilities. The estimate of fair value for inventory and fixed assets was based on an assessment of the acquired assets' condition as well as an evaluation of the current market value of such assets.
The Company recorded intangible assets based on its estimate of fair value which consisted of the following:
| | | | | | | | | | | | | | |
| (In millions) | | Estimated Useful Life (in years) | | Intangible Assets Acquired |
| Customer relationships | | 17 | | $ | 4,787 | |
| Technology | | 10 - 20 | | 1,051 | |
| Trademark | | 40 | | 679 | |
| Backlog | | 1 | | 123 | |
| Other | | 50 | | 5 | |
| Total intangible assets acquired | | | | $ | 6,645 | |
The valuation of intangible assets was determined using an income approach methodology including the multi-period excess earnings method and the relief from royalty method. Key assumptions used in estimating future cash flows included projected short-term revenue growth rates, research and development expenses, EBITDA margins, income tax rates, discount rates, customer attrition rates, royalty rates, contributory asset charge and obsolescence rates among others. The projected future cash flows are discounted to present value using an appropriate discount rate. The Company finalized the process of allocating the purchase price and valuing the acquired assets and liabilities during the year ended December 31, 2024.
The Company incurred $40 million of acquisition-related costs during 2024. During 2023, $80 million of acquisition-related costs were incurred. These acquisition costs are reflected within Selling, general and administrative in the Consolidated Statement of Operations.
The assets, liabilities and results of operations of the VCS Business are consolidated in the accompanying Consolidated Financial Statements as of the date of acquisition and primarily reported within the Company's Climate Solutions Europe segment.
The following table summarizes the results of the VCS Business since the date of acquisition:
| | | | | |
| (In millions) | 2024 |
| Net sales | $ | 3,266 | |
| Net earnings (loss) | (400) | |
| |
| |
The financial results of the VCS Business includes amortization of the step-up to fair value of inventory and backlog as well as intangible amortization totaling $834 million for the year ended December 31, 2024.
Unaudited Pro Forma Financial Information
The following unaudited pro forma financial information is presented to illustrate the estimated effects of the acquisition of the VCS Business as if the business combination had occurred on January 1, 2023:
| | | | | | | | | | | |
| (In millions) | 2024 | | 2023 |
| Net sales | $ | 22,486 | | | $ | 23,342 | |
| Net earnings (loss) | 1,272 | | | 1,163 | |
The pro forma amounts include the historical operating results of the Company and the VCS Business prior to the acquisition, with adjustments directly attributable to the acquisition including amortization of the step-up to fair value of inventory and amortization expense of acquired intangible assets. The unaudited pro forma financial information is not necessarily indicative of the results of operations that actually would have been achieved had the acquisition of the VCS Business been consummated as of the dates indicated, nor is it indicative of any future results. In addition, the unaudited pro forma financial information does not reflect the expected realization of any synergies or cost savings associated with the acquisition.
Toshiba Carrier Corporation
On February 6, 2022, the Company entered into a binding agreement to acquire a majority ownership interest in TCC for $920 million. TCC, a VRF and light commercial HVAC joint venture between Carrier and Toshiba Corporation, designs and manufactures flexible, energy-efficient and high-performance VRF and light commercial HVAC systems as well as commercial products, compressors and heat pumps. The acquisition included all of TCC’s advanced research and development centers and global manufacturing operations, product pipeline and the long-term use of Toshiba’s iconic brand. The acquisition was completed on August 1, 2022 and funded through the Japanese Term Loan Facility and cash on hand. Upon closing, Toshiba Corporation retained a 5% ownership interest in TCC.
The excess purchase price over the estimated fair value of the net assets acquired was recognized as goodwill and totaled $876 million, which is not deductible for tax purposes. Accounts receivable and current liabilities were stated at their historical carrying value, which approximates fair value given the short-term nature of these assets and liabilities. The estimate of fair value for inventory and fixed assets was based on an assessment of the acquired assets' condition as well as an evaluation of the current market value of such assets. The sale agreement included several customary provisions to settle working capital and other transaction-related items as of the date of sale. During 2022, the parties finalized these amounts in accordance with the terms of the sale agreement and the Company paid an additional $41 million to Toshiba Corporation in 2023. In addition, the parties finalized amounts related to pension funding levels during 2023 which resulted in the Company receiving $12 million from Toshiba Corporation.
The Company previously accounted for its minority ownership in TCC under the equity method of accounting. In connection with the transaction, the carrying value of the Company's previously held TCC equity investments were recognized at fair value at the date of acquisition using an income approach methodology. As a result, the Company recognized a $697 million non-cash gain within Other income (expense), net on the accompanying Consolidated Statement of Operations. In addition, the assets, liabilities and results of operations of TCC are consolidated in the accompanying Consolidated Financial Statements as of the date of acquisition and reported primarily within the Company's Climate Solutions Asia Pacific, Middle East & Africa segment. The Company incurred $29 million of acquisition-related costs during 2022 which are included within Selling, general and administrative on the accompanying Consolidated Statement of Operations. The Company has not included pro forma financial information required under ASC 805 as the pro forma impact was not deemed significant.
NOTE 20: DIVESTITURES
Discontinued Operations
In 2023, the Company announced plans to exit its Fire & Security and Commercial Refrigeration businesses over the course of 2024. The announced plan to exit the Fire & Security segment represents a single disposal plan to separately divest multiple businesses over different reporting periods. Upon the CRF Business qualifying as held for sale during the year ended December 31, 2024, the components of the Fire & Security segment in aggregate met the criteria to be presented as discontinued operations in the accompanying Consolidated Statement of Operations and Consolidated Statement of Cash Flows. In addition, the assets and liabilities of the CRF Business have been reclassified to held for sale at December 31, 2023. The results of the CCR business did not meet the criteria to be presented in discontinued operations.
The components of Discontinued operations, net of tax are as follows:
| | | | | | | | | | | | | | | | | |
| (In millions) | 2024 | | 2023 | | 2022 |
| Net sales | $ | 2,323 | | | $ | 3,147 | | | $ | 3,133 | |
| Costs of sales | (1,390) | | | (1,926) | | | (1,966) | |
| Research and development | (86) | | | (124) | | | (123) | |
| Selling, general and administrative | (564) | | | (690) | | | (535) | |
| Other income (expense), net | (584) | | | 26 | | | 22 | |
| Gain (loss) on divestitures and deconsolidation | 5,176 | | | (297) | | | — | |
| Interest (expense) income, net | (41) | | | (51) | | | (62) | |
| Earnings before income taxes | 4,834 | | | 85 | | | 469 | |
| Income tax (expense) benefit | 1,391 | | | (128) | | | (92) | |
| Tax on divestitures and deconsolidation | (1,729) | | | 5 | | | — | |
| Discontinued operations, net of tax | $ | 4,496 | | | $ | (38) | | | $ | 377 | |
Portfolio Transformation
The following table summarizes assets and liabilities classified as held for sale:
| | | | | | | | | | | | | | | | | | | | | | | | | | | | | |
| December 31, 2023 |
| (In millions) | Commercial
Refrigeration | | Access
Solutions | | Industrial
Fire | | Commercial & Residential Fire | | Total |
| Cash and cash equivalents | $ | 131 | | | $ | 6 | | | $ | 20 | | | $ | 163 | | | $ | 320 | |
| Accounts receivable, net | 274 | | | 104 | | | 101 | | | 401 | | | 880 | |
| Inventories, net | 84 | | | 31 | | | 65 | | | 394 | | | 574 | |
| Other assets, current | 113 | | | 5 | | | 46 | | | 25 | | | 189 | |
| Fixed assets, net | 78 | | | 13 | | | 22 | | | 133 | | | 246 | |
| Intangible assets, net | — | | | 53 | | | 2 | | | 83 | | | 138 | |
| Goodwill | 72 | | | 1,498 | | | 439 | | | 469 | | | 2,478 | |
| Operating lease right-of-use assets | 49 | | | 13 | | | 28 | | | 70 | | | 160 | |
| Other assets | 44 | | | 10 | | | 13 | | | 41 | | | 108 | |
| Total assets held for sale | $ | 845 | | | $ | 1,733 | | | $ | 736 | | | $ | 1,779 | | | $ | 5,093 | |
| | | | | | | | | |
| Accounts payable | $ | 129 | | | $ | 20 | | | $ | 39 | | | $ | 259 | | | $ | 447 | |
| Accrued liabilities | 204 | | | 74 | | | 77 | | | 239 | | | 594 | |
| Long-term debt, including current portion | 8 | | | — | | | — | | | — | | | 8 | |
| Future pension and post-retirement obligations | 203 | | | — | | | 1 | | | 6 | | | 210 | |
| Future income tax obligations | 4 | | | 2 | | | 3 | | | 12 | | | 21 | |
| Operating lease liabilities | 40 | | | 11 | | | 23 | | | 58 | | | 132 | |
| Other long-term liabilities | 3 | | | 12 | | | 9 | | | 14 | | | 38 | |
| Total liabilities held for sale | $ | 591 | | | $ | 119 | | | $ | 152 | | | $ | 588 | | | $ | 1,450 | |
On June 2, 2024, the Company completed the sale of Access Solutions for cash proceeds of $5.0 billion. Access Solutions, historically reported in the Company's Fire & Security segment, is a global supplier of physical security and digital access solutions supporting the hospitality, commercial, education and military markets. The Company recognized a net gain on the sale of $1.8 billion, which is included in Discontinued operations, net of tax on the accompanying Consolidated Statement of Operations.
On July 1, 2024, the Company completed the sale of Industrial Fire for cash proceeds of $1.4 billion. Industrial Fire, historically reported in the Company's Fire & Security segment, is a leading manufacturer of a full spectrum of fire detection and suppression solutions and services in critical high-hazard environments, including oil and gas, power generation, marine and offshore facilities, automotive, data centers and aircraft hangars. The Company recognized a net gain on the sale of $319 million, which is included in Discontinued operations, net of tax on the accompanying Consolidated Statement of Operations.
On October 1, 2024, the Company completed the sale of CCR for cash proceeds of $679 million. CCR, historically reported in the Company's Climate Solutions Transportation segment, is a global supplier of turnkey solutions for commercial refrigeration systems and services, with a primary focus on serving food retail customers, cold storage facilities and warehouses. The Company recognized a gross gain on the sale of $318 million, which is included in Other income (expense), net on the accompanying Consolidated Statement of Operations. The net proceeds received are subject to working capital and other adjustments provided in the stock purchase agreement governing the sale of CCR.
On December 2, 2024, the Company completed the sale of the CRF Business for cash proceeds of $2.9 billion. The CRF Business, historically reported in the Company's Fire & Security segment, is a leading manufacturer of fire detection and alarm solutions for both commercial and residential applications. The Company recognized a net gain on the sale of $1.4 billion, which is included in Discontinued operations, net of tax on the accompanying Consolidated Statement of Operations. The net proceeds received are subject to working capital and other adjustments provided in the stock purchase agreement governing the sale of the CRF Business.
The following table summarizes the assets and liabilities divested as of their respective dates of sale:
| | | | | | | | | | | | | | | | | | | | | | | |
| | | | | | | |
| (In millions) | Access
Solutions | | Industrial
Fire | | Commercial Refrigeration | | Commercial & Residential Fire |
| Cash and cash equivalents | $ | 82 | | | $ | 40 | | | $ | 121 | | | $ | 64 | |
| Accounts receivable, net | 90 | | | 93 | | | 217 | | | 422 | |
| Inventories, net | 43 | | | 73 | | | 99 | | | 408 | |
| Other current assets | 6 | | | 55 | | | 155 | | | 26 | |
| Fixed assets, net | 18 | | | 24 | | | 84 | | | 127 | |
| Intangible assets, net | 53 | | | 2 | | | 10 | | | 81 | |
| Goodwill | 1,467 | | | 452 | | | 72 | | | 449 | |
| Operating lease right-of-use assets | 16 | | | 24 | | | 48 | | | 66 | |
| Other assets | 8 | | | 2 | | | 46 | | | 29 | |
| Total assets held for sale | $ | 1,783 | | | $ | 765 | | | $ | 852 | | | $ | 1,672 | |
| | | | | | | |
| Accounts payable | $ | 54 | | | $ | 43 | | | $ | 124 | | | $ | 195 | |
| Accrued liabilities | 80 | | | 65 | | | 154 | | | 153 | |
| Operating lease liabilities | 17 | | | 24 | | | 49 | | | 66 | |
| Other long-term liabilities | 10 | | | 6 | | | 213 | | | 24 | |
| Total liabilities held for sale | $ | 161 | | | $ | 138 | | | $ | 540 | | | $ | 438 | |
NOTE 21: SEGMENT FINANCIAL DATA
The Company conducts its operations through four reportable operating segments. In accordance with ASC 280 - Segment Reporting, the Company's segments maintain separate financial information for which results of operations are evaluated on a regular basis by the Company's CODM in deciding how to allocate resources and in assessing performance.
•Climate Solutions Americas ("CSA") provides products, controls, services and solutions to meet the heating, cooling and ventilation needs of residential and commercial customers in North and South America while enhancing building performance, health, energy efficiency and sustainability.
•Climate Solutions Europe ("CSE") provides products, controls, services and solutions to meet the heating, cooling and ventilation needs of residential and commercial customers in Europe while enhancing building performance, health, energy efficiency and sustainability.
•Climate Solutions Asia Pacific, Middle East & Africa ("CSAME") provides products, controls, services and solutions to meet the heating, cooling and ventilation needs of residential and commercial customers in Asia Pacific, the Middle East and Africa while enhancing building performance, health, energy efficiency and sustainability.
•Climate Solutions Transportation ("CST") includes global transport refrigeration and monitoring products, services and digital solutions for trucks, trailers, shipping containers, intermodal and rail.
The Corporate and other category primarily includes corporate administrative functions such as tax, treasury, internal audit, legal and human resources. A portion of these costs and costs associated with shared service centers that provide transaction processing, accounting and other business support functions are allocated to the reportable segments.
Segment operating profit is the measure of profit and loss that the Company’s CODM, the Chief Executive Officer (“CEO”), uses to evaluate the financial performance of the business and as the basis for resource allocation, performance reviews and compensation. It represents operating profit (a GAAP measure) adjusted to exclude restructuring costs, amortization of acquired intangible assets and other significant items of a nonoperational nature. Targets are established on an annual basis and used by the CODM throughout the year to compare with actual results. Quarterly forecasts supplement annual targets and provide incremental information utilized to assess the performance of a segment. Variance analysis further provides insight into segment end-markets and operational cost optimization. These results also support the CODM to manage the Company’s business portfolio.
Consistent with the management approach for segment reporting, the tables below present reported external net sales and significant expense categories for each of the Company’s segments that are regularly provided to the CODM and included in its reported measure of segment profit or loss. The Company manages research and development costs on a global basis and allocates these costs to the reportable segments.
A summary of results by reportable segment are as follows:
| | | | | | | | | | | | | | | | | | | | | | | | | | | | | |
| For the Year Ended December 31, 2024 |
| (In millions) | CSA | | CSE | | CSAME | | CST | | Segment Total |
| Net sales | $ | 10,527 | | | $ | 4,984 | | | $ | 3,500 | | | $ | 3,475 | | | $ | 22,486 | |
| Cost of goods sold | (6,997) | | | (3,368) | | | (2,579) | | | (2,540) | | | (15,484) | |
| Research and development | (390) | | | (81) | | | (69) | | | (80) | | | (620) | |
| Selling, general and administrative | (962) | | | (1,062) | | | (520) | | | (369) | | | (2,913) | |
| Equity method investment net earnings | 135 | | | (1) | | | 92 | | | 6 | | | 232 | |
| Other income (expense), net | 10 | | | (3) | | | 42 | | | (7) | | | 42 | |
| Segment operating profit | $ | 2,323 | | | $ | 469 | | | $ | 466 | | | $ | 485 | | | $ | 3,743 | |
| | | | | | | | | | | | | | | | | | | | | | | | | | | | | |
| For the Year Ended December 31, 2023 |
| (In millions) | CSA | | CSE | | CSAME | | CST | | Segment Total |
| Net sales | $ | 9,615 | | | $ | 1,937 | | | $ | 3,581 | | | $ | 3,818 | | | $ | 18,951 | |
| Cost of goods sold | (6,629) | | | (1,410) | | | (2,697) | | | (2,854) | | | (13,590) | |
| Research and development | (294) | | | (28) | | | (52) | | | (74) | | | (448) | |
| Selling, general and administrative | (974) | | | (327) | | | (573) | | | (431) | | | (2,305) | |
| Equity method investment net earnings | 145 | | | — | | | 61 | | | 6 | | | 212 | |
| Other income (expense), net | (32) | | | 5 | | | 41 | | | 29 | | | 43 | |
| Segment operating profit | $ | 1,831 | | | $ | 177 | | | $ | 361 | | | $ | 494 | | | $ | 2,863 | |
| | | | | | | | | | | | | | | | | | | | | | | | | | | | | |
| For the Year Ended December 31, 2022 |
| (In millions) | CSA | | CSE | | CSAME | | CST | | Segment Total |
| Net sales | $ | 9,153 | | | $ | 1,631 | | | $ | 2,621 | | | $ | 3,883 | | | $ | 17,288 | |
| Cost of goods sold | (6,607) | | | (1,267) | | | (2,118) | | | (2,893) | | | (12,885) | |
| Research and development | (257) | | | (14) | | | (30) | | | (80) | | | (381) | |
| Selling, general and administrative | (809) | | | (262) | | | (353) | | | (415) | | | (1,839) | |
| Equity method investment net earnings | 105 | | | 2 | | | 149 | | | 6 | | | 262 | |
| Other income (expense), net | (28) | | | 6 | | | 28 | | | 22 | | | 28 | |
| Segment operating profit | $ | 1,557 | | | $ | 96 | | | $ | 297 | | | $ | 523 | | | $ | 2,473 | |
| | | | | | | | | | | | | | | | | | | | |
| (In millions) | | 2024 | | 2023 | | 2022 |
| Reconciliation to Earnings before income taxes | | | | | | |
| Segment operating profit | | $ | 3,743 | | | $ | 2,863 | | | $ | 2,473 | |
| | | | | | |
| Corporate and other | | (201) | | | (214) | | | (126) | |
| Restructuring costs | | (108) | | | (75) | | | (20) | |
| Amortization of acquired intangibles | | (689) | | | (143) | | | (46) | |
| Acquisition step-up amortization | | (282) | | | (41) | | | (51) | |
| Acquisition/divestiture-related costs | | (95) | | | (123) | | | (31) | |
| Viessmann-related hedges | | (86) | | | (96) | | | — | |
| CCR gain | | 318 | | | — | | | — | |
| Gain on liability adjustment | | 46 | | | — | | | — | |
| Bridge loan financing costs | | — | | | (3) | | | — | |
| TCC Acquisition-related gain | | — | | | (8) | | | 705 | |
| Chubb gain | | — | | | — | | | 1,105 | |
| Russia/Ukraine asset impairment | | — | | | — | | | (3) | |
| Charge resulting from legal matter | | — | | | — | | | (22) | |
| Non-service pension (expense) benefit | | (1) | | | (1) | | | (4) | |
| Interest (expense) income, net | | (371) | | | (160) | | | (157) | |
| Earnings before income taxes | | $ | 2,274 | | | $ | 1,999 | | | $ | 3,823 | |
Segment operating profit is not defined under GAAP and may not be comparable to similarly titled measures used by other companies. Measures of capital expenditures, depreciation expense, amortization expense and total assets by reportable segment are not provided to the CODM and therefore not disclosed.
Total assets are not presented for each segment as they are not presented to or reviewed by the CODM. Segment assets in the following table represent Accounts receivable, net and Inventories, net. These assets are regularly reviewed by management and are therefore reported in the following table as segment assets. All other remaining assets and liabilities for all periods presented are managed on a company-wide basis.
| | | | | | | | | | | | | | | | | | | | | | | | | | | | | | | | | | | | | | | | | | | | | | | | | |
| Segment Assets | | Capital Expenditures | | Depreciation & Amortization |
| (In millions) | 2024 | | 2023 | | | | 2024 | | 2023 | | 2022 | | 2024 | | 2023 | | 2022 |
| CSA | $ | 1,405 | | | $ | 1,371 | | | | | $ | 198 | | | $ | 179 | | | $ | 142 | | | $ | 134 | | | $ | 120 | | | $ | 105 | |
| CSE | 1,590 | | | 718 | | | | | 197 | | | 63 | | | 53 | | | 813 | | | 56 | | | 55 | |
| CSAME | 952 | | | 954 | | | | | 48 | | | 74 | | | 41 | | | 213 | | | 241 | | | 103 | |
| CST | 818 | | | 833 | | | | | 32 | | | 30 | | | 32 | | | 35 | | | 34 | | | 31 | |
| Total Segment | 4,765 | | | 3,876 | | | | | 475 | | | 346 | | | 268 | | | 1,195 | | | 451 | | | 294 | |
| Corporate and other | 185 | | | 27 | | | | | 44 | | | 93 | | | 49 | | | 37 | | | 40 | | | 34 | |
| Consolidated | $ | 4,950 | | | $ | 3,903 | | | | | $ | 519 | | | $ | 439 | | | $ | 317 | | | $ | 1,232 | | | $ | 491 | | | $ | 328 | |
| Cash and cash equivalents | 3,969 | | | 9,852 | | | | | | | | | | | | | | | |
| Other assets, current | 972 | | | 728 | | | | | | | | | | | | | | | |
| Assets held for sale | — | | | 5,093 | | | | | | | | | | | | | | | |
| Total current assets | $ | 9,891 | | | $ | 19,576 | | | | | | | | | | | | | | | |
Geographic External Sales
Geographic external sales and operating profits are attributed to the geographic regions based on their location of origin. With the exception of the U.S. as presented in the following table, there were no individually significant countries with sales exceeding 10% of total sales for the years ended December 31, 2024, 2023 and 2022.
| | | | | | | | | | | | | | | | | | | | | | | | | | | | | | | | | | | |
| | | | | | | | |
| | External Sales | | Long-Lived Assets | | | |
| (In millions) | | 2024 | | 2023 | | 2022 | | 2024 | | 2023 | | | |
| United States Operations | | $ | 11,294 | | | $ | 10,457 | | | $ | 9,997 | | | $ | 807 | | | $ | 795 | | | | |
| International Operations | | | | | | | | | | | | | |
| Europe | | 6,687 | | | 3,910 | | | 3,591 | | | 1,253 | | | 450 | | | | |
| Asia Pacific | | 3,817 | | | 3,949 | | | 3,090 | | | 486 | | | 499 | | | | |
| Other | | 688 | | | 635 | | | 610 | | | 453 | | | 416 | | | | |
| Consolidated | | $ | 22,486 | | | $ | 18,951 | | | $ | 17,288 | | | $ | 2,999 | | | $ | 2,160 | | | | |
NOTE 22: RELATED PARTIES
Equity Method Investments
The Company sells products to and purchases products from unconsolidated entities accounted for under the equity method and, therefore, these entities are considered to be related parties. The Company has 29 directly owned unconsolidated domestic and foreign affiliates as of December 31, 2024, of which 61% relates to Climate Solutions Americas, and 34% relates to Climate Solutions Asia Pacific, Middle East & Africa. The Company periodically reviews the carrying value of its equity method investments to determine if there has been an other-than-temporary decline in fair value.
Amounts attributable to equity method investees are as follows:
| | | | | | | | | | | | | | | | | |
| (In millions) | 2024 | | 2023 | | 2022 |
Sales to equity method investees included in Product sales | $ | 2,956 | | | $ | 2,920 | | | $ | 2,845 | |
Purchases from equity method investees included in Cost of products sold | $ | 237 | | | $ | 214 | | | $ | 331 | |
The Company had receivables from and payables to equity method investees as follows:
| | | | | | | | | | | |
| (In millions) | 2024 | | 2023 |
Receivables from equity method investees included in Accounts receivable, net | $ | 363 | | | $ | 231 | |
Payables to equity method investees included in Accounts payable | $ | 32 | | | $ | 44 | |
The financial results of TCC are included in the Company's consolidated results since the acquisition date of August 1, 2022. Prior to the acquisition, the Company previously accounted for its minority ownership in TCC under the equity method of accounting. As a result, prior period results may not be comparable to the current period.
Summarized Financial Information. Pursuant to Rule 3-10 and Rule 4-08(g) of Regulation S-X under the Securities Act, the Company presents summarized financial information of the combined accounts of its non-consolidated joint ventures accounted for by the equity method.
Summarized unaudited financial information for equity method investments is as follows:
| | | | | | | | | | | |
| |
| (In millions) | 2024 | | 2023 |
| Current assets | $ | 12,823 | | | $ | 11,432 | |
| Non-current assets | 2,396 | | | 1,834 | |
| Total assets | 15,219 | | | 13,266 | |
| | | |
| Current liabilities | (11,053) | | | (9,296) | |
| Non-current liabilities | (210) | | | (190) | |
| Total liabilities | (11,263) | | | (9,486) | |
| Total net equity of investees | $ | 3,956 | | | $ | 3,780 | |
| | | | | | | | | | | | | | | | | |
| |
| (In millions) | 2024 | | 2023 | | 2022 |
| Net sales | $ | 17,567 | | | $ | 16,180 | | | $ | 11,524 | |
| Gross profit | $ | 3,063 | | | $ | 2,862 | | | $ | 2,274 | |
| Income from continuing operations | $ | 700 | | | $ | 655 | | | $ | 757 | |
| Net earnings (loss) | $ | 700 | | | $ | 655 | | | $ | 757 | |
NOTE 23: COMMITMENTS AND CONTINGENT LIABILITIES
The Company is involved in various litigation, claims and administrative proceedings, including those related to environmental (including asbestos) and legal matters. In accordance with ASC 450, Contingencies, the Company records accruals for loss contingencies when it is probable that a liability has been incurred and the amount of the loss can be reasonably estimated. These accruals are generally based upon a range of possible outcomes. If no amount within the range is a better estimate than any other, the Company accrues the minimum amount. In addition, these estimates are reviewed periodically and adjusted to reflect additional information when it becomes available. The Company is unable to predict the final outcome of the following matters based on the information currently available, except as otherwise noted. However, the Company does not believe that the resolution of any of these matters will have a material adverse effect upon its results of operations or financial condition.
Environmental Matters
The Company’s operations are subject to environmental regulation by various authorities. The Company has accrued for the costs of environmental remediation activities, including but not limited to, investigatory, remediation, operating and maintenance costs and performance guarantees. The most likely cost to be incurred is accrued based on an evaluation of currently available facts with respect to individual sites, including the technology required to remediate, current laws and regulations and prior remediation experience.
As of December 31, 2024 and 2023, the outstanding liability for environmental obligations are as follows:
| | | | | | | | | | | | | | |
| (In millions) | | 2024 | | 2023 |
Environmental reserves included in Accrued liabilities | | $ | 25 | | | $ | 19 | |
Environmental reserves included in Other long-term liabilities | | 185 | | | 199 |
| Total environmental reserves | | $ | 210 | | | $ | 218 | |
For sites with multiple responsible parties, the Company considers its likely proportionate share of the anticipated remediation costs and the ability of other parties to fulfill their obligations in establishing a provision for these costs. Accrued environmental liabilities are not reduced by potential insurance reimbursements and are undiscounted.
Asbestos Matters
The Company has been named as a defendant in lawsuits alleging personal injury as a result of exposure to asbestos allegedly integrated into certain Carrier products or business premises. While the Company has never manufactured asbestos and no longer incorporates it into any currently-manufactured products, certain products that the Company no longer manufactures contained components incorporating asbestos. A substantial majority of these asbestos-related claims have been dismissed without payment or have been covered in full or in part by insurance or other forms of indemnity. Additional cases were litigated and settled without any insurance reimbursement. The amounts involved in asbestos-related claims were not material individually or in the aggregate in any period.
The Company's asbestos liabilities and related insurance recoveries are as follows:
| | | | | | | | | | | | | | |
| (In millions) | | 2024 | | 2023 |
Asbestos liabilities included in Accrued liabilities | | $ | 17 | | | $ | 15 | |
Asbestos liabilities included in Other long-term liabilities | | 208 | | | 206 | |
| Total asbestos liabilities | | $ | 225 | | | $ | 221 | |
| | | | |
Asbestos-related recoveries included in Accounts receivable, net | | $ | 7 | | | $ | 5 | |
Asbestos-related recoveries included in Other assets | | 88 | | | 88 | |
| Total asbestos-related recoveries | | $ | 95 | | | $ | 93 | |
The amounts recorded for asbestos-related liabilities are based on currently available information and assumptions that the Company believes are reasonable and are made with input from outside actuarial experts. These amounts are undiscounted and exclude the Company's legal fees to defend the asbestos claims, which are expensed as incurred. In addition, the Company has recorded insurance recovery receivables for probable asbestos-related recoveries.
Aqueous Film Forming Foam Litigation
As of December 31, 2024, the Company, Kidde-Fenwal, Inc. ("KFI") and others have been named as defendants in more than 9,000 lawsuits filed in United States state or federal courts and a single case in Canada alleging that the historic use of Aqueous Film Forming Foam ("AFFF") caused personal injuries and damage to property and water supplies. In December 2018, the U.S. Judicial Panel on Multidistrict Litigation transferred and consolidated all AFFF cases pending in the U.S. federal courts against the Company, KFI and others to the U.S. District Court for the District of South Carolina (the "MDL Proceedings"). Individual plaintiffs in the MDL Proceedings generally seek damages for alleged personal injuries, medical monitoring, diminution in property value and injunctive relief to remediate alleged contamination of water supplies. U.S. state, municipal and water utility plaintiffs in the MDL Proceedings generally seek damages and costs related to the remediation of public property and water supplies.
AFFF is a firefighting foam, developed beginning in the late 1960s pursuant to U.S. military specification, used to extinguish certain types of hydrocarbon-fueled fires. The lawsuits identified above relate to Kidde Fire Fighting, Inc., which owned the “National Foam” business that manufactured AFFF for sale to government (including the U.S. federal government) and non-government customers in the U.S. at a single facility located in West Chester, Pennsylvania (the "Pennsylvania Site"). Kidde Fire Fighting, Inc. was acquired by a UTC subsidiary in 2005 and merged into KFI in 2007. In 2013, KFI divested the AFFF businesses to an unrelated third party. The Company acquired KFI as part of the Separation in April 2020.
The key components that contribute to AFFF's fire-extinguishing capabilities are known as fluorosurfactants. Neither the Company, nor KFI, nor any of the Company's subsidiaries involved in the AFFF litigation manufactured fluorosurfactants. Instead, the National Foam business purchased these substances from unrelated third parties for use in manufacturing AFFF. Plaintiffs in the MDL Proceedings allege that the fluorosurfactants used by various manufacturers in producing AFFF contained, or over time degraded into, compounds known as per- and polyfluoroalkyl substances (referred to collectively as "PFAS"), including perflourooctanesulfonic acid ("PFOS") and perflourooctanoic acid ("PFOA"). Plaintiffs further allege that, as a result of the use of AFFF, PFOS and PFOA were released into the environment and, in some instances, ultimately reached drinking water supplies.
Plaintiffs in the MDL Proceedings have named multiple defendants, including suppliers of chemicals and raw materials used to manufacture fluorosurfactants, fluorosurfactant manufacturers and AFFF manufacturers. The defendants in the MDL Proceedings moved for summary judgment on the government contractor defense, which potentially applies to AFFF sold to or used by the U.S. government. After full briefing and oral argument, on September 16, 2022, the MDL court declined to enter summary judgment for the defendants. The defense, however, remains available at any trial in which it would apply.
On May 14, 2023, KFI filed a voluntary petition with the United States Bankruptcy Court for the District of Delaware (the “Bankruptcy Court”) seeking relief under chapter 11 of the Bankruptcy Code, after the Company determined that it would not provide financial support to KFI going forward other than ensuring KFI has access to services necessary for the effective operation of its business. As a result, all litigation against KFI was automatically stayed. By agreement, all AFFF-related litigation against the Company, its other subsidiaries and RTX also was stayed. On November 21, 2023, the Bankruptcy Court ordered certain parties, including the Company, to participate in mediation sessions with respect to claims that might be asserted by and against it in the bankruptcy proceedings.
Following the conclusion of these mediation sessions in October 2024, the Company entered into a Settlement and Plan Support Agreement which contemplates that the Company will subsequently enter into three distinct settlement agreements (collectively, the “Proposed Settlement Agreements”) with KFI, the Official Committee of Unsecured Creditors appointed in KFI’s bankruptcy case (the “Committee”) and the Plaintiffs’ Executive Committee (the “MDL PEC”) appointed in the MDL Proceedings.
The first of the Proposed Settlement Agreements relates to claims that the Company is responsible for liabilities arising from KFI’s manufacture or sale of AFFF (“Estate Claims Settlement”). Upon Bankruptcy Court approval, the Estate Claims Settlement will permanently resolve all present and future claims that the Company is responsible for any liabilities of KFI, including all liabilities arising from KFI’s manufacture and sale of AFFF. The second and third of the Proposed Settlement Agreements release a very substantial amount of current and future direct claims against the Company (the “Direct Claims Settlements”). Direct claims allege that UTC, which indirectly owned KFI’s AFFF business for eight years, engaged in conduct independent of KFI that caused harm to AFFF claimants. The Company agreed to indemnify UTC for these direct claims when it was spun-off from UTC. Upon approval by the MDL Court, the Direct Claims Settlements resolve and enjoin all current and future AFFF-related direct claims against the Company by participating public water providers and airports. Non-settling parties may still assert direct AFFF-related claims, although we expect a vast majority of public water providers and airports will participate in the Direct Claims Settlements.
As part of the Proposed Settlement Agreements, the Company will pay $615 million in cash over five years, 100% of the net sale proceeds from its sale of KFI’s assets to Pacific Avenue Capital Partners, which are estimated to be $115 million, and contribute the right to recover proceeds under certain of its insurance policies. The Company will be entitled to receive up to $2.4 billion of proceeds from those insurance policies and will contribute the first $125 million of such proceeds as additional consideration in the Direct Claims Settlements. The Company also will be entitled to any earnouts payable to KFI under the KFI sale agreement. The Company expects insurance proceeds it receives in the future, in the aggregate, to cover the amount paid under the Proposed Settlement Agreements. As a result of the Proposed Settlement Agreements, the Company recorded a liability in the amount of $565 million during the year December 31, 2024. The amount recognized is in addition to liabilities of $50 million that the Company recorded upon the deconsolidation of KFI on May 14, 2023, as further discussed below. As of December 31, 2024, the Company has not recorded any amounts associated with expected insurance proceeds.
The Company and KFI believe that they have meritorious defenses to the remaining AFFF claims. Given the numerous factual, scientific and legal issues to be resolved relating to these claims, the Company is unable to assess the probability of liability or to reasonably estimate a range of possible loss at this time. There can be no assurance that any such future exposure will not be material in any period.
On November 14, 2024, KFI filed the chapter 11 plan of liquidation (as may be further amended, restated, supplemented, waived, or otherwise modified from time to time, the "Chapter 11 Plan"), which incorporates the Estate Claims Settlement, provides for the treatment of the various creditor classes, and establishes wind-down provisions, among other things, and the disclosure statement for the Chapter 11 Plan (as may be further amended, restated, supplemented, waived, or otherwise modified from time to time, the "Disclosure Statement"). A hearing to approve the Disclosure Statement, its ancillary documents and establish a Chapter 11 Plan confirmation timeline in the Bankruptcy Court is expected to be held in March 2025.
Deconsolidation Due to Bankruptcy
As of May 14, 2023, the Company no longer controlled KFI as its activities are subject to review and oversight by the Bankruptcy Court. Therefore, KFI was deconsolidated and its respective assets and liabilities were derecognized from the Company’s Consolidated Financial Statements. Upon deconsolidation, the Company determined the fair value of its retained interest in KFI to be zero and accounted for it prospectively using the cost method. As a result of these actions, the Company recognized a net loss of $292 million in its Consolidated Statement of Operations within Discontinued operations, net of tax. In addition, the deconsolidation resulted in an investing cash outflow of $134 million in the Company's Consolidated Statement of Cash Flows within Net cash flows provided by (used in) discontinued investing activities.
In connection with the bankruptcy filing, KFI entered into several agreements with subsidiaries of the Company to ensure they have access to services necessary for the effective operation of their business. All post-deconsolidation activity between the Company and KFI are reported as third-party transactions recorded within the Company's Consolidated Statement of Operations. Since the petition date, there were no material transactions between the Company and KFI other than a $15 million payment by the Company to KFI under the terms of a tax sharing arrangement.
Income Taxes
Under the TMA relating to the Separation, the Company is responsible to UTC for its share of the TCJA transition tax associated with foreign undistributed earnings as of December 31, 2017. During 2024, the Company recognized a $46 million gain associated with the TMA and UTC's conclusion of certain income tax matters from their 2017 and 2018 tax audit with the IRS. In addition, the Company recognized a $23 million tax benefit associated with a favorable court ruling and paid its April 2025 installment in 2024. As a result, a liability of $78 million is included within the accompanying Consolidated Balance Sheet within Other Long-Term Liabilities as of December 31, 2024. This obligation is expected to be settled in April 2026. The Company believes that the likelihood of incurring losses materially in excess of this amount is remote.
Self-Insurance
The Company maintains self-insurance for a number of risks, including but not limited to, workers’ compensation, general liability, automobile liability, property and employee-related healthcare benefits. It has obtained insurance coverage for amounts exceeding individual and aggregate loss limits. The Company accrues for known future claims and incurred but not reported losses.
The Company's self-insurance liabilities were as follows:
| | | | | | | | | | | |
| (In millions) | 2024 | | 2023 |
Self-insurance liabilities included in Accrued liabilities | $ | 173 | | | $ | 160 | |
Self-insurance liabilities included in Other long-term liabilities | 43 | | | 55 |
| Total self-insurance liabilities | $ | 216 | | | $ | 215 | |
The Company incurred expenses related to self-insured risks of $135 million, $139 million and $124 million for the years ended December 31, 2024, 2023 and 2022, respectively.
Other Matters
The Company has other commitments and contingent liabilities related to legal proceedings, self-insurance programs and matters arising in the ordinary course of business. The Company accrues for contingencies generally based upon a range of possible outcomes. If no amount within the range is a better estimate than any other, the Company accrues the minimum amount.
In the ordinary course of business, the Company is also routinely a defendant in, party to or otherwise subject to many pending and threatened legal actions, claims, disputes and proceedings. These matters are often based on alleged violations of contract, product liability, warranty, regulatory, environmental, health and safety, employment, intellectual property, tax and other laws. In some of these proceedings, claims for substantial monetary damages are asserted against the Company and could result in fines, penalties, compensatory or treble damages or non-monetary relief. The Company does not believe that these matters will have a material adverse effect upon its competitive position, results of operations, cash flows or financial condition.
NOTE 24: SUPPLEMENTAL CASH FLOW INFORMATION
Supplemental cash flow information was as follows:
| | | | | | | | | | | | | | | | | |
| (In millions) | 2024 | | 2023 | | 2022 |
| Interest paid, net of amounts capitalized | $ | 610 | | | $ | 320 | | | $ | 297 | |
| | | | | |
| | | | | |
| Income taxes paid, net of refunds | $ | 2,126 | | | $ | 942 | | | $ | 833 | |
| | | | | |
| Non-cash financing activity: | | | | | |
| Common stock dividends payable | $ | 199 | | | $ | 161 | | | $ | 158 | |
NOTE 25: SELECTED QUARTERLY FINANCIAL INFORMATION (UNAUDITED)
During the year ended December, 31, 2024, the components of the Fire & Security segment in aggregate met the criteria to be presented as discontinued operations. The following table presents select quarterly financial information for continuing operations:
| | | | | | | | | | | | | | | | | | | | | | | |
| 2024 Quarters |
| (In millions) | Q1 | | Q2 | | Q3 | | Q4 |
| Net sales | $ | 5,420 | | | $ | 5,934 | | | $ | 5,984 | | | $ | 5,148 | |
Operating profit | $ | 385 | | | $ | 724 | | | $ | 763 | | | $ | 774 | |
| Earnings from continuing operations attributable to common shareowners | $ | 177 | | | $ | 415 | | | $ | 564 | | | $ | (48) | |
| Basic earnings per share - continuing operations | $ | 0.20 | | | $ | 0.46 | | | $ | 0.63 | | | $ | (0.05) | |
| Diluted earnings per share - continuing operations | $ | 0.19 | | | $ | 0.45 | | | $ | 0.62 | | | $ | (0.05) | |
| | | | | | | |
| 2023 Quarters |
| (In millions) | Q1 | | Q2 | | Q3 | | Q4 |
| Net sales | $ | 4,518 | | | $ | 5,182 | | | $ | 4,935 | | | $ | 4,316 | |
Operating profit | $ | 460 | | | $ | 651 | | | $ | 510 | | | $ | 539 | |
| Earnings from continuing operations attributable to common shareowners | $ | 306 | | | $ | 394 | | | $ | 270 | | | $ | 417 | |
| Basic earnings per share - continuing operations | $ | 0.37 | | | $ | 0.47 | | | $ | 0.32 | | | $ | 0.50 | |
| Diluted earnings per share - continuing operations | $ | 0.36 | | | $ | 0.46 | | | $ | 0.32 | | | $ | 0.49 | |