| . July 29, 2025 INVESTOR PRESENTATION |

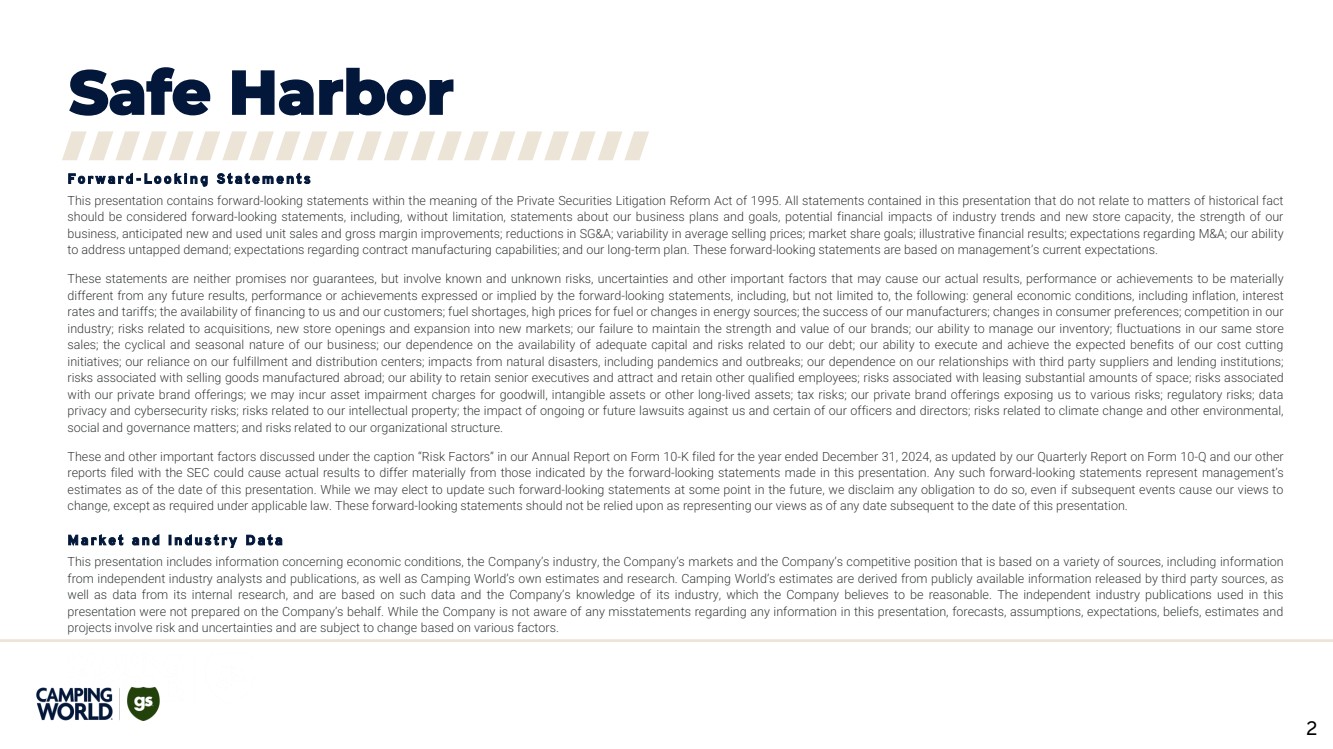
| Camping World confidential and proprietary. Unauthorized disclosure, reproduction or other use prohibited. 2 Safe Harbor 2 F o r w a r d - L o o k i n g S t a t e m e n t s This presentation contains forward-looking statements within the meaning of the Private Securities Litigation Reform Act of 1995. All statements contained in this presentation that do not relate to matters of historical fact should be considered forward-looking statements, including, without limitation, statements about our business plans and goals, potential financial impacts of industry trends and new store capacity, the strength of our business, anticipated new and used unit sales and gross margin improvements; reductions in SG&A; variability in average selling prices; market share goals; illustrative financial results; expectations regarding M&A; our ability to address untapped demand; expectations regarding contract manufacturing capabilities; and our long-term plan. These forward-looking statements are based on management’s current expectations. These statements are neither promises nor guarantees, but involve known and unknown risks, uncertainties and other important factors that may cause our actual results, performance or achievements to be materially different from any future results, performance or achievements expressed or implied by the forward-looking statements, including, but not limited to, the following: general economic conditions, including inflation, interest rates and tariffs; the availability of financing to us and our customers; fuel shortages, high prices for fuel or changes in energy sources; the success of our manufacturers; changes in consumer preferences; competition in our industry; risks related to acquisitions, new store openings and expansion into new markets; our failure to maintain the strength and value of our brands; our ability to manage our inventory; fluctuations in our same store sales; the cyclical and seasonal nature of our business; our dependence on the availability of adequate capital and risks related to our debt; our ability to execute and achieve the expected benefits of our cost cutting initiatives; our reliance on our fulfillment and distribution centers; impacts from natural disasters, including pandemics and outbreaks; our dependence on our relationships with third party suppliers and lending institutions; risks associated with selling goods manufactured abroad; our ability to retain senior executives and attract and retain other qualified employees; risks associated with leasing substantial amounts of space; risks associated with our private brand offerings; we may incur asset impairment charges for goodwill, intangible assets or other long-lived assets; tax risks; our private brand offerings exposing us to various risks; regulatory risks; data privacy and cybersecurity risks; risks related to our intellectual property; the impact of ongoing or future lawsuits against us and certain of our officers and directors; risks related to climate change and other environmental, social and governance matters; and risks related to our organizational structure. These and other important factors discussed under the caption “Risk Factors” in our Annual Report on Form 10-K filed for the year ended December 31, 2024, as updated by our Quarterly Report on Form 10-Q and our other reports filed with the SEC could cause actual results to differ materially from those indicated by the forward-looking statements made in this presentation. Any such forward-looking statements represent management’s estimates as of the date of this presentation. While we may elect to update such forward-looking statements at some point in the future, we disclaim any obligation to do so, even if subsequent events cause our views to change, except as required under applicable law. These forward-looking statements should not be relied upon as representing our views as of any date subsequent to the date of this presentation. M a r k e t a n d I n d u s t r y D a t a This presentation includes information concerning economic conditions, the Company’s industry, the Company’s markets and the Company’s competitive position that is based on a variety of sources, including information from independent industry analysts and publications, as well as Camping World’s own estimates and research. Camping World’s estimates are derived from publicly available information released by third party sources, as well as data from its internal research, and are based on such data and the Company’s knowledge of its industry, which the Company believes to be reasonable. The independent industry publications used in this presentation were not prepared on the Company’s behalf. While the Company is not aware of any misstatements regarding any information in this presentation, forecasts, assumptions, expectations, beliefs, estimates and projects involve risk and uncertainties and are subject to change based on various factors. |
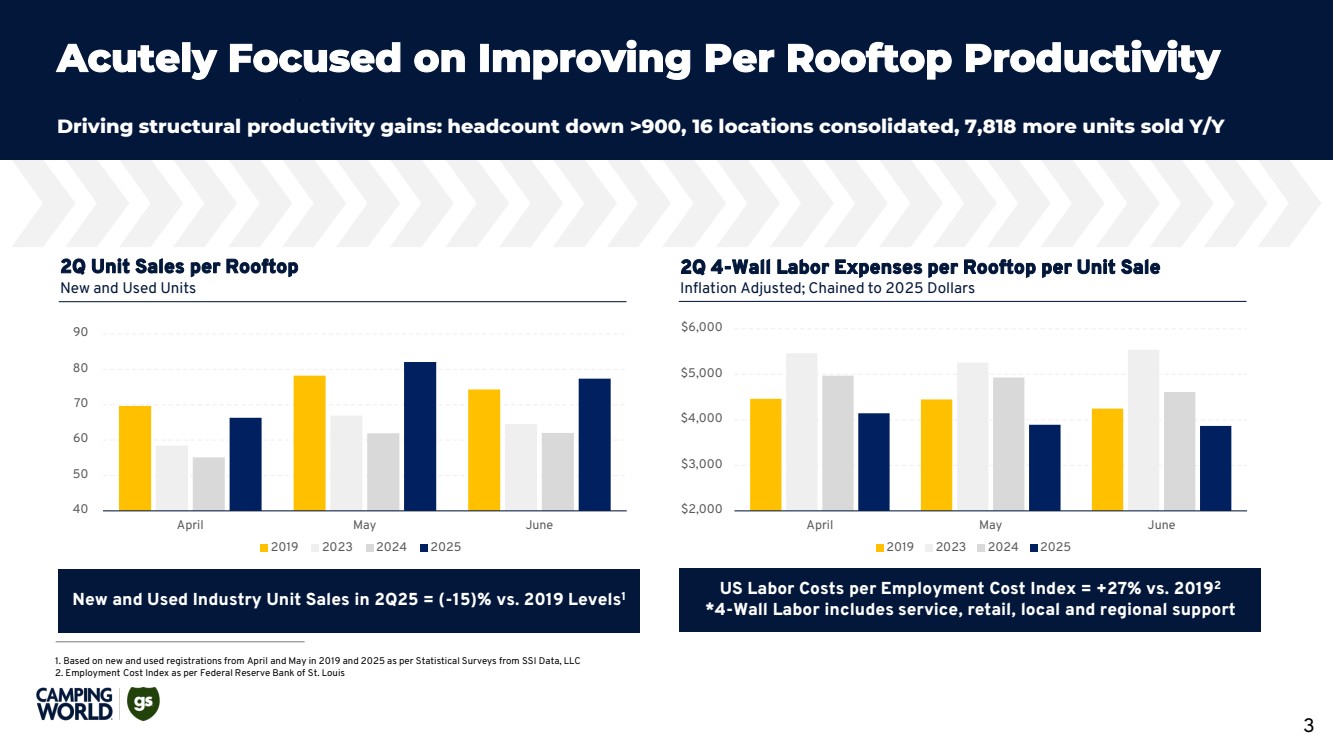
| 3 To be populated once Q3 final Acutely Focused on Improving Per Rooftop Productivity Driving structural productivity gains: headcount down >900, 16 locations consolidated, 7,818 more units sold Y/Y 1. Based on new and used registrations from April and May in 2019 and 2025 as per Statistical Surveys from SSI Data, LLC 2. Employment Cost Index as per Federal Reserve Bank of St. Louis 40 50 60 70 80 90 April May June 2019 2023 2024 2025 New and Used Industry Unit Sales in 2Q25 = (-15)% vs. 2019 Levels1 2Q Unit Sales per Rooftop New and Used Units 2Q 4-Wall Labor Expenses per Rooftop per Unit Sale Inflation Adjusted; Chained to 2025 Dollars $2,000 $3,000 $4,000 $5,000 $6,000 April May June 2019 2023 2024 2025 US Labor Costs per Employment Cost Index = +27% vs. 20192 *4-Wall Labor includes service, retail, local and regional support |
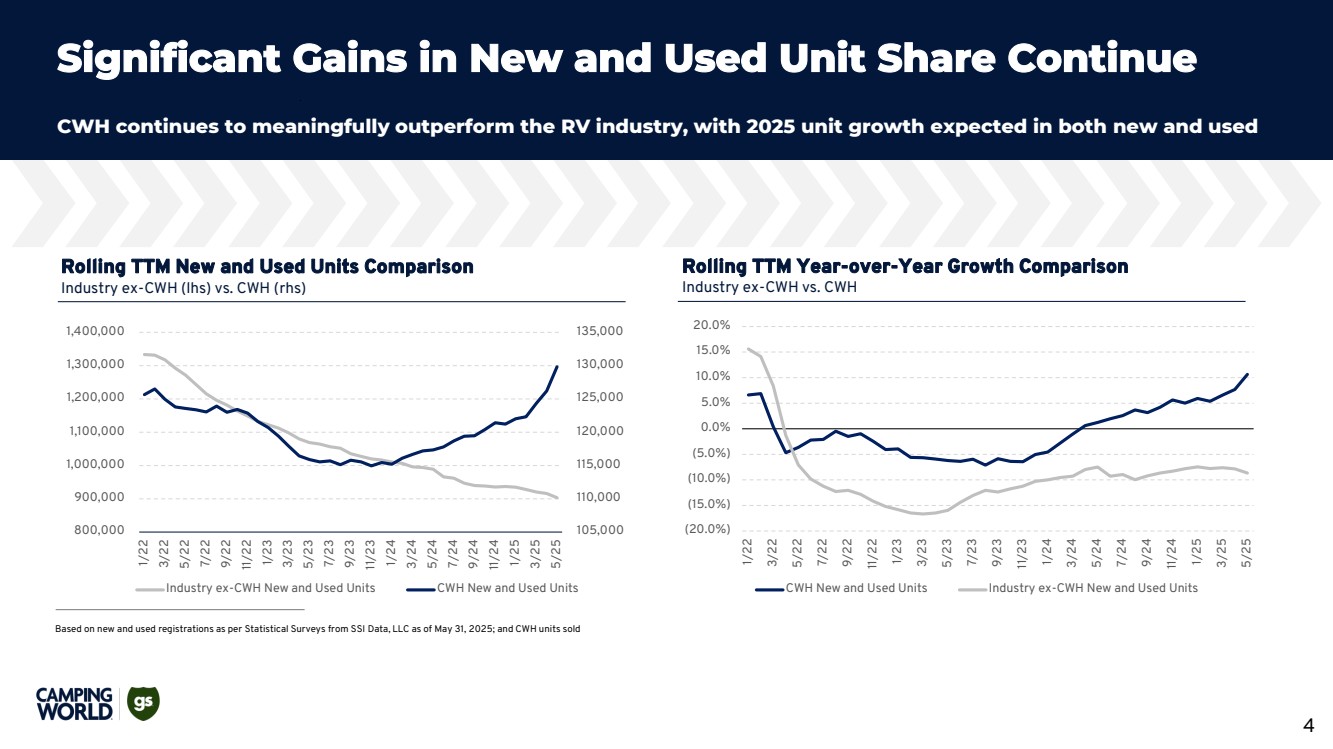
| 4 To be populated once Q3 final Significant Gains in New and Used Unit Share Continue CWH continues to meaningfully outperform the RV industry, with 2025 unit growth expected in both new and used Based on new and used registrations as per Statistical Surveys from SSI Data, LLC as of May 31, 2025; and CWH units sold Rolling TTM New and Used Units Comparison Industry ex-CWH (lhs) vs. CWH (rhs) 105,000 110,000 115,000 120,000 125,000 130,000 135,000 800,000 900,000 1,000,000 1,100,000 1,200,000 1,300,000 1,400,000 1/22 3/22 5/22 7/22 9/22 11/22 1/23 3/23 5/23 7/23 9/23 11/23 1/24 3/24 5/24 7/24 9/24 11/24 1/25 3/25 5/25 Industry ex-CWH New and Used Units CWH New and Used Units Rolling TTM Year-over-Year Growth Comparison Industry ex-CWH vs. CWH (20.0%) (15.0%) (10.0%) (5.0%) 0.0% 5.0% 10.0% 15.0% 20.0% 1/22 3/22 5/22 7/22 9/22 11/22 1/23 3/23 5/23 7/23 9/23 11/23 1/24 3/24 5/24 7/24 9/24 11/24 1/25 3/25 5/25 CWH New and Used Units Industry ex-CWH New and Used Units |
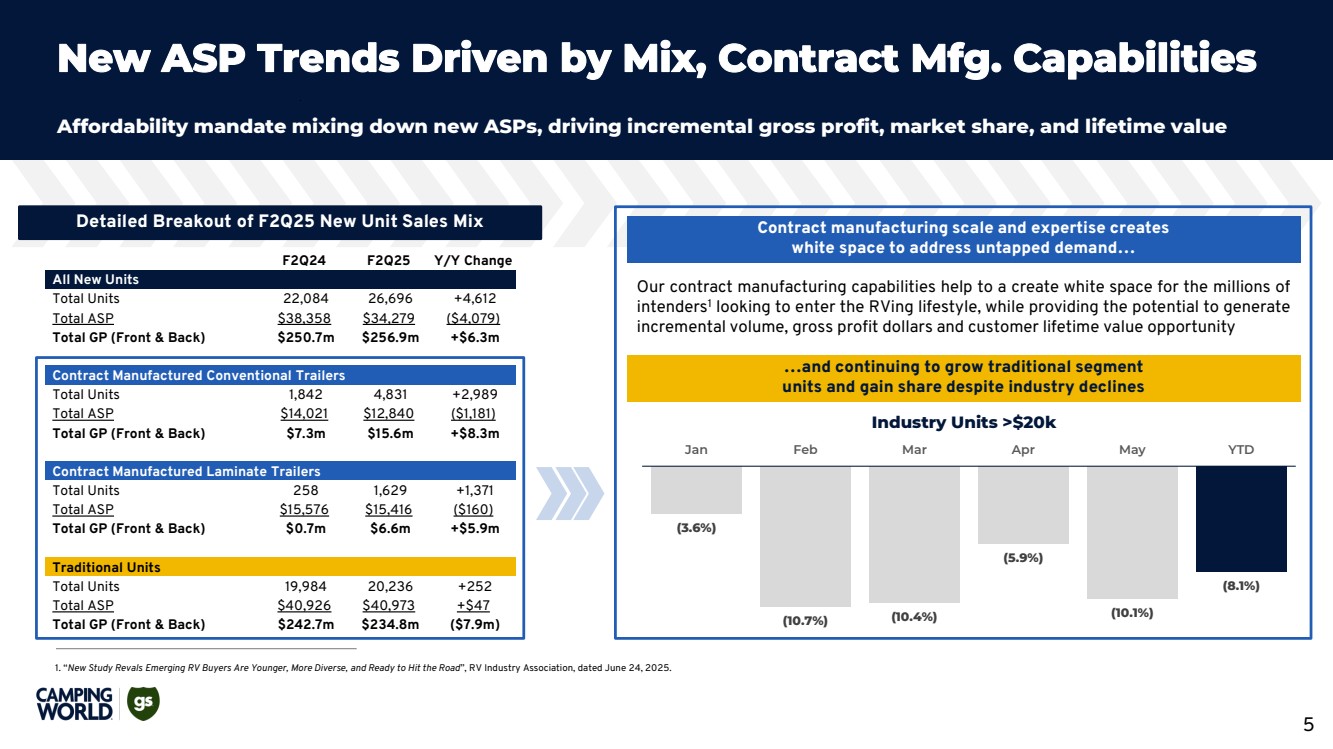
| 5 To be populated once Q3 final F2Q24 F2Q25 Y/Y Change All New Units Total Units 22,084 26,696 +4,612 Total ASP $38,358 $34,279 ($4,079) Total GP (Front & Back) $250.7m $256.9m +$6.3m Contract Manufactured Conventional Trailers Total Units 1,842 4,831 +2,989 Total ASP $14,021 $12,840 ($1,181) Total GP (Front & Back) $7.3m $15.6m +$8.3m Contract Manufactured Laminate Trailers Total Units 258 1,629 +1,371 Total ASP $15,576 $15,416 ($160) Total GP (Front & Back) $0.7m $6.6m +$5.9m Traditional Units Total Units 19,984 20,236 +252 Total ASP $40,926 $40,973 +$47 Total GP (Front & Back) $242.7m $234.8m ($7.9m) Contract manufacturing scale and expertise creates white space to address untapped demand… Our contract manufacturing capabilities help to a create white space for the millions of intenders1 looking to enter the RVing lifestyle, while providing the potential to generate incremental volume, gross profit dollars and customer lifetime value opportunity (3.6%) (10.7%) (10.4%) (5.9%) (10.1%) (8.1%) Jan Feb Mar Apr May YTD Industry Units >$20k Detailed Breakout of F2Q25 New Unit Sales Mix 1. “New Study Revals Emerging RV Buyers Are Younger, More Diverse, and Ready to Hit the Road”, RV Industry Association, dated June 24, 2025. …and continuing to grow traditional segment units and gain share despite industry declines New ASP Trends Driven by Mix, Contract Mfg. Capabilities Affordability mandate mixing down new ASPs, driving incremental gross profit, market share, and lifetime value |
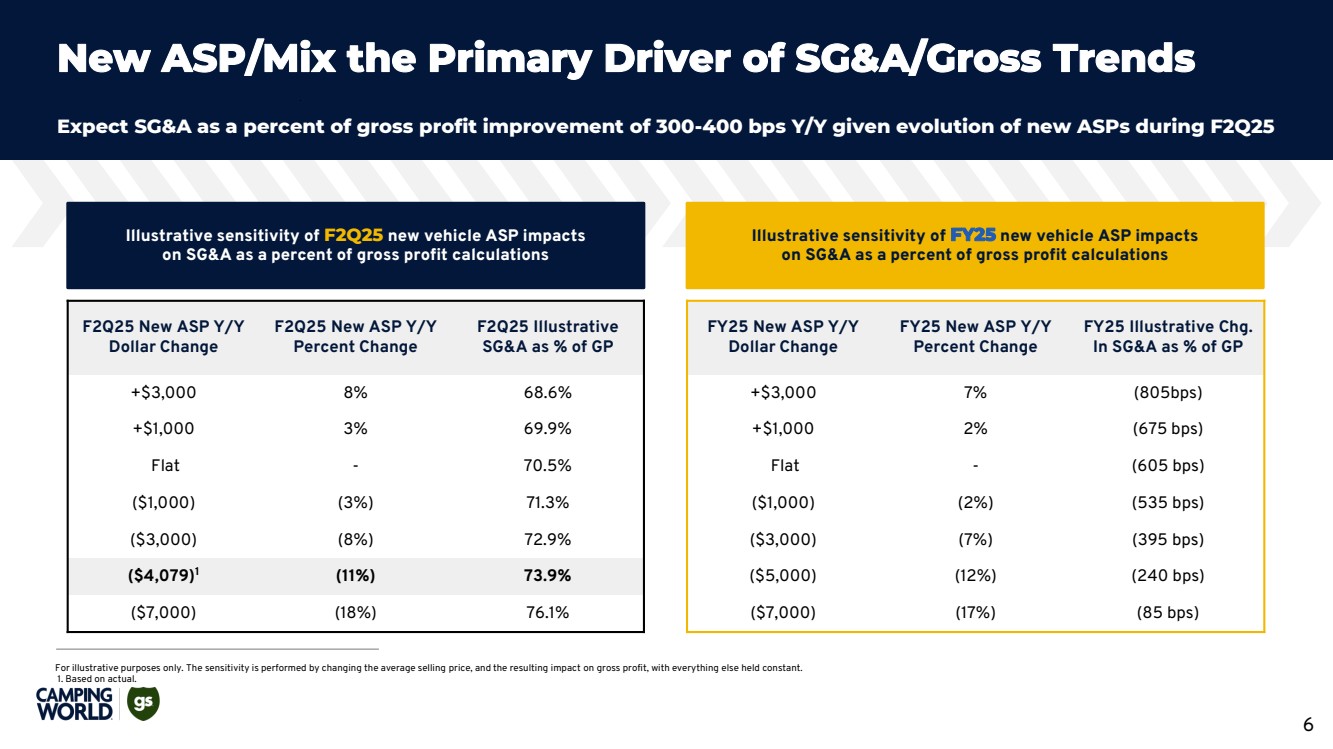
| 6 To be populated once Q3 final F2Q25 New ASP Y/Y Dollar Change F2Q25 New ASP Y/Y Percent Change F2Q25 Illustrative SG&A as % of GP +$3,000 8% 68.6% +$1,000 3% 69.9% Flat - 70.5% ($1,000) (3%) 71.3% ($3,000) (8%) 72.9% ($4,079)1 (11%) 73.9% ($7,000) (18%) 76.1% Illustrative sensitivity of F2Q25 new vehicle ASP impacts on SG&A as a percent of gross profit calculations FY25 New ASP Y/Y Dollar Change FY25 New ASP Y/Y Percent Change FY25 Illustrative Chg. In SG&A as % of GP +$3,000 7% (805bps) +$1,000 2% (675 bps) Flat - (605 bps) ($1,000) (2%) (535 bps) ($3,000) (7%) (395 bps) ($5,000) (12%) (240 bps) ($7,000) (17%) (85 bps) Illustrative sensitivity of FY25 new vehicle ASP impacts on SG&A as a percent of gross profit calculations New ASP/Mix the Primary Driver of SG&A/Gross Trends Expect SG&A as a percent of gross profit improvement of 300-400 bps Y/Y given evolution of new ASPs during F2Q25 For illustrative purposes only. The sensitivity is performed by changing the average selling price, and the resulting impact on gross profit, with everything else held constant. 1. Based on actual. |
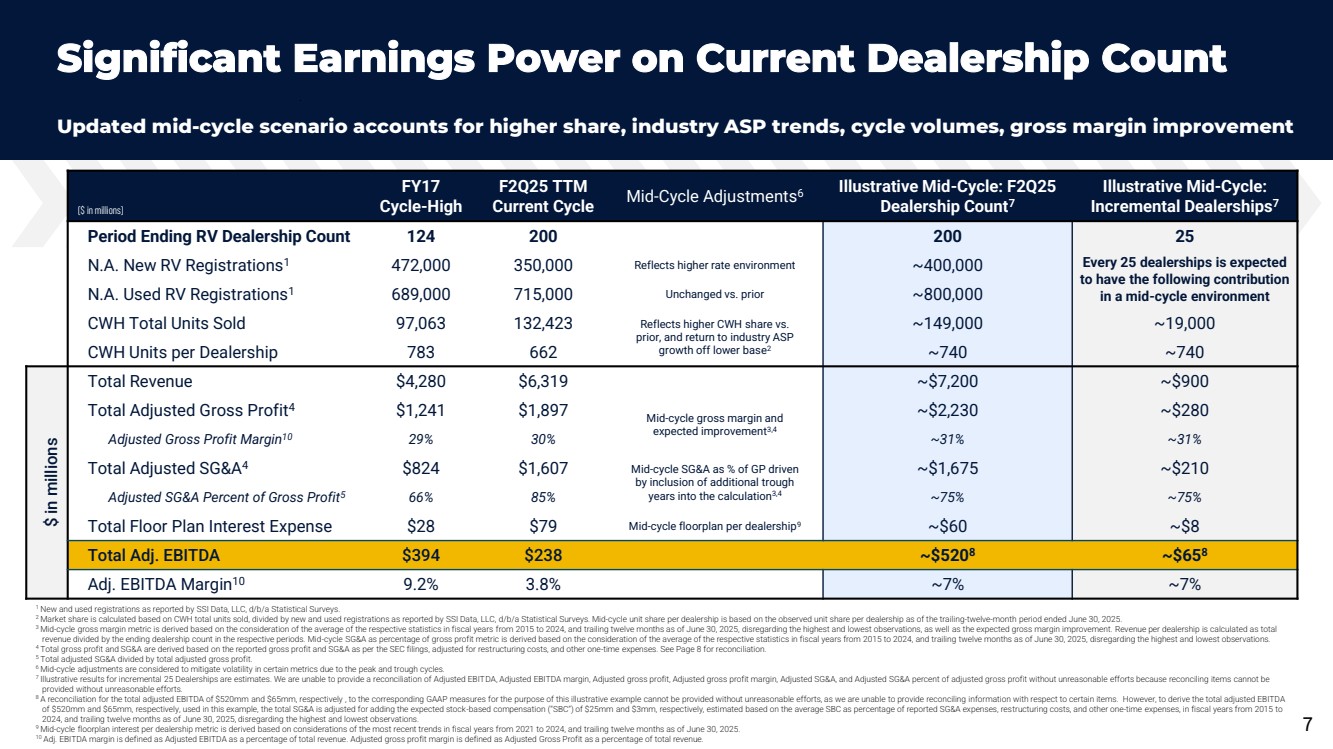
| 1 New and used registrations as reported by SSI Data, LLC, d/b/a Statistical Surveys. 2 Market share is calculated based on CWH total units sold, divided by new and used registrations as reported by SSI Data, LLC, d/b/a Statistical Surveys. Mid-cycle unit share per dealership is based on the observed unit share per dealership as of the trailing-twelve-month period ended June 30, 2025. 3 Mid-cycle gross margin metric is derived based on the consideration of the average of the respective statistics in fiscal years from 2015 to 2024, and trailing twelve months as of June 30, 2025, disregarding the highest and lowest observations, as well as the expected gross margin improvement. Revenue per dealership is calculated as total revenue divided by the ending dealership count in the respective periods. Mid-cycle SG&A as percentage of gross profit metric is derived based on the consideration of the average of the respective statistics in fiscal years from 2015 to 2024, and trailing twelve months as of June 30, 2025, disregarding the highest and lowest observations. 4 Total gross profit and SG&A are derived based on the reported gross profit and SG&A as per the SEC filings, adjusted for restructuring costs, and other one-time expenses. See Page 8 for reconciliation. 5 Total adjusted SG&A divided by total adjusted gross profit. 6 Mid-cycle adjustments are considered to mitigate volatility in certain metrics due to the peak and trough cycles. 7 Illustrative results for incremental 25 Dealerships are estimates. We are unable to provide a reconciliation of Adjusted EBITDA, Adjusted EBITDA margin, Adjusted gross profit, Adjusted gross profit margin, Adjusted SG&A, and Adjusted SG&A percent of adjusted gross profit without unreasonable efforts because reconciling items cannot be provided without unreasonable efforts. 8 A reconciliation for the total adjusted EBITDA of $520mm and $65mm, respectively , to the corresponding GAAP measures for the purpose of this illustrative example cannot be provided without unreasonable efforts, as we are unable to provide reconciling information with respect to certain items. However, to derive the total adjusted EBITDA of $520mm and $65mm, respectively, used in this example, the total SG&A is adjusted for adding the expected stock-based compensation (“SBC”) of $25mm and $3mm, respectively, estimated based on the average SBC as percentage of reported SG&A expenses, restructuring costs, and other one-time expenses, in fiscal years from 2015 to 2024, and trailing twelve months as of June 30, 2025, disregarding the highest and lowest observations. 9 Mid-cycle floorplan interest per dealership metric is derived based on considerations of the most recent trends in fiscal years from 2021 to 2024, and trailing twelve months as of June 30, 2025. 10 Adj. EBITDA margin is defined as Adjusted EBITDA as a percentage of total revenue. Adjusted gross profit margin is defined as Adjusted Gross Profit as a percentage of total revenue. 7 To be populated once Q3 final Significant Earnings Power on Current Dealership Count Updated mid-cycle scenario accounts for higher share, industry ASP trends, cycle volumes, gross margin improvement ($ in millions) FY17 Cycle-High F2Q25 TTM Current Cycle Mid-Cycle Adjustments6 Illustrative Mid-Cycle: F2Q25 Dealership Count7 Illustrative Mid-Cycle: Incremental Dealerships7 Period Ending RV Dealership Count 124 200 200 25 N.A. New RV Registrations1 472,000 350,000 Reflects higher rate environment ~400,000 Every 25 dealerships is expected to have the following contribution N.A. Used RV Registrations in a mid-cycle environment 1 689,000 715,000 Unchanged vs. prior ~800,000 CWH Total Units Sold 97,063 132,423 Reflects higher CWH share vs. prior, and return to industry ASP growth off lower base2 ~149,000 ~19,000 CWH Units per Dealership 783 662 ~740 ~740 $ in millions Total Revenue $4,280 $6,319 ~$7,200 ~$900 Total Adjusted Gross Profit4 $1,241 $1,897 Mid-cycle gross margin and expected improvement3,4 ~$2,230 ~$280 Adjusted Gross Profit Margin10 29% 30% ~31% ~31% Total Adjusted SG&A4 $824 $1,607 Mid-cycle SG&A as % of GP driven by inclusion of additional trough years into the calculation3,4 ~$1,675 ~$210 Adjusted SG&A Percent of Gross Profit5 66% 85% ~75% ~75% Total Floor Plan Interest Expense $28 $79 Mid-cycle floorplan per dealership9 ~$60 ~$8 Total Adj. EBITDA $394 $238 ~$5208 ~$658 Adj. EBITDA Margin10 9.2% 3.8% ~7% ~7% |
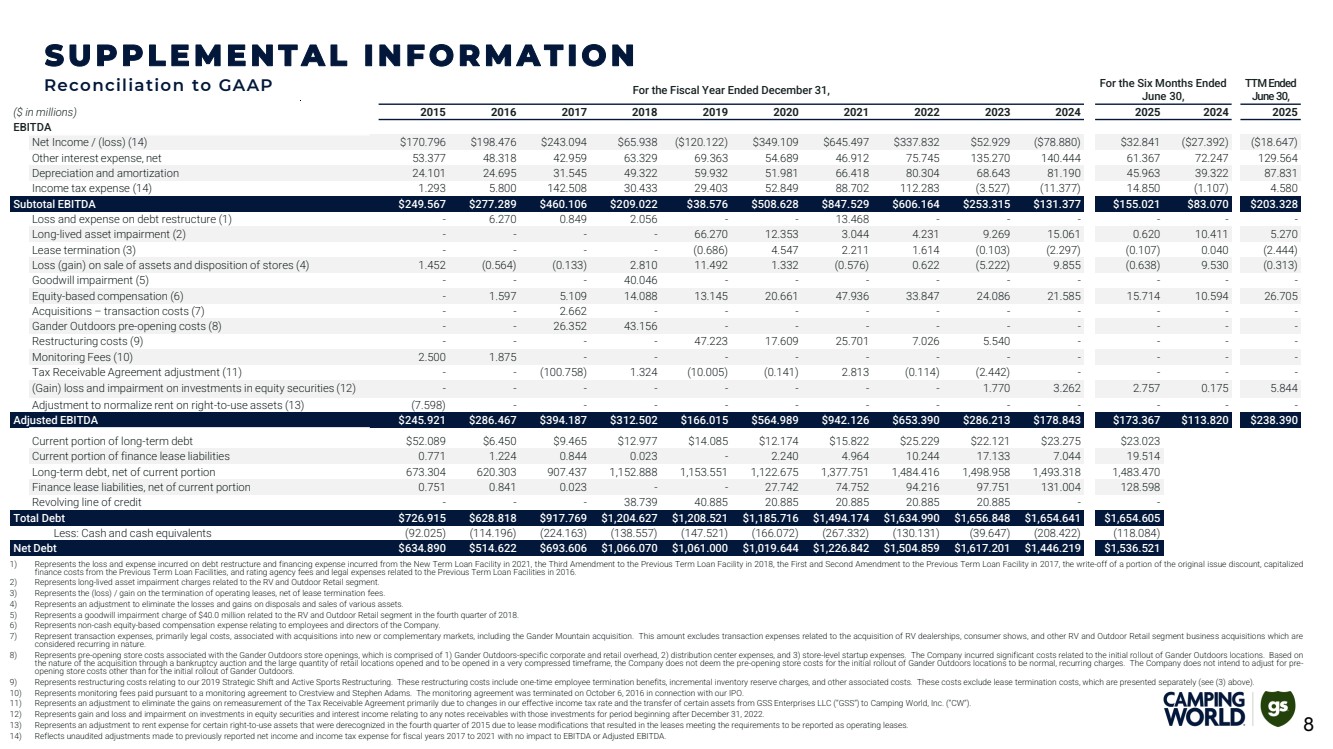
| For the Fiscal Year Ended December 31, For the Six Months Ended June 30, TTM Ended June 30, ($ in millions) 2015 2016 2017 2018 2019 2020 2021 2022 2023 2024 2025 2024 2025 EBITDA Net Income / (loss) (14) $170.796 $198.476 $243.094 $65.938 ($120.122) $349.109 $645.497 $337.832 $52.929 ($78.880) $32.841 ($27.392) ($18.647) Other interest expense, net 53.377 48.318 42.959 63.329 69.363 54.689 46.912 75.745 135.270 140.444 61.367 72.247 129.564 Depreciation and amortization 24.101 24.695 31.545 49.322 59.932 51.981 66.418 80.304 68.643 81.190 45.963 39.322 87.831 Income tax expense (14) 1.293 5.800 142.508 30.433 29.403 52.849 88.702 112.283 (3.527) (11.377) 14.850 (1.107) 4.580 Subtotal EBITDA $249.567 $277.289 $460.106 $209.022 $38.576 $508.628 $847.529 $606.164 $253.315 $131.377 $155.021 $83.070 $203.328 Loss and expense on debt restructure (1) - 6.270 0.849 2.056 - - 13.468 - - - - - - Long-lived asset impairment (2) - - - - 66.270 12.353 3.044 4.231 9.269 15.061 0.620 10.411 5.270 Lease termination (3) - - - - (0.686) 4.547 2.211 1.614 (0.103) (2.297) (0.107) 0.040 (2.444) Loss (gain) on sale of assets and disposition of stores (4) 1.452 (0.564) (0.133) 2.810 11.492 1.332 (0.576) 0.622 (5.222) 9.855 (0.638) 9.530 (0.313) Goodwill impairment (5) - - - 40.046 - - - - - - - - - Equity-based compensation (6) - 1.597 5.109 14.088 13.145 20.661 47.936 33.847 24.086 21.585 15.714 10.594 26.705 Acquisitions – transaction costs (7) - - 2.662 - - - - - - - - - - Gander Outdoors pre-opening costs (8) - - 26.352 43.156 - - - - - - - - - Restructuring costs (9) - - - - 47.223 17.609 25.701 7.026 5.540 - - - - Monitoring Fees (10) 2.500 1.875 - - - - - - - - - - - Tax Receivable Agreement adjustment (11) - - (100.758) 1.324 (10.005) (0.141) 2.813 (0.114) (2.442) - - - - (Gain) loss and impairment on investments in equity securities (12) - - - - - - - - 1.770 3.262 2.757 0.175 5.844 Adjustment to normalize rent on right-to-use assets (13) (7.598) - - - - - - - - - - - - Adjusted EBITDA $245.921 $286.467 $394.187 $312.502 $166.015 $564.989 $942.126 $653.390 $286.213 $178.843 $173.367 $113.820 $238.390 Current portion of long-term debt $52.089 $6.450 $9.465 $12.977 $14.085 $12.174 $15.822 $25.229 $22.121 $23.275 $23.023 Current portion of finance lease liabilities 0.771 1.224 0.844 0.023 - 2.240 4.964 10.244 17.133 7.044 19.514 Long-term debt, net of current portion 673.304 620.303 907.437 1,152.888 1,153.551 1,122.675 1,377.751 1,484.416 1,498.958 1,493.318 1,483.470 Finance lease liabilities, net of current portion 0.751 0.841 0.023 - - 27.742 74.752 94.216 97.751 131.004 128.598 Revolving line of credit - - - 38.739 40.885 20.885 20.885 20.885 20.885 - - Total Debt $726.915 $628.818 $917.769 $1,204.627 $1,208.521 $1,185.716 $1,494.174 $1,634.990 $1,656.848 $1,654.641 $1,654.605 Less: Cash and cash equivalents (92.025) (114.196) (224.163) (138.557) (147.521) (166.072) (267.332) (130.131) (39.647) (208.422) (118.084) Net Debt $634.890 $514.622 $693.606 $1,066.070 $1,061.000 $1,019.644 $1,226.842 $1,504.859 $1,617.201 $1,446.219 $1,536.521 1) Represents the loss and expense incurred on debt restructure and financing expense incurred from the New Term Loan Facility in 2021, the Third Amendment to the Previous Term Loan Facility in 2018, the First and Second Amendment to the Previous Term Loan Facility in 2017, the write-off of a portion of the original issue discount, capitalized finance costs from the Previous Term Loan Facilities, and rating agency fees and legal expenses related to the Previous Term Loan Facilities in 2016. 2) Represents long-lived asset impairment charges related to the RV and Outdoor Retail segment. 3) Represents the (loss) / gain on the termination of operating leases, net of lease termination fees. 4) Represents an adjustment to eliminate the losses and gains on disposals and sales of various assets. 5) Represents a goodwill impairment charge of $40.0 million related to the RV and Outdoor Retail segment in the fourth quarter of 2018. 6) Represents non-cash equity-based compensation expense relating to employees and directors of the Company. 7) Represent transaction expenses, primarily legal costs, associated with acquisitions into new or complementary markets, including the Gander Mountain acquisition. This amount excludes transaction expenses related to the acquisition of RV dealerships, consumer shows, and other RV and Outdoor Retail segment business acquisitions which are considered recurring in nature. 8) Represents pre-opening store costs associated with the Gander Outdoors store openings, which is comprised of 1) Gander Outdoors-specific corporate and retail overhead, 2) distribution center expenses, and 3) store-level startup expenses. The Company incurred significant costs related to the initial rollout of Gander Outdoors locations. Based on the nature of the acquisition through a bankruptcy auction and the large quantity of retail locations opened and to be opened in a very compressed timeframe, the Company does not deem the pre-opening store costs for the initial rollout of Gander Outdoors locations to be normal, recurring charges. The Company does not intend to adjust for pre-opening store costs other than for the initial rollout of Gander Outdoors. 9) Represents restructuring costs relating to our 2019 Strategic Shift and Active Sports Restructuring. These restructuring costs include one-time employee termination benefits, incremental inventory reserve charges, and other associated costs. These costs exclude lease termination costs, which are presented separately (see (3) above). 10) Represents monitoring fees paid pursuant to a monitoring agreement to Crestview and Stephen Adams. The monitoring agreement was terminated on October 6, 2016 in connection with our IPO. 11) Represents an adjustment to eliminate the gains on remeasurement of the Tax Receivable Agreement primarily due to changes in our effective income tax rate and the transfer of certain assets from GSS Enterprises LLC (“GSS”) to Camping World, Inc. (“CW”). 12) Represents gain and loss and impairment on investments in equity securities and interest income relating to any notes receivables with those investments for period beginning after December 31, 2022. 13) Represents an adjustment to rent expense for certain right-to-use assets that were derecognized in the fourth quarter of 2015 due to lease modifications that resulted in the leases meeting the requirements to be reported as operating leases. 14) Reflects unaudited adjustments made to previously reported net income and income tax expense for fiscal years 2017 to 2021 with no impact to EBITDA or Adjusted EBITDA. Reconciliation to GAAP SUPPLEMENTAL INFORMATION 8 |
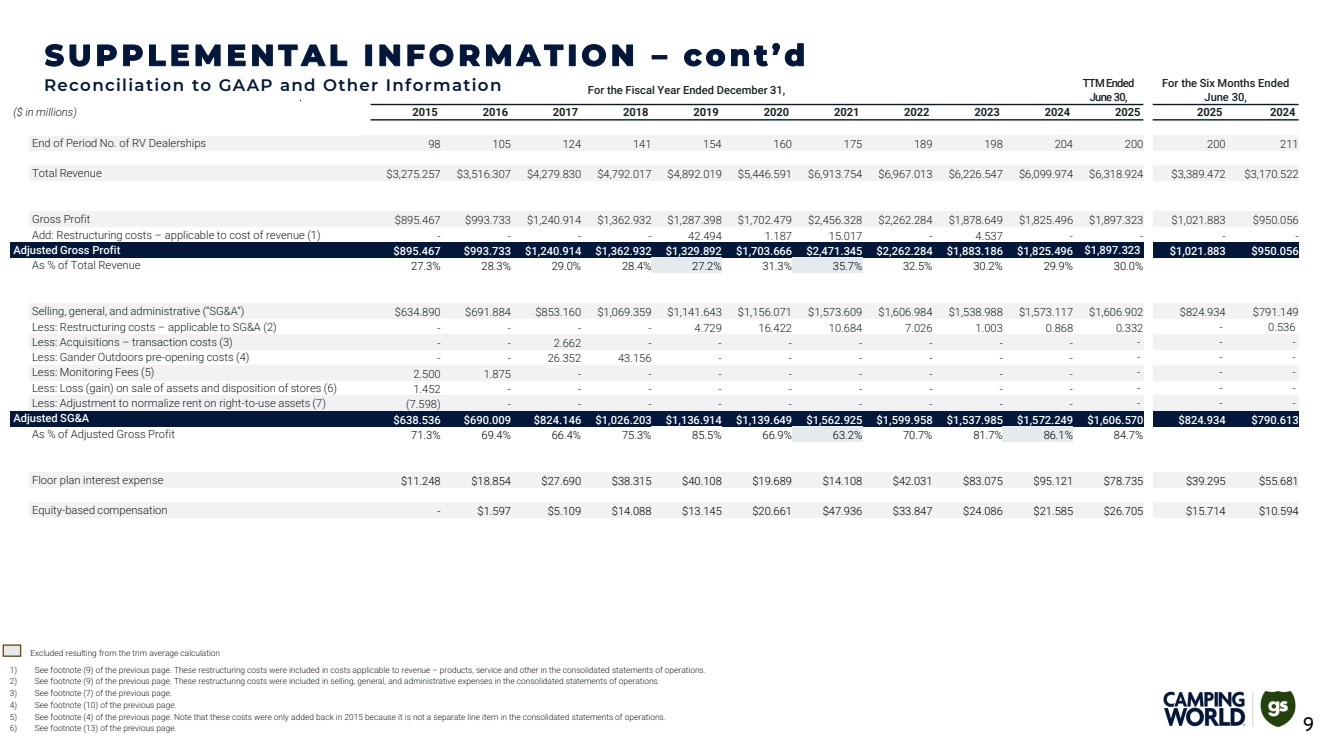
| 1) See footnote (9) of the previous page. These restructuring costs were included in costs applicable to revenue – products, service and other in the consolidated statements of operations. 2) See footnote (9) of the previous page. These restructuring costs were included in selling, general, and administrative expenses in the consolidated statements of operations. 3) See footnote (7) of the previous page. 4) See footnote (10) of the previous page. 5) See footnote (4) of the previous page. Note that these costs were only added back in 2015 because it is not a separate line item in the consolidated statements of operations. 6) See footnote (13) of the previous page. For the Fiscal Year Ended December 31, TTM Ended June 30, For the Six Months Ended June 30, ($ in millions) 2015 2016 2017 2018 2019 2020 2021 2022 2023 2024 2025 2025 2024 End of Period No. of RV Dealerships 98 105 124 141 154 160 175 189 198 204 200 200 211 Total Revenue $3,275.257 $3,516.307 $4,279.830 $4,792.017 $4,892.019 $5,446.591 $6,913.754 $6,967.013 $6,226.547 $6,099.974 $6,318.924 $3,389.472 $3,170.522 Gross Profit $895.467 $993.733 $1,240.914 $1,362.932 $1,287.398 $1,702.479 $2,456.328 $2,262.284 $1,878.649 $1,825.496 $1,897.323 $1,021.883 $950.056 Add: Restructuring costs – applicable to cost of revenue (1) - - - - 42.494 1.187 15.017 - 4.537 - - - - Adjusted Gross Profit $895.467 $993.733 $1,240.914 $1,362.932 $1,329.892 $1,703.666 $2,471.345 $2,262.284 $1,883.186 $1,825.496 $1,897.323 $1,021.883 $950.056 As % of Total Revenue 27.3% 28.3% 29.0% 28.4% 27.2% 31.3% 35.7% 32.5% 30.2% 29.9% 30.0% Selling, general, and administrative (“SG&A”) $634.890 $691.884 $853.160 $1,069.359 $1,141.643 $1,156.071 $1,573.609 $1,606.984 $1,538.988 $1,573.117 $1,606.902 $824.934 $791.149 Less: Restructuring costs – applicable to SG&A (2) - - - - 4.729 16.422 10.684 7.026 1.003 0.868 0.332 - 0.536 Less: Acquisitions – transaction costs (3) - - 2.662 - - - - - - - - - - Less: Gander Outdoors pre-opening costs (4) - - 26.352 43.156 - - - - - - - - - Less: Monitoring Fees (5) 2.500 1.875 - - - - - - - - - - - Less: Loss (gain) on sale of assets and disposition of stores (6) 1.452 - - - - - - - - - - - - Less: Adjustment to normalize rent on right-to-use assets (7) (7.598) - - - - - - - - - - - - Adjusted SG&A $638.536 $690.009 $824.146 $1,026.203 $1,136.914 $1,139.649 $1,562.925 $1,599.958 $1,537.985 $1,572.249 $1,606.570 $824.934 $790.613 As % of Adjusted Gross Profit 71.3% 69.4% 66.4% 75.3% 85.5% 66.9% 63.2% 70.7% 81.7% 86.1% 84.7% Floor plan interest expense $11.248 $18.854 $27.690 $38.315 $40.108 $19.689 $14.108 $42.031 $83.075 $95.121 $78.735 $39.295 $55.681 Equity-based compensation - $1.597 $5.109 $14.088 $13.145 $20.661 $47.936 $33.847 $24.086 $21.585 $26.705 $15.714 $10.594 Reconciliation to GAAP and Other Information SUPPLEMENTAL INFORMATION – c o n t ’d Excluded resulting from the trim average calculation 9 |