Performance Management - Philotimo Focused Growth and Income Fund
|
Jul. 29, 2025 |
| Prospectus [Line Items] |
|
| Bar Chart and Performance Table [Heading] |
Performance
Information
|
| Performance Narrative [Text Block] |
The
bar chart and table below provide some indication of the risks of investing in the Fund by showing the Fund’s performance
from year to year and by showing how the Fund’s average annual returns for the periods indicated compare with those of a
broad-based securities market index, the Russell 3000® Index, and the Russell 2000® Index, which is the Fund’s secondary
benchmark index. The Fund’s past performance (before and after taxes) is not necessarily an indication of how the Fund will
perform in the future. Updated performance information is available by calling toll-free 800-673-0550.
|
| Performance Past Does Not Indicate Future [Text] |
The Fund’s past performance (before and after taxes) is not necessarily an indication of how the Fund will
perform in the future.
|
| Performance Information Illustrates Variability of Returns [Text] |
The
bar chart and table below provide some indication of the risks of investing in the Fund by showing the Fund’s performance
from year to year and by showing how the Fund’s average annual returns for the periods indicated compare with those of a
broad-based securities market index, the Russell 3000® Index, and the Russell 2000® Index, which is the Fund’s secondary
benchmark index.
|
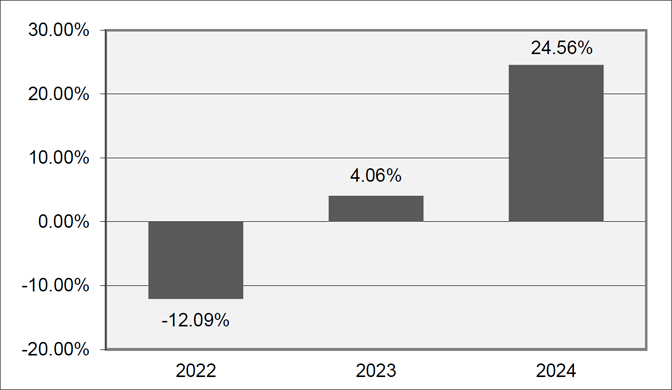
| Bar Chart [Heading] |
Year
By Year Annual Returns
|
| Bar Chart [Table] |
| Years |
Returns |
| 2022 |
-12.09% |
| 2023 |
4.06% |
| 2024 |
24.56% |
|
| Bar Chart Closing [Text Block] |
During
the periods shown in the bar chart, the Fund’s highest return for a calendar quarter was 24.14% (quarter ended 12/31/2024)
and the Fund’s lowest return for a calendar quarter was -15.54% (quarter ended 06/30/2022).
The
year-to-date return of the Fund as of June 30, 2025 was -7.43%.
|
| Year to Date Return, Label [Optional Text] |
The
year-to-date return of the Fund
|
| Bar Chart, Year to Date Return |
(7.43%)
|
| Bar Chart, Year to Date Return, Date |
Jun. 30, 2025
|
| Highest Quarterly Return, Label [Optional Text] |
highest return for a calendar quarter
|
| Highest Quarterly Return |
24.14%
|
| Highest Quarterly Return, Date |
Dec. 31, 2024
|
| Lowest Quarterly Return, Label [Optional Text] |
lowest return for a calendar quarter
|
| Lowest Quarterly Return |
(15.54%)
|
| Lowest Quarterly Return, Date |
Jun. 30, 2022
|
| Performance Table Heading |
Average
Annual Total Returns as of December 31, 2024
|
| Performance [Table] |
| |
|
|
| Average
Annual Total Returns as of December 31, 2024 |
| |
1
Year |
Since
Inception (8/20/2021) |
| Return
Before Taxes |
24.56% |
5.21% |
| Return
After Taxes on Distributions |
23.73% |
4.21% |
| Return
After Taxes on Distributions and Sale of Fund Shares |
14.54% |
3.64% |
| Russell
3000® Index (reflects no deduction for fees, expenses or taxes)1 |
23.81% |
9.20% |
| Russell
2000® Index (reflects no deduction for fees, expenses or taxes) |
11.54% |
2.29% |
| 1 |
In connection with the newly adopted SEC regulations applicable
to the Fund, the Russell 3000® Index is the Fund’s broad-based securities market index. The Fund will continue to
show the performance for the Russell 2000® Index, the Fund’s previous broad-based securities market index. |
|
| Index No Deduction for Fees, Expenses, or Taxes [Text] |
(reflects no deduction for fees, expenses or taxes)
|
| Performance Availability Phone [Text] |
800-673-0550
|