Pay vs Performance Disclosure - USD ($)
Mar. 31, 2025
Mar. 31, 2024
Mar. 31, 2023
Mar. 31, 2022
Mar. 31, 2021
Pay Versus Performance Table
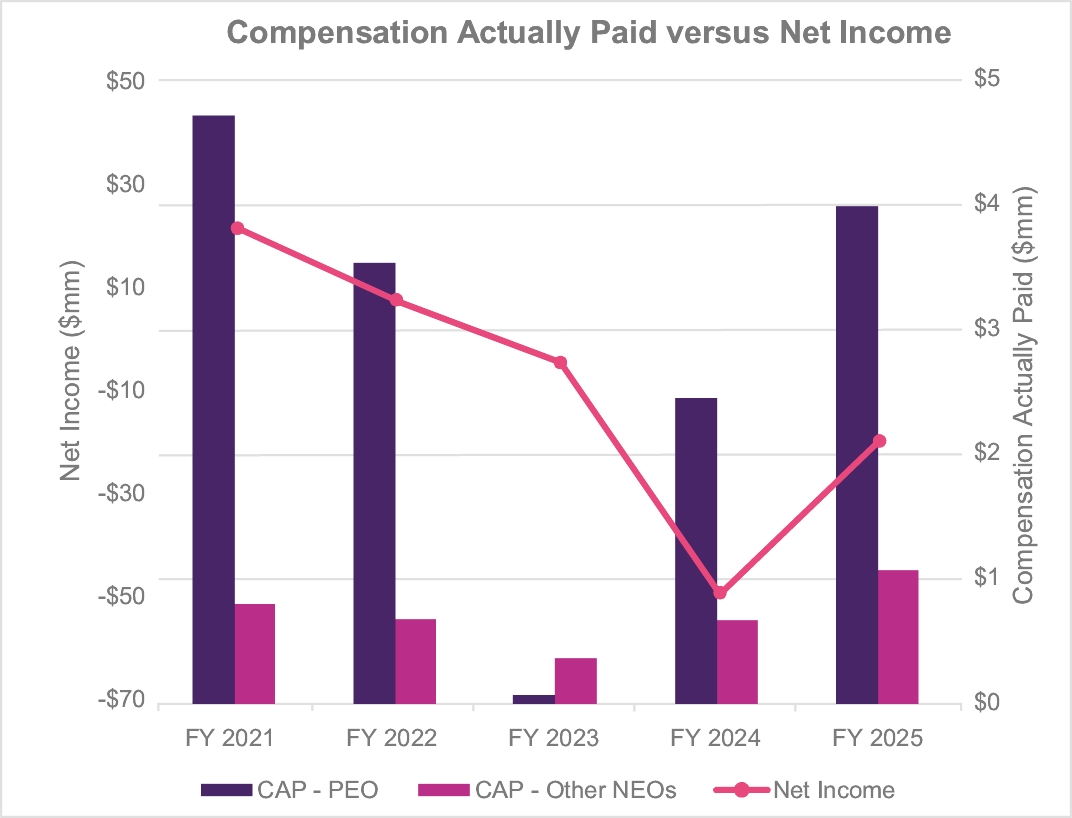
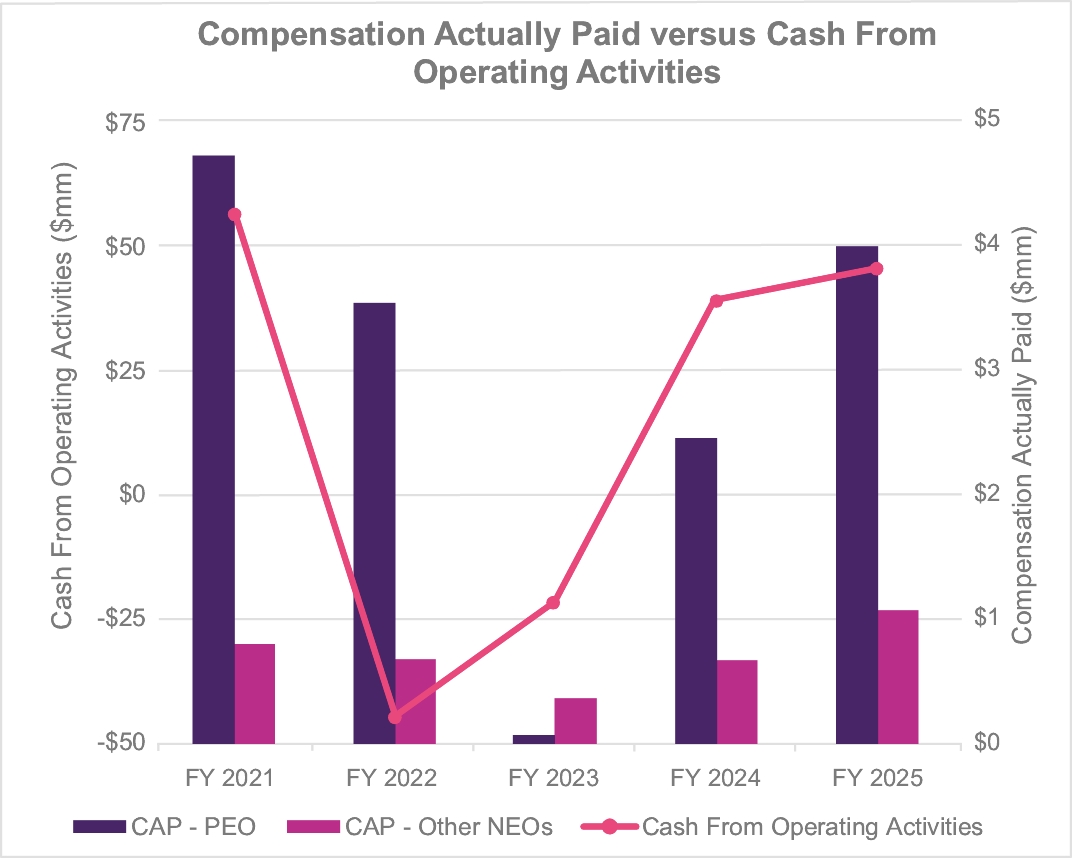
The following table sets forth information concerning the compensation of our named executive officers (NEOs) for each of the fiscal years ended March 31, 2021, 2022, 2023, 2024, and 2025, and our financial performance for each such fiscal year:
Year | Summary Compensation Table Total for PEO ($) | Compensation Actually Paid to PEO ($)(1)(2) | Average Summary Compensation Table Total for Non-PEO NEOs ($) | Average Compensation Actually Paid to Non-PEO NEOs ($)(1)(2) | Value of Initial Fixed $100 Investment Based on: | |||||||||||||||||||
Total Shareholder Return ($) | Peer Group Total Shareholder Return ($)(3) | Net Income ($M) | Cash from Operating Activities ($M)(4) | |||||||||||||||||||||
2025 | $3,232,021 | $3,988,342 | $894,247 | $1,069,950 | $75 | $264 | ($19) | $45 | ||||||||||||||||
2024 | $2,526,062 | $2,450,091 | $674,126 | $668,556 | $64 | $258 | ($49) | $39 | ||||||||||||||||
2023 | $2,830,752 | $69,201 | $630,959 | $364,826 | $59 | $234 | ($4) | ($22) | ||||||||||||||||
2022 | $4,334,649 | $3,535,526 | $776,186 | $677,328 | $142 | $222 | $7 | ($45) | ||||||||||||||||
2021 | $4,674,829 | $4,715,471 | $627,465 | $800,010 | $179 | $179 | $21 | $56 | ||||||||||||||||
(1) | Amounts represent compensation actually paid to our PEO and the average compensation actually paid to our remaining NEOs for the relevant fiscal year, as determined under SEC rules (and described below), which includes the individuals indicated in the table below for each fiscal year: |
Year | PEO | Non-PEO NEOs | ||||
2025 | Selwyn Joffe | David Lee, Doug Schooner, Juliet Stone, and Kamlesh Shah | ||||
2024 | Selwyn Joffe | David Lee, Doug Schooner, Juliet Stone, and Kamlesh Shah | ||||
2023 | Selwyn Joffe | David Lee, Richard Mochulsky, Doug Schooner, and Juliet Stone | ||||
2022 | Selwyn Joffe | David Lee, Richard Mochulsky, Doug Schooner, and Juliet Stone | ||||
2021 | Selwyn Joffe | David Lee, Richard Mochulsky, Doug Schooner, and Juliet Stone | ||||
Compensation actually paid to our NEOs represents the “Total” compensation reported in the Summary Compensation Table for the applicable fiscal year, as adjusted as follows:
2025 | ||||||
Adjustments | PEO | Average Non- PEO NEOs | ||||
Deduction for Amounts Reported under the “Stock Awards” and “Option Awards” Columns in the Summary Compensation Table for Applicable FY | ($1,161,097) | ($277,026) | ||||
Increase based on ASC 718 Fair Value of Awards Granted during Applicable FY that Remain Unvested as of Applicable FY End, determined as of Applicable FY End | $1,704,465 | $406,667 | ||||
Increase based on ASC 718 Fair Value of Awards Granted during Applicable FY that Vested during Applicable FY, determined as of Vesting Date | $0 | $0 | ||||
Increase/deduction for Awards Granted during Prior FY that were Outstanding and Unvested as of Applicable FY End, determined based on change in ASC 718 Fair Value from Prior FY End to Applicable FY End | $112,488 | $16,679 | ||||
Increase/deduction for Awards Granted during Prior FY that Vested During Applicable FY, determined based on change in ASC 718 Fair Value from Prior FY End to Vesting Date | $100,465 | $29,382 | ||||
Deduction of ASC 718 Fair Value of Awards Granted during Prior FY that were Forfeited during Applicable FY, determined as of Prior FY End | n/a | n/a | ||||
Increase based on Dividends or Other Earnings Paid during Applicable FY prior to Vesting Date | n/a | n/a | ||||
Increase based on Incremental Fair Value of Options/SARs Modified during Applicable FY | n/a | n/a | ||||
Deduction for Change in the Actuarial Present Values reported under the “Change in Pension Value and Nonqualified Deferred Compensation Earnings” Column of the Summary Compensation Table for Applicable FY | n/a | n/a | ||||
Increase for Service Cost and, if applicable, Prior Service Cost for Pension Plans | n/a | n/a | ||||
TOTAL ADJUSTMENTS | $756,321 | $175,703 | ||||
(2) | Fair value or change in fair value, as applicable, of equity awards in the “Compensation Actually Paid” columns was determined by reference to (i) for solely service-vesting RSU awards, the closing price per share on the applicable year-end date(s) or, in the case of vesting dates, the closing price per share on the applicable vesting date(s); (ii) for performance-based RSU/RS awards (excluding any market-based awards), the same valuation methodology as RS/RSU awards above except that the year-end values are multiplied by the probability of achievement of the applicable performance objective as of the applicable date; (iii) for market-based awards, the fair value calculated by a Monte Carlo simulation model as of the applicable year-end date(s), which utilizes multiple input variables, including expected volatility of our stock price and other assumptions appropriate for determining fair value, to estimate the probability of satisfying the performance objective established for the award, including the expected volatility of our stock price relative to the applicable comparative index and a risk-free interest rate derived from linear interpolation of the term structure of Treasury Constant Maturities yield rates for the applicable period and (iv) for stock options, a Black Scholes value as of the applicable year-end or vesting date(s), determined based on the same |
methodology as used to determine grant date fair value but using the closing stock price on the applicable revaluation date as the current market price and with an expected life set equal to the remaining life of the award in the case of underwater stock options and, in the case of in the money options, an expected life equal to the original ratio of expected life relative to the ten year contractual life multiplied times the remaining life as of the applicable revaluation date, and in all cases based on volatility and risk free rates determined as of the revaluation date based on the expected life period and based on an expected dividend rate of 0%. For additional information on the assumptions used to calculate the valuation of the awards, see the Notes to Consolidated Financial Statements in our Annual Report on Form 10-K for the fiscal year ended March 31, 2025 and prior fiscal years.
(3) | For the relevant fiscal year, represents the cumulative TSR (the “Peer Group TSR”) of the Zacks Retail and Wholesale Auto Parts Index. |
(4) | Cash from operating activities is a GAAP measure. An explanation of how the Company determines cash from operating activities is included in Appendix A and ties to the Company’s 8-K filing, of the press release to our earnings release made on June 9, 2025. |
(1) | Amounts represent compensation actually paid to our PEO and the average compensation actually paid to our remaining NEOs for the relevant fiscal year, as determined under SEC rules (and described below), which includes the individuals indicated in the table below for each fiscal year: |
Year | PEO | Non-PEO NEOs | ||||
2025 | Selwyn Joffe | David Lee, Doug Schooner, Juliet Stone, and Kamlesh Shah | ||||
2024 | Selwyn Joffe | David Lee, Doug Schooner, Juliet Stone, and Kamlesh Shah | ||||
2023 | Selwyn Joffe | David Lee, Richard Mochulsky, Doug Schooner, and Juliet Stone | ||||
2022 | Selwyn Joffe | David Lee, Richard Mochulsky, Doug Schooner, and Juliet Stone | ||||
2021 | Selwyn Joffe | David Lee, Richard Mochulsky, Doug Schooner, and Juliet Stone | ||||
(3) | For the relevant fiscal year, represents the cumulative TSR (the “Peer Group TSR”) of the Zacks Retail and Wholesale Auto Parts Index. |
Compensation actually paid to our NEOs represents the “Total” compensation reported in the Summary Compensation Table for the applicable fiscal year, as adjusted as follows:
2025 | ||||||
Adjustments | PEO | Average Non- PEO NEOs | ||||
Deduction for Amounts Reported under the “Stock Awards” and “Option Awards” Columns in the Summary Compensation Table for Applicable FY | ($1,161,097) | ($277,026) | ||||
Increase based on ASC 718 Fair Value of Awards Granted during Applicable FY that Remain Unvested as of Applicable FY End, determined as of Applicable FY End | $1,704,465 | $406,667 | ||||
Increase based on ASC 718 Fair Value of Awards Granted during Applicable FY that Vested during Applicable FY, determined as of Vesting Date | $0 | $0 | ||||
Increase/deduction for Awards Granted during Prior FY that were Outstanding and Unvested as of Applicable FY End, determined based on change in ASC 718 Fair Value from Prior FY End to Applicable FY End | $112,488 | $16,679 | ||||
Increase/deduction for Awards Granted during Prior FY that Vested During Applicable FY, determined based on change in ASC 718 Fair Value from Prior FY End to Vesting Date | $100,465 | $29,382 | ||||
Deduction of ASC 718 Fair Value of Awards Granted during Prior FY that were Forfeited during Applicable FY, determined as of Prior FY End | n/a | n/a | ||||
Increase based on Dividends or Other Earnings Paid during Applicable FY prior to Vesting Date | n/a | n/a | ||||
Increase based on Incremental Fair Value of Options/SARs Modified during Applicable FY | n/a | n/a | ||||
Deduction for Change in the Actuarial Present Values reported under the “Change in Pension Value and Nonqualified Deferred Compensation Earnings” Column of the Summary Compensation Table for Applicable FY | n/a | n/a | ||||
Increase for Service Cost and, if applicable, Prior Service Cost for Pension Plans | n/a | n/a | ||||
TOTAL ADJUSTMENTS | $756,321 | $175,703 | ||||
(2) | Fair value or change in fair value, as applicable, of equity awards in the “Compensation Actually Paid” columns was determined by reference to (i) for solely service-vesting RSU awards, the closing price per share on the applicable year-end date(s) or, in the case of vesting dates, the closing price per share on the applicable vesting date(s); (ii) for performance-based RSU/RS awards (excluding any market-based awards), the same valuation methodology as RS/RSU awards above except that the year-end values are multiplied by the probability of achievement of the applicable performance objective as of the applicable date; (iii) for market-based awards, the fair value calculated by a Monte Carlo simulation model as of the applicable year-end date(s), which utilizes multiple input variables, including expected volatility of our stock price and other assumptions appropriate for determining fair value, to estimate the probability of satisfying the performance objective established for the award, including the expected volatility of our stock price relative to the applicable comparative index and a risk-free interest rate derived from linear interpolation of the term structure of Treasury Constant Maturities yield rates for the applicable period and (iv) for stock options, a Black Scholes value as of the applicable year-end or vesting date(s), determined based on the same |
methodology as used to determine grant date fair value but using the closing stock price on the applicable revaluation date as the current market price and with an expected life set equal to the remaining life of the award in the case of underwater stock options and, in the case of in the money options, an expected life equal to the original ratio of expected life relative to the ten year contractual life multiplied times the remaining life as of the applicable revaluation date, and in all cases based on volatility and risk free rates determined as of the revaluation date based on the expected life period and based on an expected dividend rate of 0%. For additional information on the assumptions used to calculate the valuation of the awards, see the Notes to Consolidated Financial Statements in our Annual Report on Form 10-K for the fiscal year ended March 31, 2025 and prior fiscal years.
Pay Versus Performance Tabular List
We believe the following performance measures represent the most important financial performance measures used by us to link compensation actually paid to our NEOs for the fiscal year ended March 31, 2025:
• | Cash from Operating Activities; |
• | Net Sales; |
• | Relative Total Shareholder Return; and |
• | Net Income after adjustments |
For additional details regarding our most important financial performance measures, please see the introduction to our Compensation Discussion and Analysis (CD&A), as well as the sections titled “Actions Taken” and “Say on Pay Vote” elsewhere in this Proxy Statement.