Exhibit 99.1

Q2 2025 Update July 29th, 2025
Table of Contents Key Highlights Financial Summary MAUs &
Subscribers Product & Platform Outlook Financial Statements Executive Summary p.03 p.04 p.06 p.14 p.17 p.21 p.24
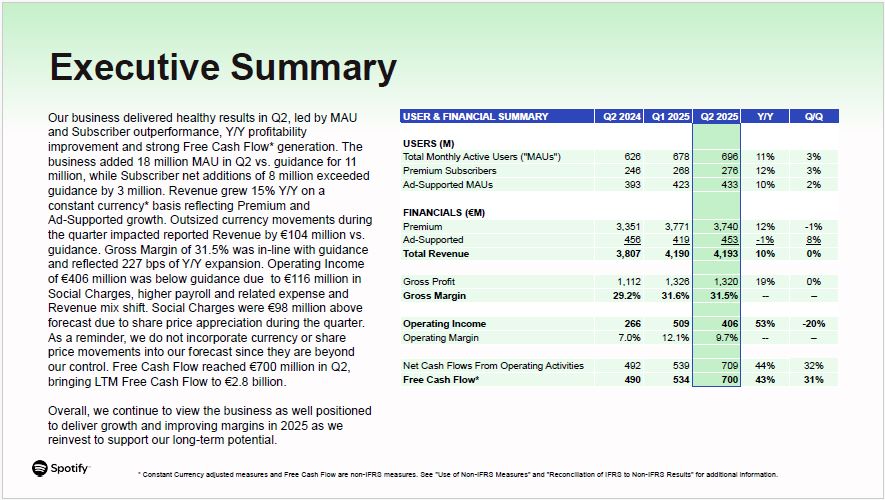
Executive Summary USER & FINANCIAL SUMMARY Q2 2024 Q1 2025 Q2
2025 Y/Y Q/Q USERS (M) Total Monthly Active Users ("MAUs") 626 678 696 11% 3% Premium Subscribers 246 268 276 12% 3% Ad-Supported MAUs 393 423 433 10% 2% FINANCIALS
(€M) Premium 3,351 3,771 3,740 12% -1% Ad-Supported 456 419 453 -1% 8% Total Revenue 3,807 4,190 4,193 10% 0% Gross Profit 1,112 1,326 1,320 19% 0% Gross Margin 29.2% 31.6% 31.5% -- -- Operating
Income 266 509 406 53% -20% Operating Margin 7.0% 12.1% 9.7% -- -- Net Cash Flows From Operating Activities 492 539 709 44% 32% Free Cash Flow* 490 534 700 43% 31% * Constant Currency adjusted measures and Free Cash
Flow are non-IFRS measures. See "Use of Non-IFRS Measures" and "Reconciliation of IFRS to Non-IFRS Results" for additional information. Our business delivered healthy results in Q2, led by MAU and Subscriber outperformance, Y/Y
profitability improvement and strong Free Cash Flow* generation. The business added 18 million MAU in Q2 vs. guidance for 11 million, while Subscriber net additions of 8 million exceeded guidance by 3 million. Revenue grew 15% Y/Y on a
constant currency* basis reflecting Premium and Ad-Supported growth. Outsized currency movements during the quarter impacted reported Revenue by €104 million vs. guidance. Gross Margin of 31.5% was in-line with guidance and reflected 227
bps of Y/Y expansion. Operating Income of €406 million was below guidance due to €116 million in Social Charges, higher payroll and related expense and Revenue mix shift. Social Charges were €98 million above forecast due to share price
appreciation during the quarter. As a reminder, we do not incorporate currency or share price movements into our forecast since they are beyond our control. Free Cash Flow reached €700 million in Q2, bringing LTM Free Cash Flow to €2.8
billion. Overall, we continue to view the business as well positioned to deliver growth and improving margins in 2025 as we reinvest to support our long-term potential.
* Constant Currency adjusted measures and Free Cash Flow are non-IFRS
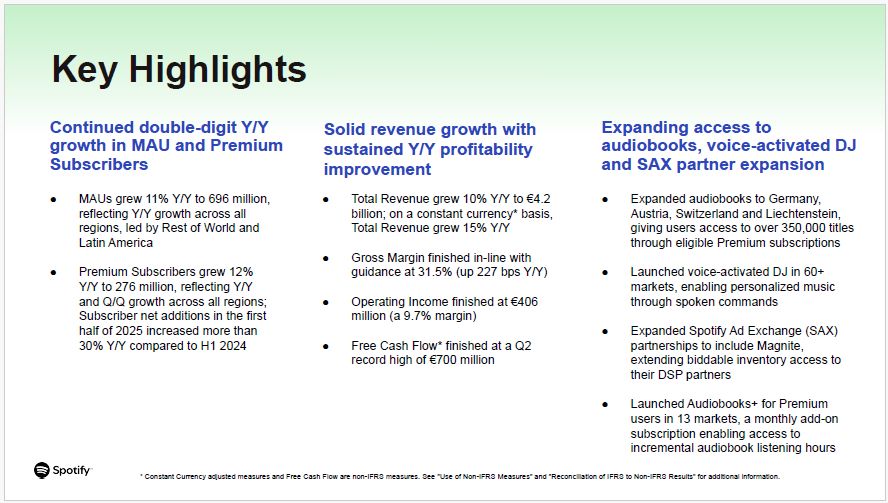
measures. See "Use of Non-IFRS Measures" and "Reconciliation of IFRS to Non-IFRS Results" for additional information. Continued double-digit Y/Y growth in MAU and Premium Subscribers Expanded audiobooks to Germany, Austria, Switzerland
and Liechtenstein, giving users access to over 350,000 titles through eligible Premium subscriptions Launched voice-activated DJ in 60+ markets, enabling personalized music through spoken commands Expanded Spotify Ad Exchange (SAX)
partnerships to include Magnite, extending biddable inventory access to their DSP partners Launched Audiobooks+ for Premium users in 13 markets, a monthly add-on subscription enabling access to incremental audiobook listening hours Key
Highlights Solid revenue growth with sustained Y/Y profitability improvement Total Revenue grew 10% Y/Y to €4.2 billion; on a constant currency* basis, Total Revenue grew 15% Y/Y Gross Margin finished in-line with guidance at 31.5% (up
227 bps Y/Y) Operating Income finished at €406 million (a 9.7% margin) Free Cash Flow* finished at a Q2 record high of €700 million Expanding access to audiobooks, voice-activated DJ and SAX partner expansion MAUs grew 11% Y/Y to 696
million, reflecting Y/Y growth across all regions, led by Rest of World and Latin America Premium Subscribers grew 12% Y/Y to 276 million, reflecting Y/Y and Q/Q growth across all regions; Subscriber net additions in the first half of 2025
increased more than 30% Y/Y compared to H1 2024
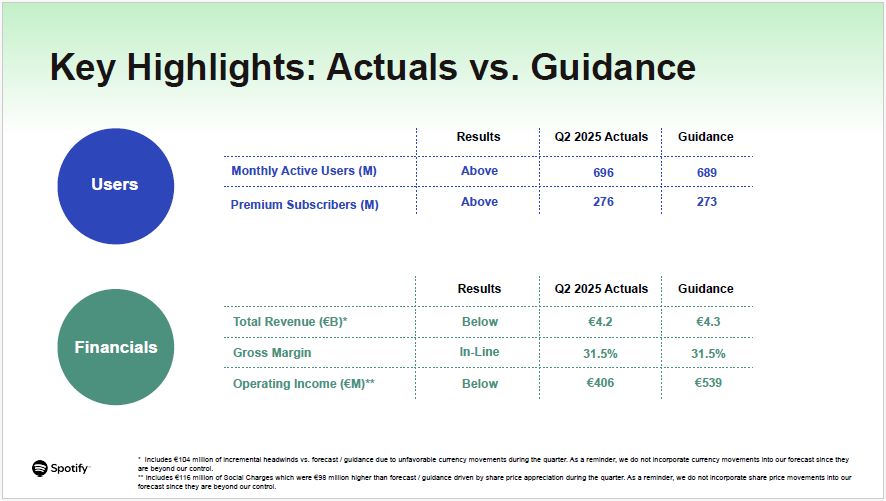
Results Q2 2025 Actuals Guidance Total Revenue
(€B)* Below €4.2 €4.3 Gross Margin In-Line 31.5% 31.5% Operating Income (€M)** Below €406 €539 Key Highlights: Actuals vs. Guidance Users Results Q2 2025 Actuals Guidance Monthly Active Users (M) Above 696 689 Premium
Subscribers (M) Above 276 273 Financials * Includes €104 million of incremental headwinds vs. forecast / guidance due to unfavorable currency movements during the quarter. As a reminder, we do not incorporate currency movements into
our forecast since they are beyond our control. ** Includes €116 million of Social Charges which were €98 million higher than forecast / guidance driven by share price appreciation during the quarter. As a reminder, we do not incorporate
share price movements into our forecast since they are beyond our control.

FINANCIAL SUMMARY
USER, FINANCIAL & LIQUIDITY SUMMARY Q2 2024 Q3 2024 Q4 2024 Q1 2025 Q2
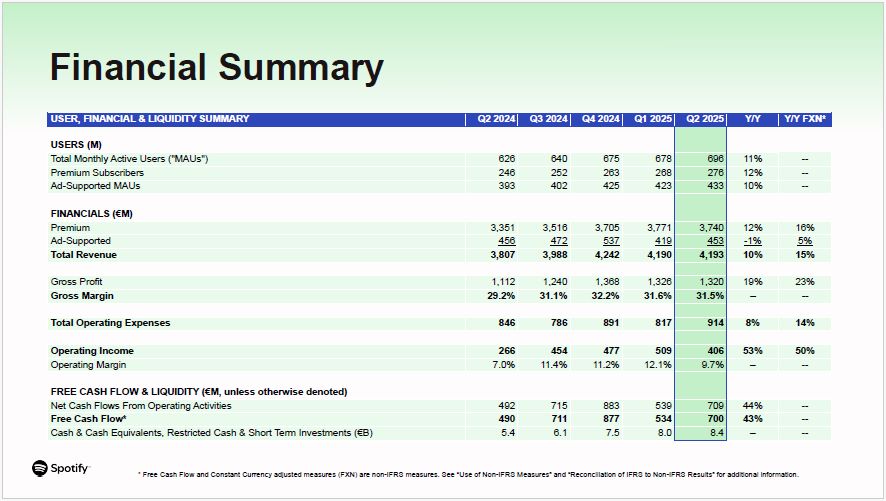
2025 Y/Y Y/Y FXN* USERS (M) Total Monthly Active Users ("MAUs") 626 640 675 678 696 11% -- Premium Subscribers 246 252 263 268 276 12% -- Ad-Supported MAUs 393 402 425 423 433 10% -- FINANCIALS
(€M) Premium 3,351 3,516 3,705 3,771 3,740 12% 16% Ad-Supported 456 472 537 419 453 -1% 5% Total Revenue 3,807 3,988 4,242 4,190 4,193 10% 15% Gross Profit 1,112 1,240 1,368 1,326 1,320 19% 23% Gross
Margin 29.2% 31.1% 32.2% 31.6% 31.5% -- -- Total Operating Expenses 846 786 891 817 914 8% 14% Operating Income 266 454 477 509 406 53% 50% Operating Margin 7.0% 11.4% 11.2% 12.1% 9.7% -- -- FREE CASH FLOW
& LIQUIDITY (€M, unless otherwise denoted) Net Cash Flows From Operating Activities 492 715 883 539 709 44% -- Free Cash Flow* 490 711 877 534 700 43% -- Cash & Cash Equivalents, Restricted Cash & Short Term
Investments (€B) 5.4 6.1 7.5 8.0 8.4 -- -- Financial Summary * Free Cash Flow and Constant Currency adjusted measures (FXN) are non-IFRS measures. See “Use of Non-IFRS Measures” and “Reconciliation of IFRS to Non-IFRS Results” for
additional information.
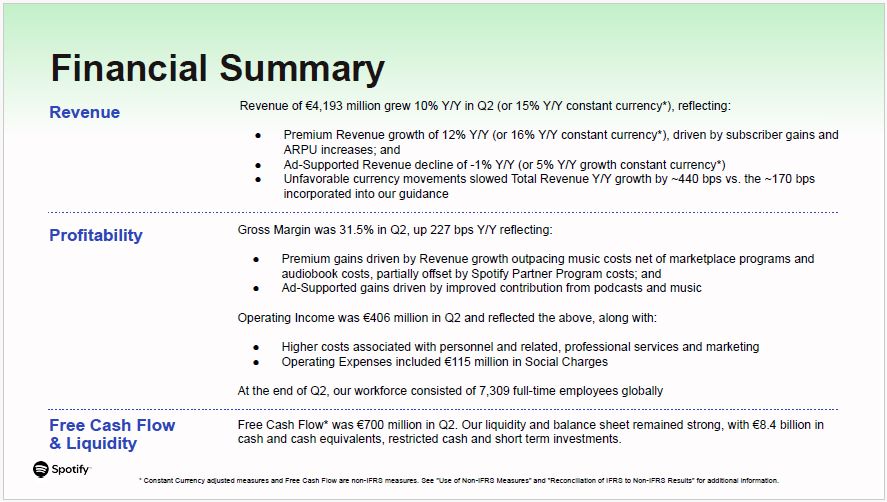
Revenue Profitability Free Cash Flow & Liquidity Gross Margin was 31.5%
in Q2, up 227 bps Y/Y reflecting: Premium gains driven by Revenue growth outpacing music costs net of marketplace programs and audiobook costs, partially offset by Spotify Partner Program costs; and Ad-Supported gains driven by improved
contribution from podcasts and music Operating Income was €406 million in Q2 and reflected the above, along with: Higher costs associated with personnel and related, professional services and marketing Operating Expenses included €115
million in Social Charges At the end of Q2, our workforce consisted of 7,309 full-time employees globally Revenue of €4,193 million grew 10% Y/Y in Q2 (or 15% Y/Y constant currency*), reflecting: Premium Revenue growth of 12% Y/Y (or 16%
Y/Y constant currency*), driven by subscriber gains and ARPU increases; and Ad-Supported Revenue decline of -1% Y/Y (or 5% Y/Y growth constant currency*) Unfavorable currency movements slowed Total Revenue Y/Y growth by ~440 bps vs. the
~170 bps incorporated into our guidance Free Cash Flow* was €700 million in Q2. Our liquidity and balance sheet remained strong, with €8.4 billion in cash and cash equivalents, restricted cash and short term investments. Financial
Summary * Constant Currency adjusted measures and Free Cash Flow are non-IFRS measures. See "Use of Non-IFRS Measures" and "Reconciliation of IFRS to Non-IFRS Results" for additional information.
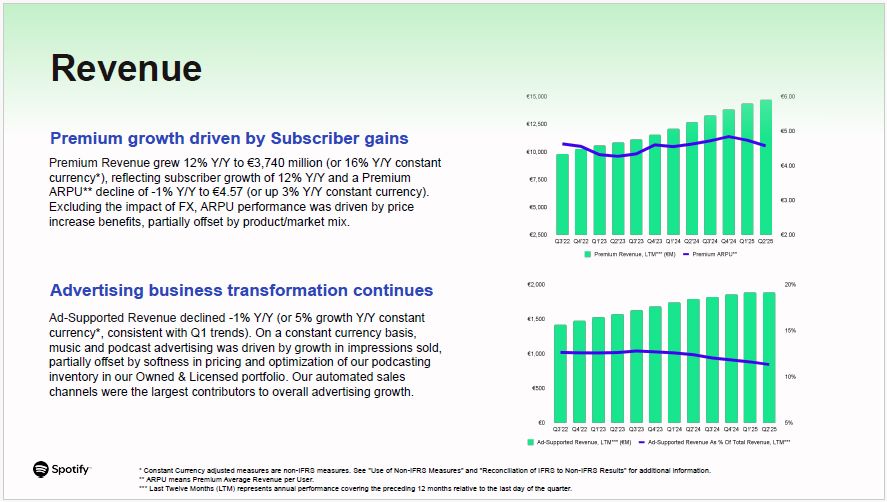
Advertising business transformation continues Ad-Supported Revenue declined
-1% Y/Y (or 5% growth Y/Y constant currency*, consistent with Q1 trends). On a constant currency basis, music and podcast advertising was driven by growth in impressions sold, partially offset by softness in pricing and optimization of our
podcasting inventory in our Owned & Licensed portfolio. Our automated sales channels were the largest contributors to overall advertising growth. Revenue * Constant Currency adjusted measures are non-IFRS measures. See "Use of
Non-IFRS Measures" and "Reconciliation of IFRS to Non-IFRS Results" for additional information. ** ARPU means Premium Average Revenue per User. *** Last Twelve Months (LTM) represents annual performance covering the preceding 12 months
relative to the last day of the quarter. Premium growth driven by Subscriber gains Premium Revenue grew 12% Y/Y to €3,740 million (or 16% Y/Y constant currency*), reflecting subscriber growth of 12% Y/Y and a Premium ARPU** decline of -1%
Y/Y to €4.57 (or up 3% Y/Y constant currency). Excluding the impact of FX, ARPU performance was driven by price increase benefits, partially offset by product/market mix.
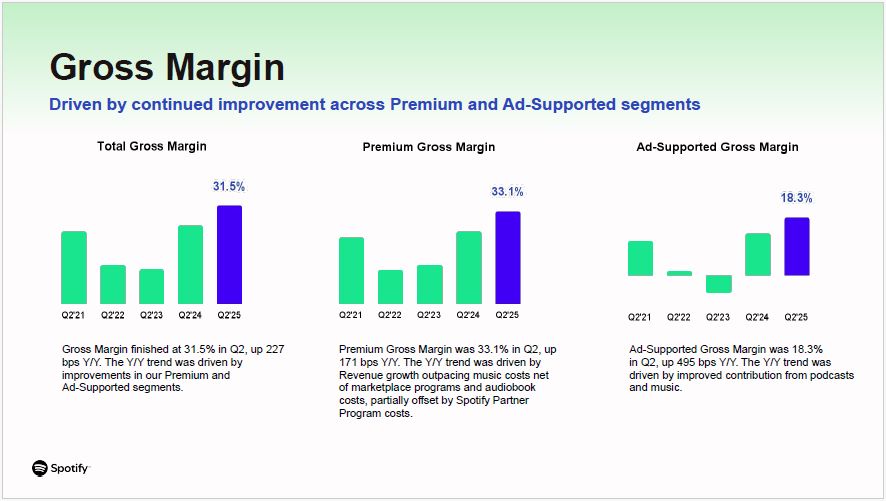
Premium Gross Margin was 33.1% in Q2, up 171 bps Y/Y. The Y/Y trend was driven
by Revenue growth outpacing music costs net of marketplace programs and audiobook costs, partially offset by Spotify Partner Program costs. Gross Margin Driven by continued improvement across Premium and Ad-Supported segments Gross
Margin finished at 31.5% in Q2, up 227 bps Y/Y. The Y/Y trend was driven by improvements in our Premium and Ad-Supported segments. Ad-Supported Gross Margin was 18.3% in Q2, up 495 bps Y/Y. The Y/Y trend was driven by improved
contribution from podcasts and music.
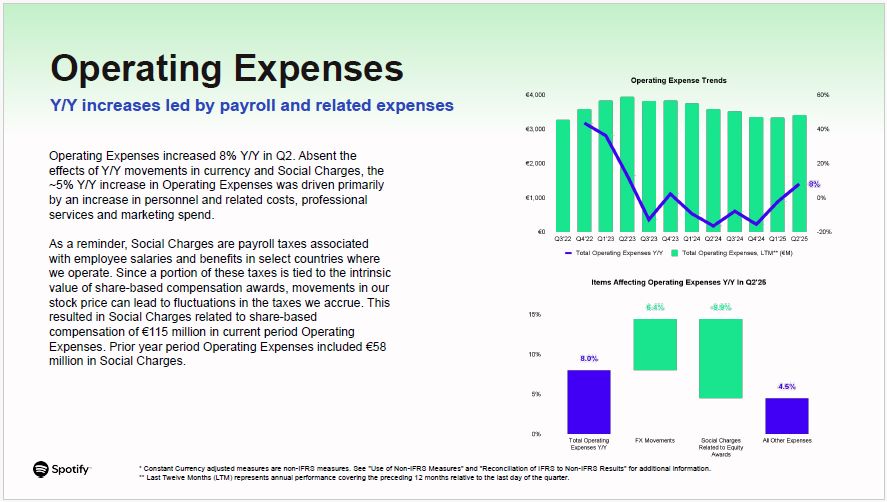
Operating Expenses increased 8% Y/Y in Q2. Absent the effects of Y/Y movements
in currency and Social Charges, the ~5% Y/Y increase in Operating Expenses was driven primarily by an increase in personnel and related costs, professional services and marketing spend. As a reminder, Social Charges are payroll taxes
associated with employee salaries and benefits in select countries where we operate. Since a portion of these taxes is tied to the intrinsic value of share-based compensation awards, movements in our stock price can lead to fluctuations in
the taxes we accrue. This resulted in Social Charges related to share-based compensation of €115 million in current period Operating Expenses. Prior year period Operating Expenses included €58 million in Social Charges. Operating
Expenses Y/Y increases led by payroll and related expenses * Constant Currency adjusted measures are non-IFRS measures. See "Use of Non-IFRS Measures" and "Reconciliation of IFRS to Non-IFRS Results" for additional information. ** Last
Twelve Months (LTM) represents annual performance covering the preceding 12 months relative to the last day of the quarter.
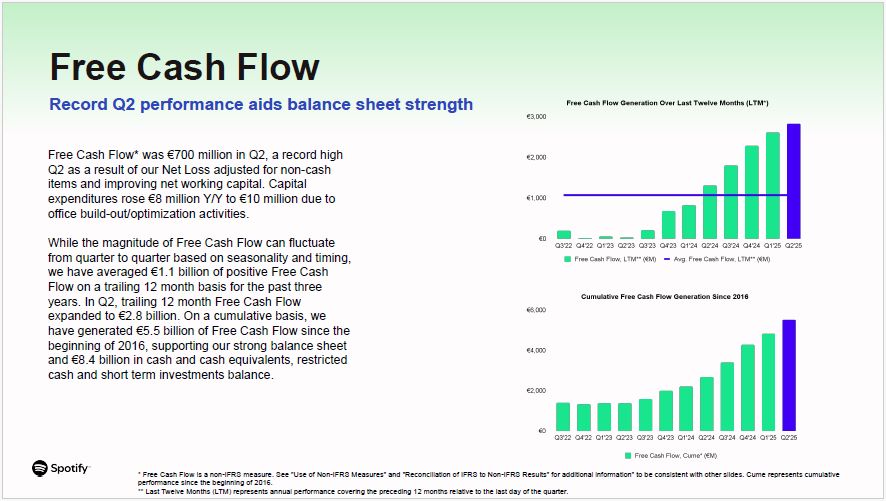
Free Cash Flow Record Q2 performance aids balance sheet strength Free Cash
Flow* was €700 million in Q2, a record high Q2 as a result of our Net Loss adjusted for non-cash items and improving net working capital. Capital expenditures rose €8 million Y/Y to €10 million due to office build-out/optimization
activities. While the magnitude of Free Cash Flow can fluctuate from quarter to quarter based on seasonality and timing, we have averaged €1.1 billion of positive Free Cash Flow on a trailing 12 month basis for the past three years. In Q2,
trailing 12 month Free Cash Flow expanded to €2.8 billion. On a cumulative basis, we have generated €5.5 billion of Free Cash Flow since the beginning of 2016, supporting our strong balance sheet and €8.4 billion in cash and cash
equivalents, restricted cash and short term investments balance. * Free Cash Flow is a non-IFRS measure. See "Use of Non-IFRS Measures" and "Reconciliation of IFRS to Non-IFRS Results" for additional information" to be consistent with
other slides. Cume represents cumulative performance since the beginning of 2016. ** Last Twelve Months (LTM) represents annual performance covering the preceding 12 months relative to the last day of the quarter.
Capital Allocation Upsizing share repurchase authorization to $2 billion Our
approach to capital allocation prioritizes profitable growth while maintaining a balance sheet that can support our long term strategy. To the extent excess capacity arises above these needs, we plan to take our shareholders into
consideration. As an initial step in this regard, on July 28th the Board of Directors approved a $1 billion increase to our existing $1 billion share repurchase program (announced in 2021), bringing our total authorization under the program
to $2 billion. With $104 million utilized under the existing authorization (from August 2021 through January 2022), the $1 billion increase brings the total remaining authorization to $1.9 billion. The share repurchase authorization
expires on April 21st, 2026 and can be renewed by decision at a general meeting of shareholders of the Company. Any repurchase program would be executed in accordance with the Company’s capital allocation strategy, the rules of the U.S.
Securities and Exchange Commission and other applicable legal requirements. The repurchase program does not obligate the Company to acquire any particular amount of ordinary shares and could be suspended or discontinued at any time at the
Company’s discretion.

MAUS & SUBSCRIBERS
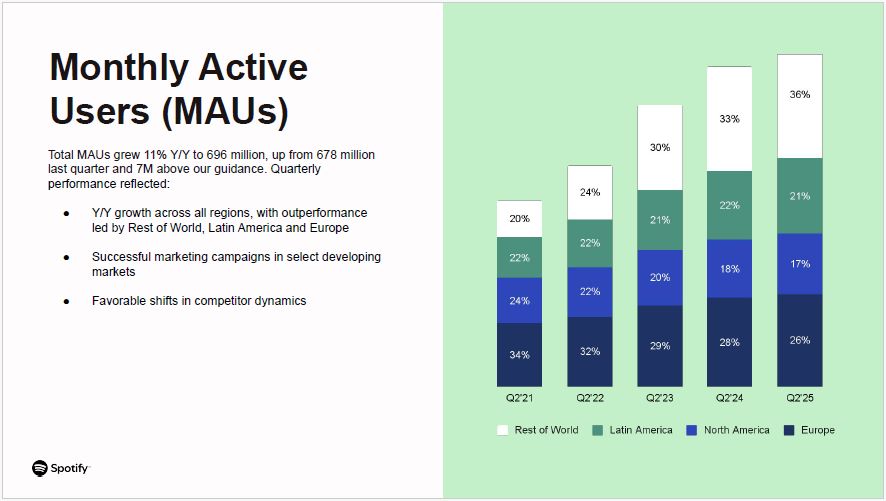
Total MAUs grew 11% Y/Y to 696 million, up from 678 million last quarter and
7M above our guidance. Quarterly performance reflected: Y/Y growth across all regions, with outperformance led by Rest of World, Latin America and Europe Successful marketing campaigns in select developing markets Favorable shifts in
competitor dynamics Monthly Active Users (MAUs)
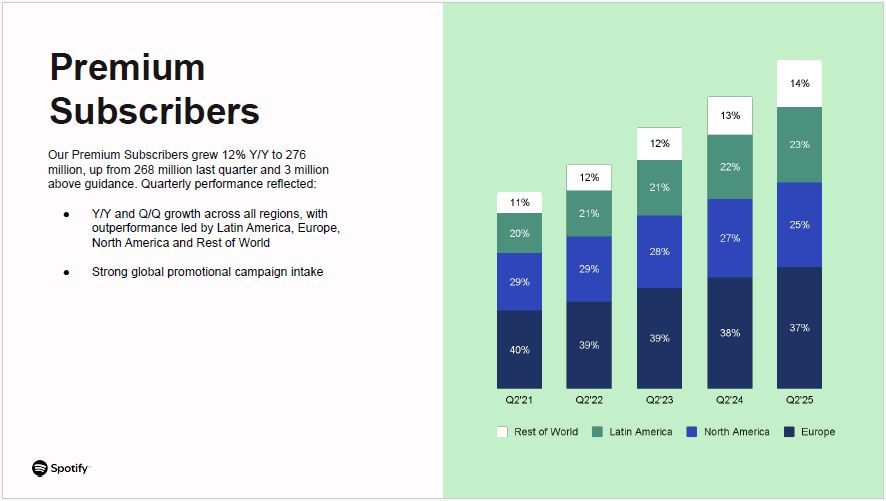
Our Premium Subscribers grew 12% Y/Y to 276 million, up from 268 million last
quarter and 3 million above guidance. Quarterly performance reflected: Y/Y and Q/Q growth across all regions, with outperformance led by Latin America, Europe, North America and Rest of World Strong global promotional campaign
intake Premium Subscribers

PRODUCT & PLATFORM

Music innovation continues to strengthen our ecosystem for creators and
listeners Launched voice requests for DJ for Premium listeners across 60+ markets where DJ is available, making it even easier to set the mood. Listener engagement with DJ has nearly doubled over the past year. Upcoming Releases hub puts
fans first, helping users pre-save music, explore clips and merch and get alerts on release day. Expanded AI Playlist to more than 40 new markets including countries in Africa, Asia, Europe and the Caribbean, making it easier than ever to
turn ideas into soundtracks.
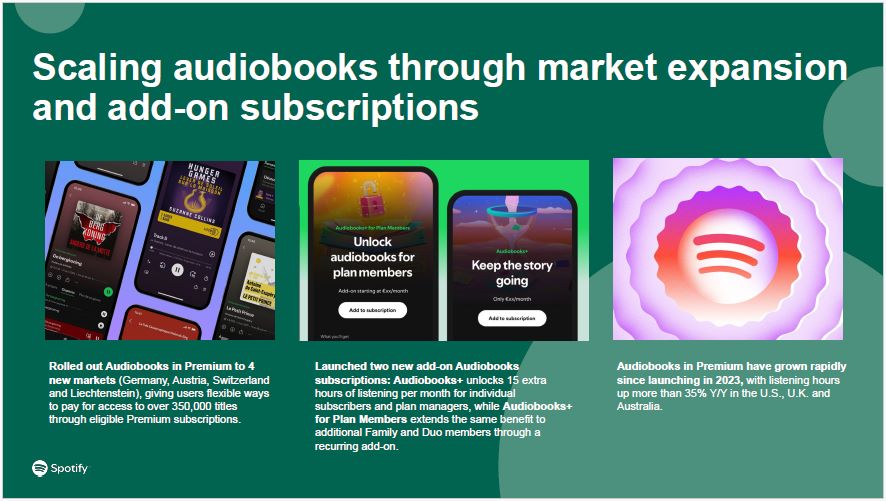
Scaling audiobooks through market expansion and add-on
subscriptions Audiobooks in Premium have grown rapidly since launching in 2023, with listening hours up more than 35% Y/Y in the U.S., U.K. and Australia. Launched two new add-on Audiobooks subscriptions: Audiobooks+ unlocks 15 extra
hours of listening per month for individual subscribers and plan managers, while Audiobooks+ for Plan Members extends the same benefit to additional Family and Duo members through a recurring add-on. Rolled out Audiobooks in Premium to 4
new markets (Germany, Austria, Switzerland and Liechtenstein), giving users flexible ways to pay for access to over 350,000 titles through eligible Premium subscriptions.

Supporting creators, connecting fans and delivering culture-moving
moments Discover Weekly Turns 10, having spent a decade helping listeners find their next favorite artist or song. The weekly playlist has driven more than 100 billion streamed tracks and ignites more than 56 million new artist discoveries
each week — 77% of which come from emerging artists. Celebrated Travis Scott and Miley Cyrus with Billions Club Live, featuring Travis Scott's exclusive Barcelona performance and FC Barcelona collaboration and Miley Cyrus’ live concert in
Paris (now streaming globally). Launched a limited-edition set of digital playlist cover art stickers in celebration of Beyoncé’s COWBOY CARTER Tour. After the tour’s kick-off on April 29, Spotify saw a 2,400% increase in the creation of
COWBOY CARTER-related playlists across the U.S.

OUTLOOK
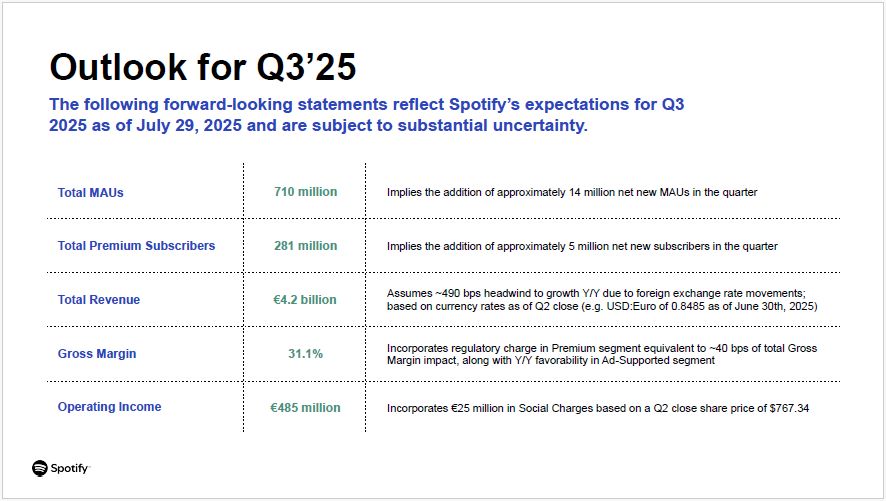
Outlook for Q3’25 The following forward-looking statements reflect Spotify’s
expectations for Q3 2025 as of July 29, 2025 and are subject to substantial uncertainty. Total MAUs 710 million Implies the addition of approximately 14 million net new MAUs in the quarter Total Premium Subscribers 281 million Implies
the addition of approximately 5 million net new subscribers in the quarter Total Revenue €4.2 billion Assumes ~490 bps headwind to growth Y/Y due to foreign exchange rate movements; based on currency rates as of Q2 close (e.g. USD:Euro
of 0.8485 as of June 30th, 2025) Gross Margin 31.1% Incorporates regulatory charge in Premium segment equivalent to ~40 bps of total Gross Margin impact, along with Y/Y favorability in Ad-Supported segment Operating Income €485
million Incorporates €25 million in Social Charges based on a Q2 close share price of $767.34
Webcast Information We will host a live question and answer session starting
at 8:00 a.m. ET today on investors.spotify.com. Daniel Ek, our Founder and Chief Executive Officer, Alex Norström, our Co-President and Chief Business Officer, Gustav Söderström, our Co-President and Chief Product & Technology Officer,
and Christian Luiga, our Chief Financial Officer will be on hand to answer questions. Questions can be submitted by going to slido.com and using the code #SpotifyEarningsQ225. Participants also may join using the listen-only conference line
by registering through the following site: https://registrations.events/direct/Q4I570506211 We use investors.spotify.com and newsroom.spotify.com websites as well as other social media listed in the “Resources – Social Media” tab of our
Investors website to disclose material company information. Use of Non-IFRS Measures To supplement our financial information presented in accordance with IFRS, we use the following non-IFRS financial measures: Revenue excluding foreign
exchange effect, Premium revenue excluding foreign exchange effect, Ad-Supported revenue excluding foreign exchange effect, gross profit excluding foreign exchange effect, Operating Income excluding foreign exchange impact, Operating
expense excluding foreign exchange effect, and Free Cash Flow. Management believes that Revenue excluding foreign exchange effect, Premium revenue excluding foreign exchange effect, Ad-Supported revenue excluding foreign exchange effect,
gross profit excluding foreign exchange effect, and Operating expense excluding foreign exchange effect, are useful to investors because they present measures that facilitate comparison to our historical performance. However, these should
be considered in addition to, not as a substitute for or superior to, Revenue, Premium revenue, Ad-Supported revenue, Gross Profit, Operating Income, Operating expense, or other financial measures prepared in accordance with IFRS.
Management believes that Free Cash Flow is useful to investors because it presents a measure that approximates the amount of cash generated that is available to repay debt obligations, to make investments, and for certain other activities
that exclude certain infrequently occurring and/or non-cash items. However, Free Cash Flow should be considered in addition to, not as a substitute for or superior to, net cash flows (used in)/from operating activities or other financial
measures prepared in accordance with IFRS. For more information on these non-IFRS financial measures, please see “Reconciliation of IFRS to Non-IFRS Results” section below. Forward Looking Statements This shareholder update contains
estimates and forward-looking statements. All statements other than statements of historical fact are forward-looking statements. The words “may,” “might,” “will,” “could,” “would,” “should,” “expect,” “plan,” “anticipate,” “intend,”
“seek,” “believe,” “estimate,” “predict,” “potential,” “continue,” “contemplate,” “possible,” and similar words are intended to identify estimates and forward-looking statements. Our estimates and forward-looking statements are mainly based
on our current expectations and estimates of future events and trends, which affect or may affect our businesses and operations. Although we believe that these estimates and forward-looking statements are based upon reasonable assumptions,
they are subject to numerous risks and uncertainties and are made in light of information currently available to us. Many important factors may adversely affect our results as indicated in forward-looking statements. These factors include,
but are not limited to: our ability to attract prospective users, retain existing users, and monetize our products and services; competition for users, their time, and advertisers; risks associated with our international operations and our
ability to manage our growth and the scope and complexity of our business; risks associated with our new products or services and our emphasis on long-term user engagement over short-term results; our ability to predict, recommend, and play
content that our users enjoy; our ability to generate profit or positive cash flow on a sustained basis; our ability to convince advertisers of the benefits of our advertising offerings; our ability to forecast or optimize advertising
inventory amid evolving industry trends in digital advertising; our ability to generate revenues from podcasts, audiobooks, and other non-music content; potential disputes or liabilities associated with content made available on our premium
service and ad-supported service (collectively, the “Service”); risks relating to acquisitions, investments, and divestitures; our dependence upon third-party licenses for most of the content we stream; our lack of control over third-party
content providers who are concentrated and can unilaterally affect our access to content; our ability to comply with complex license agreements; our ability to accurately estimate royalty payments under our license agreements and relevant
statutes; the limitations on our operating flexibility due to financial commitments required under certain of our license agreements; our ability to identify the compositions embodied in sound recordings and ownership thereof in order to
obtain licenses or comply with existing license agreements; assertions by third parties of infringement or other violations by us of their intellectual property rights; our ability to protect our intellectual property; the dependence of
streaming on operating systems, online platforms, hardware, networks, regulations, and standards that we do not control; our ability to maintain the integrity of our technology infrastructure and systems or the security of confidential
information; undetected errors, misconfigurations, bugs, or vulnerabilities in our products and services; interruptions, delays, or discontinuations in service arising from our systems or systems of third parties; changes in laws or
regulations affecting us; risks relating to privacy and data security, content moderation, and use of artificial intelligence; our ability to maintain, protect, and enhance our brand; risks associated with increased scrutiny of
environmental, social, and governance matters; payment acceptance-related risks; our dependence on key personnel and ability to attract, retain, and motivate highly skilled employees; our ability to access additional capital to support
strategic objectives; risks relating to currency exchange rate fluctuations and foreign exchange controls; the impact of economic, social, or political conditions, including inflation, changes in interest rates, changes in trade policies,
geopolitical conflicts in Europe and the Middle East, and related market uncertainty; our ability to accurately estimate user metrics and other estimates; our ability to manage and remediate attempts to manipulate streams and attempts to
gain or provide unauthorized access to certain features of our Service; risks related to our indebtedness, including risks related to our Exchangeable Notes; fluctuation of our operating results and fair market value of ordinary shares;
tax-related risks; the concentration of voting power among our founders, which limits shareholders’ ability to influence our governance and business; and risks related to our status as a foreign private issuer and a Luxembourg company. A
detailed discussion of these and other risks and uncertainties that could cause actual results and events to differ materially from our estimates and forward-looking statements is included in our filings with the U.S. Securities and
Exchange Commission (“SEC”), including our Annual Report on Form 20-F filed with the SEC on February 5, 2025, as updated by subsequent reports filed with the SEC. We undertake no obligation to update forward-looking statements to reflect
events or circumstances occurring after the date of this shareholder update. Rounding Certain monetary amounts, percentages, and other figures included in this update have been subject to rounding adjustments. The sum of individual
metrics may not always equal total amounts indicated due to rounding.

FINANCIAL STATEMENTS
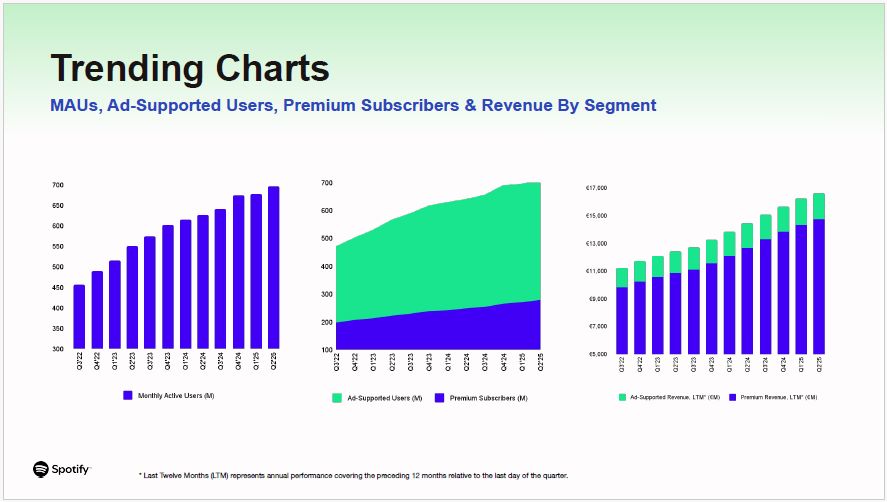
Trending Charts MAUs, Ad-Supported Users, Premium Subscribers & Revenue
By Segment * Last Twelve Months (LTM) represents annual performance covering the preceding 12 months relative to the last day of the quarter.
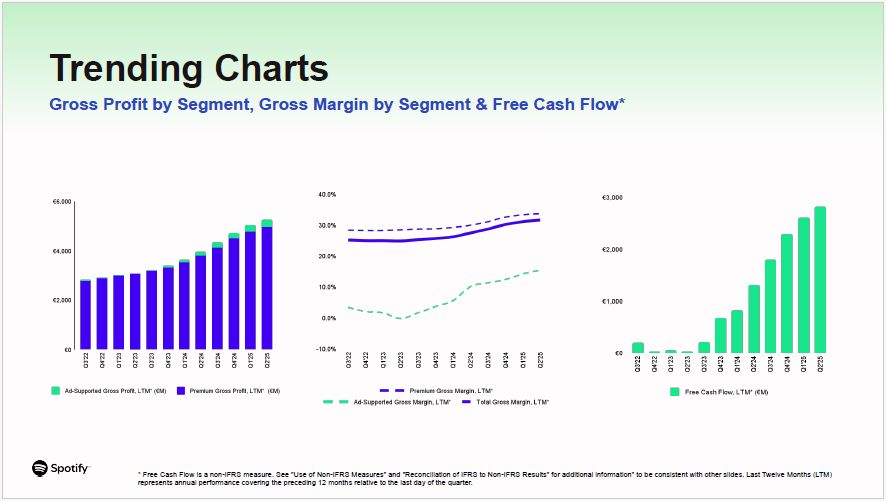
Trending Charts Gross Profit by Segment, Gross Margin by Segment & Free
Cash Flow* * Free Cash Flow is a non-IFRS measure. See "Use of Non-IFRS Measures" and "Reconciliation of IFRS to Non-IFRS Results" for additional information" to be consistent with other slides. Last Twelve Months (LTM) represents annual
performance covering the preceding 12 months relative to the last day of the quarter.
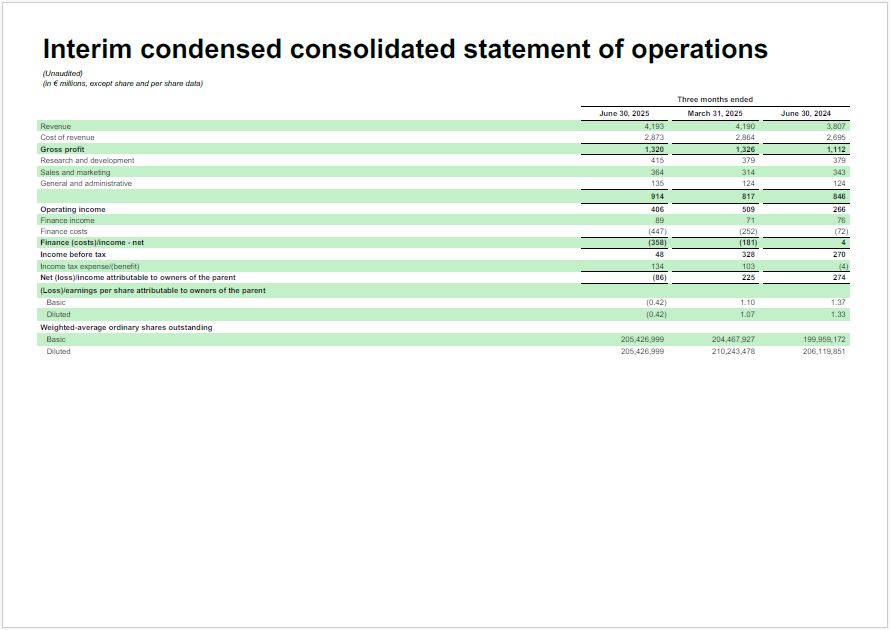
Interim condensed consolidated statement of operations (Unaudited) (in €
millions, except share and per share data) Three months ended June 30, 2025 March 31, 2025 June 30, 2024 Revenue 4,193 4,190 3,807 Cost of revenue 2,873 2,864 2,695 Gross profit 1,320 1,326 1,112 Research and
development 415 379 379 Sales and marketing 364 314 343 General and administrative 135 124 124 914 817 846 Operating income 406 509 266 Finance income 89 71 76 Finance costs (447) (252) (72) Finance (costs)/income -
net (358) (181) 4 Income before tax 48 328 270 Income tax expense/(benefit) 134 103 (4) Net (loss)/income attributable to owners of the parent (86) 225 274 (Loss)/earnings per share attributable to owners of the
parent Basic (0.42) 1.10 1.37 Diluted (0.42) 1.07 1.33 Basic 205,426,999 204,467,927 199,959,172 Weighted-average ordinary shares outstanding Diluted 205,426,999 210,243,478 206,119,851
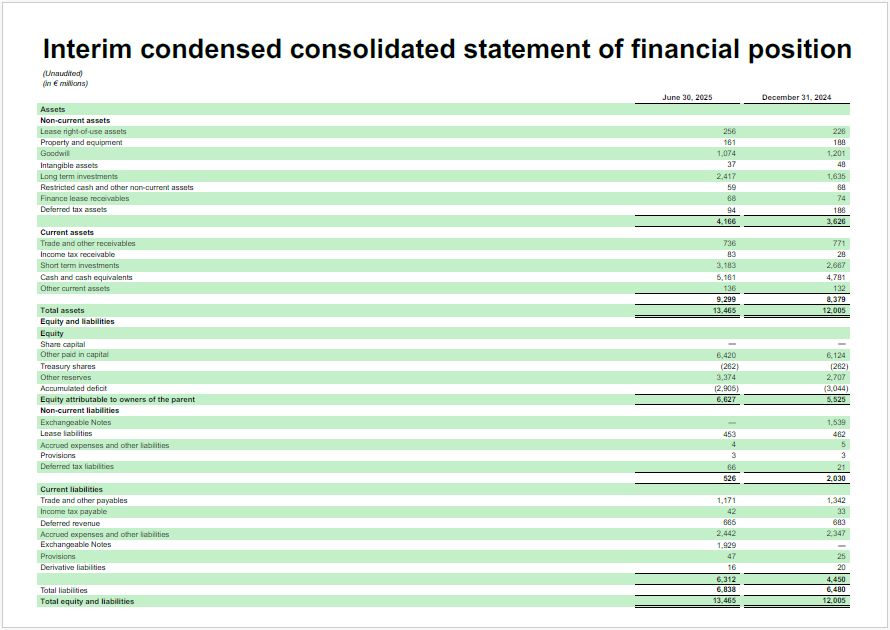
June 30, 2025 December 31, 2024 Assets Non-current assets Lease
right-of-use assets 256 226 Property and equipment 161 188 Goodwill 1,074 1,201 Intangible assets 37 48 Long term investments 2,417 1,635 Restricted cash and other non-current assets 59 68 Finance lease
receivables 68 74 Deferred tax assets 94 186 4,166 3,626 Current assets Trade and other receivables 736 771 Income tax receivable 83 28 Short term investments 3,183 2,667 Cash and cash equivalents 5,161 4,781 Other
current assets 136 132 9,299 8,379 Total assets 13,465 12,005 Equity and liabilities Equity Share capital — — Other paid in capital 6,420 6,124 Treasury shares (262) (262) Other reserves 3,374 2,707 Accumulated
deficit (2,905) (3,044) Equity attributable to owners of the parent 6,627 5,525 Non-current liabilities Exchangeable Notes — 1,539 Lease liabilities 453 462 Accrued expenses and other
liabilities 4 5 Provisions 3 3 Deferred tax liabilities 66 21 526 2,030 Current liabilities Trade and other payables 1,171 1,342 Income tax payable 42 33 Deferred revenue 665 683 Accrued expenses and other
liabilities 2,442 2,347 Exchangeable Notes 1,929 — Provisions 47 25 Derivative liabilities 16 20 6,312 4,450 Total liabilities 6,838 6,480 Total equity and liabilities 13,465 12,005 Interim condensed consolidated
statement of financial position (Unaudited) (in € millions)
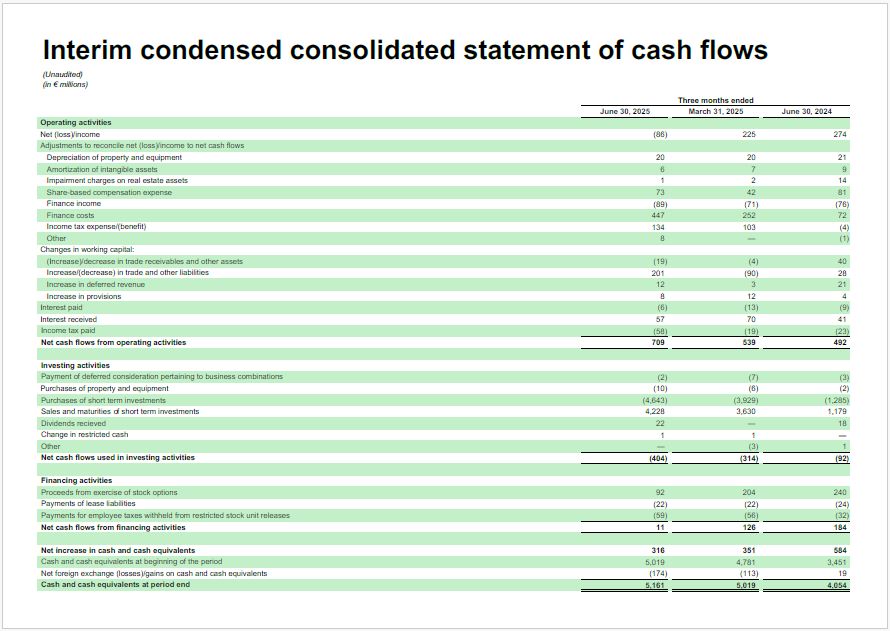
June 30, 2025 March 31, 2025 June 30, 2024 Operating activities Net
(loss)/income (86) 225 274 Adjustments to reconcile net (loss)/income to net cash flows Depreciation of property and equipment 20 20 21 Amortization of intangible assets 6 7 9 Impairment charges on real estate
assets 1 2 14 Share-based compensation expense 73 42 81 Finance income (89) (71) (76) Finance costs 447 252 72 Income tax expense/(benefit) 134 103 (4) Other 8 — (1) Changes in working capital: (Increase)/decrease
in trade receivables and other assets (19) (4) 40 Increase/(decrease) in trade and other liabilities 201 (90) 28 Increase in deferred revenue 12 3 21 Increase in provisions 8 12 4 Interest paid (6) (13) (9) Interest
received 57 70 41 Income tax paid (58) (19) (23) Net cash flows from operating activities 709 539 492 Investing activities Payment of deferred consideration pertaining to business combinations (2) (7) (3) Purchases of
property and equipment (10) (6) (2) Purchases of short term investments (4,643) (3,929) (1,285) Sales and maturities of short term investments 4,228 3,630 1,179 Dividends recieved 22 — 18 Change in restricted
cash 1 1 — Other — (3) 1 Net cash flows used in investing activities (404) (314) (92) Financing activities Proceeds from exercise of stock options 92 204 240 Payments of lease liabilities (22) (22) (24) Payments for
employee taxes withheld from restricted stock unit releases (59) (56) (32) Net cash flows from financing activities 11 126 184 Net increase in cash and cash equivalents 316 351 584 Cash and cash equivalents at beginning of the
period 5,019 4,781 3,451 Net foreign exchange (losses)/gains on cash and cash equivalents (174) (113) 19 Cash and cash equivalents at period end 5,161 5,019 4,054 (Unaudited) (in € millions) Three months ended Interim
condensed consolidated statement of cash flows
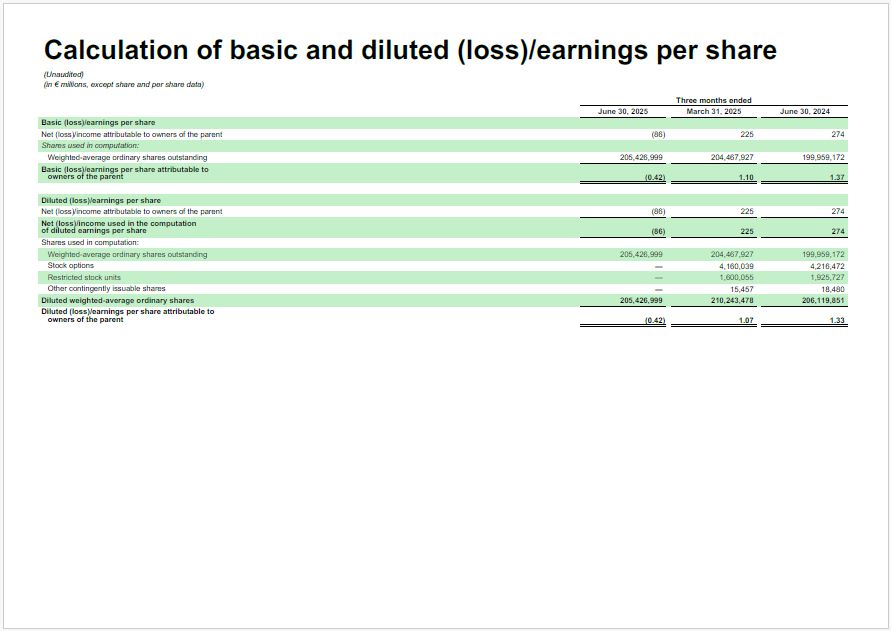
Diluted (loss)/earnings per share Net (loss)/income attributable to owners of
the parent (86) 225 274 Net (loss)/income used in the computation of diluted earnings per share (86) 225 274 Shares used in computation: Weighted-average ordinary shares outstanding 205,426,999 204,467,927 199,959,172 Stock
options — 4,160,039 4,216,472 Restricted stock units — 1,600,055 1,925,727 Other contingently issuable shares — 15,457 18,480 Diluted weighted-average ordinary shares 205,426,999 210,243,478 206,119,851 Diluted
(loss)/earnings per share attributable to owners of the parent (0.42) 1.07 1.33 June 30, 2024 Basic (loss)/earnings per share Net (loss)/income attributable to owners of the parent (86) 225 274 Shares used in
computation: Weighted-average ordinary shares outstanding 205,426,999 204,467,927 199,959,172 Basic (loss)/earnings per share attributable to owners of the parent (0.42) 1.10 1.37 (Unaudited) (in € millions, except share and per share
data) Three months ended June 30, 2025 March 31, 2025 Calculation of basic and diluted (loss)/earnings per share
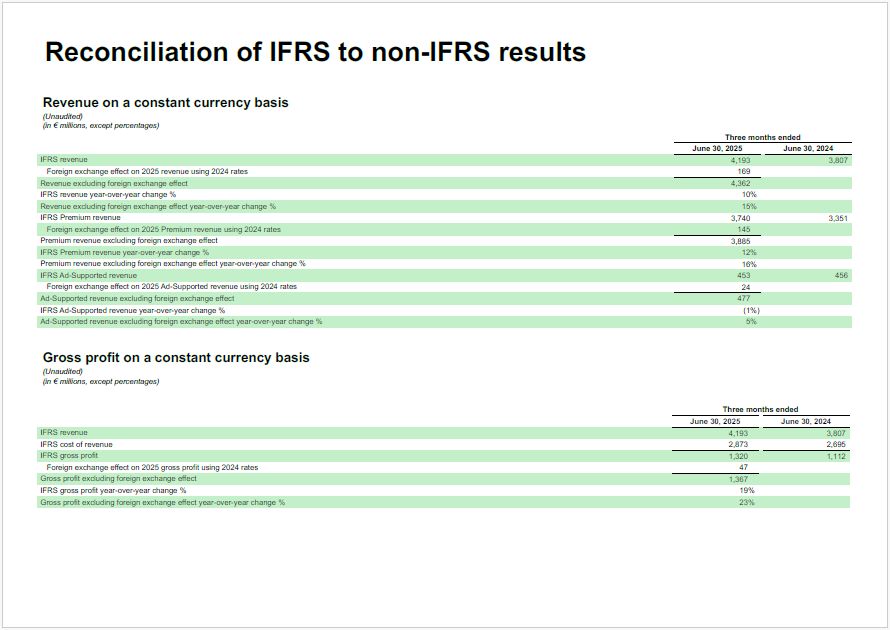
Three months ended June 30, 2025 June 30, 2024 IFRS
revenue 4,193 3,807 Foreign exchange effect on 2025 revenue using 2024 rates 169 Revenue excluding foreign exchange effect 4,362 IFRS revenue year-over-year change % 10% Revenue excluding foreign exchange effect year-over-year
change % 15% IFRS Premium revenue 3,740 3,351 Foreign exchange effect on 2025 Premium revenue using 2024 rates 145 Premium revenue excluding foreign exchange effect 3,885 IFRS Premium revenue year-over-year change % 12% Premium
revenue excluding foreign exchange effect year-over-year change % 16% IFRS Ad-Supported revenue 453 456 Foreign exchange effect on 2025 Ad-Supported revenue using 2024 rates 24 Ad-Supported revenue excluding foreign exchange
effect 477 IFRS Ad-Supported revenue year-over-year change % (1%) Ad-Supported revenue excluding foreign exchange effect year-over-year change % 5% Gross profit on a constant currency basis (Unaudited) (in € millions, except
percentages) Revenue on a constant currency basis (Unaudited) (in € millions, except percentages) Reconciliation of IFRS to non-IFRS results Three months ended June 30, 2025 June 30, 2024 IFRS revenue 4,193 3,807 IFRS cost of
revenue 2,873 2,695 IFRS gross profit 1,320 1,112 Foreign exchange effect on 2025 gross profit using 2024 rates 47 Gross profit excluding foreign exchange effect 1,367 IFRS gross profit year-over-year change % 19% Gross profit
excluding foreign exchange effect year-over-year change % 23%
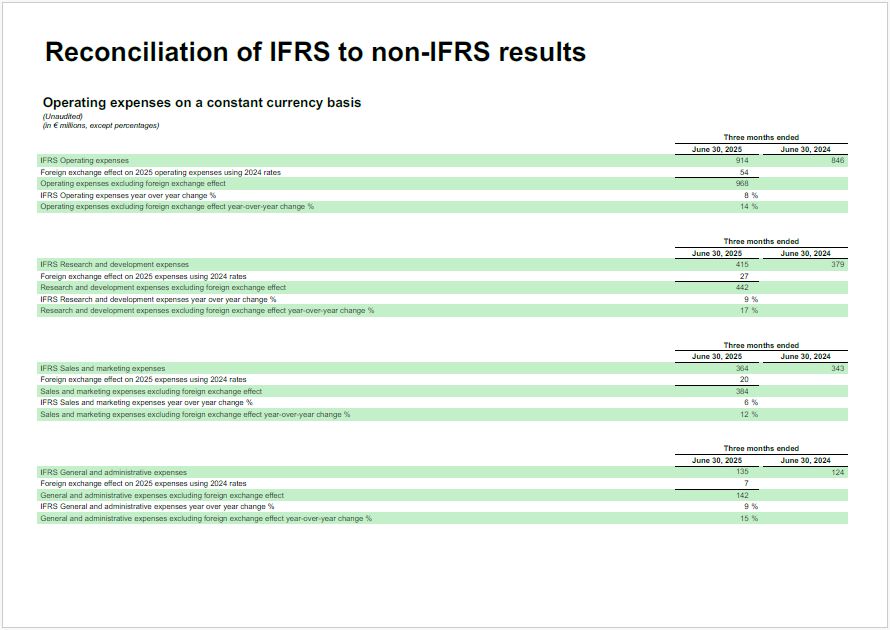
Operating expenses on a constant currency basis (Unaudited) (in € millions,
except percentages) Three months ended June 30, 2025 June 30, 2024 IFRS Research and development expenses 415 379 Foreign exchange effect on 2025 expenses using 2024 rates 27 Research and development expenses excluding foreign exchange
effect 442 IFRS Research and development expenses year over year change % 9 % Research and development expenses excluding foreign exchange effect year-over-year change % 17 % Reconciliation of IFRS to non-IFRS results Three months
ended June 30, 2025 June 30, 2024 IFRS Sales and marketing expenses 364 343 Foreign exchange effect on 2025 expenses using 2024 rates 20 Sales and marketing expenses excluding foreign exchange effect 384 IFRS Sales and marketing
expenses year over year change % 6 % Sales and marketing expenses excluding foreign exchange effect year-over-year change % 12 % Three months ended June 30, 2025 June 30, 2024 IFRS General and administrative expenses 135 124 Foreign
exchange effect on 2025 expenses using 2024 rates 7 General and administrative expenses excluding foreign exchange effect 142 IFRS General and administrative expenses year over year change % 9 % General and administrative expenses
excluding foreign exchange effect year-over-year change % 15 % Three months ended June 30, 2025 June 30, 2024 IFRS Operating expenses 914 846 Foreign exchange effect on 2025 operating expenses using 2024 rates 54 Operating expenses
excluding foreign exchange effect 968 IFRS Operating expenses year over year change % 8 % Operating expenses excluding foreign exchange effect year-over-year change % 14 %
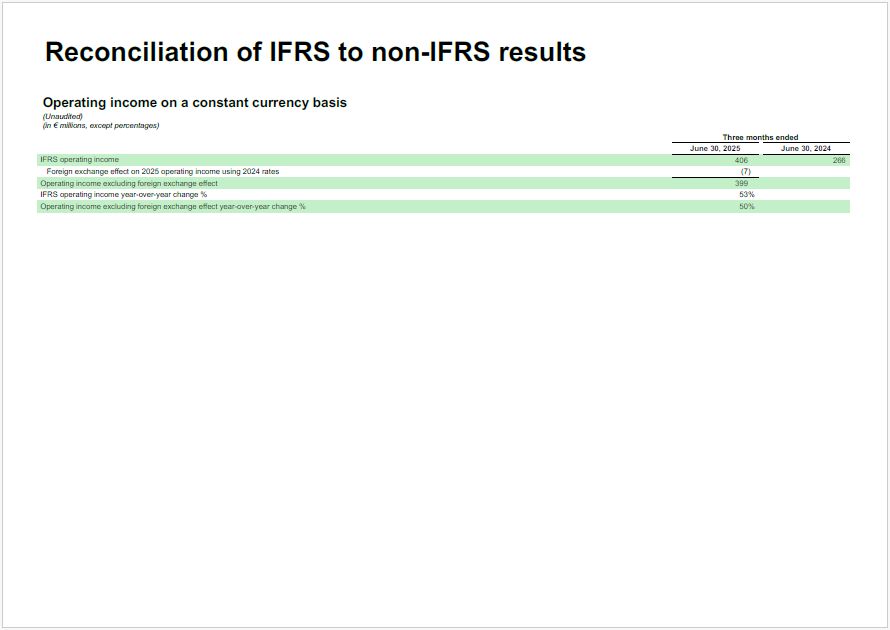
Reconciliation of IFRS to non-IFRS results Operating income on a constant
currency basis (Unaudited) (in € millions, except percentages) Three months ended June 30, 2025 June 30, 2024 IFRS operating income 406 266 Foreign exchange effect on 2025 operating income using 2024 rates (7) Operating income
excluding foreign exchange effect 399 IFRS operating income year-over-year change % 53% Operating income excluding foreign exchange effect year-over-year change % 50%
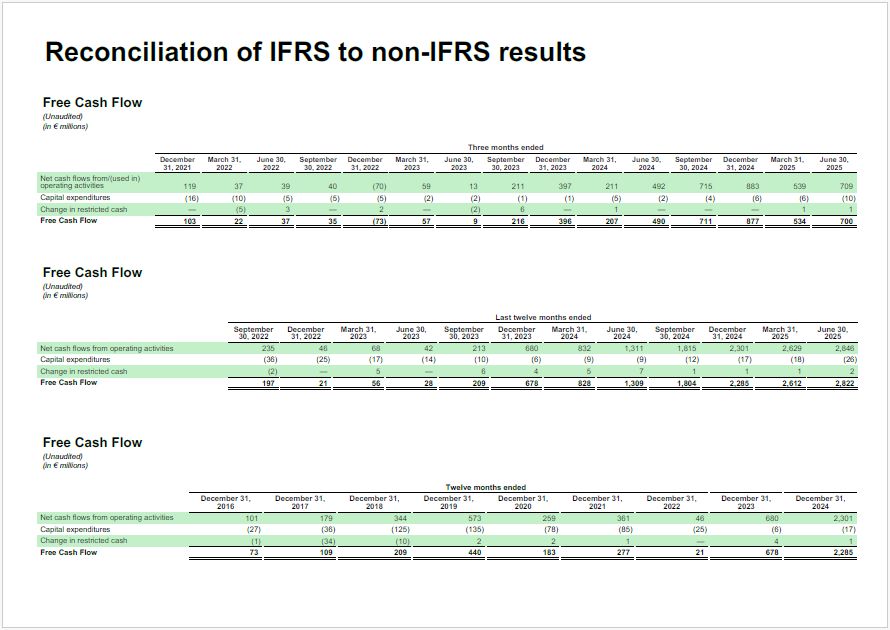
Free Cash Flow (Unaudited) (in € millions) Three months
ended December March 31, June 30, September December March 31, June 30, September December March 31, June 30, September December March 31, June 30, 31, 2021 2022 2022 30, 2022 31, 2022 2023 2023 30, 2023 31,
2023 2024 2024 30, 2024 31, 2024 2025 2025 Net cash flows from/(used in) operating activities 119 37 39 40 (70) 59 13 211 397 211 492 715 883 539 709 Capital
expenditures (16) (10) (5) (5) (5) (2) (2) (1) (1) (5) (2) (4) (6) (6) (10) Change in restricted cash — (5) 3 — 2 — (2) 6 — 1 — — — 1 1 Free Cash
Flow 103 22 37 35 (73) 57 9 216 396 207 490 711 877 534 700 Last twelve months ended September December March 31, June 30, September December March 31, June 30, September December March 31, June 30, 30,
2022 31, 2022 2023 2023 30, 2023 31, 2023 2024 2024 30, 2024 31, 2024 2025 2025 Net cash flows from operating activities 235 46 68 42 213 680 832 1,311 1,815 2,301 2,629 2,846 Capital
expenditures (36) (25) (17) (14) (10) (6) (9) (9) (12) (17) (18) (26) Change in restricted cash (2) — 5 — 6 4 5 7 1 1 1 2 Free Cash Flow 197 21 56 28 209 678 828 1,309 1,804 2,285 2,612 2,822 Free Cash
Flow (Unaudited) (in € millions) Reconciliation of IFRS to non-IFRS results Twelve months ended December 31, December 31, December 31, December 31, December 31, December 31, December 31, December 31, December
31, 2016 2017 2018 2019 2020 2021 2022 2023 2024 Net cash flows from operating activities 101 179 344 573 259 361 46 680 2,301 Capital expenditures (27) (36) (125) (135) (78) (85) (25) (6) (17) Change in
restricted cash (1) (34) (10) 2 2 1 — 4 1 Free Cash Flow 73 109 209 440 183 277 21 678 2,285 Free Cash Flow (Unaudited) (in € millions)

APPENDIX
Social Charges Sensitivity Meaningful movements in our stock price can lead
to Social Charge variance Our guidance incorporates the impact of Social Charges, the vast majority of which appear in Operating Expenses. The amount of Social Charges we accrue for and ultimately pay can be volatile, as they are tied to
the value of our share price. Since we do not forecast stock price changes in our guidance, meaningful movements in our stock price over the course of a quarter can lead to meaningful changes in Social Charges. As an example, at the Q2
close, our stock price was $767.34. In Q2, a 10% increase or decrease in our stock price compared to the quarter-end price would have an approximate +/- €41M impact on Social Charges.