On September 8, 2023, the Fund acquired all of the assets and liabilities of the Absolute Strategies Fund, a series of Forum Funds (the “Predecessor Fund”), in a tax-free reorganization. In connection with this acquisition, shares of the Predecessor Fund’s Institutional Class shares were exchanged for Institutional Class shares of the Fund. The Predecessor Fund had an investment objective and strategies that were, in all material respects, the same as those of the Fund through October 22, 2024, and was managed in a manner that, in all material respects, complied with the investment guidelines and restrictions of the Fund. The Fund’s performance for periods prior to September 11, 2023 is that of the Predecessor Fund. The Fund is a continuation of the Predecessor Fund, and therefore, the performance information includes the performance of the Predecessor Fund.
On August 1, 2024, the Fund added Mr. Kevin McNally and Ms. Patty Santorella as portfolio managers to the Fund and began utilizing CEFs as part of its non-principal investment strategy. On October 22, 2024, the Fund removed Mr. James Compson, the Fund’s portfolio manager since July 11, 2005, as a portfolio manager, and changed its strategy to utilize CEFs as the Fund’s principal portfolio investment. Different investment strategies may lead to different performance results. The Fund’s performance for periods prior to October 22, 2024, reflects the investment strategy in effect prior to that date.
The bar chart and table that follow provide some indication of the risks of investing in the Fund by showing changes in the performance of the Institutional Shares of the Fund from year to year and by showing how the Fund’s average annual returns compare with those of a broad based securities market index and secondary performance indices. The performance of the Predecessor Fund was calculated net of the Predecessor Fund’s fees and expenses. The performance of the Predecessor Fund is not the performance of the Fund, has not been restated to reflect the fees, expenses and fee waivers and/or expense limitations of the Fund, and is not necessarily indicative of the Fund’s future performance. If the performance of the Predecessor Fund had been restated to reflect the applicable fees and expenses of the Fund, the performance may have been lower than the performance shown in the bar chart and Average Annual Total Returns table below. Updated performance information is available at www.absoluteadvisers.com or by calling (888) 99-ABSOLUTE or (888) 992-2765 (toll free).
Performance information (before and after taxes) represents only past performance and does not necessarily indicate future results.
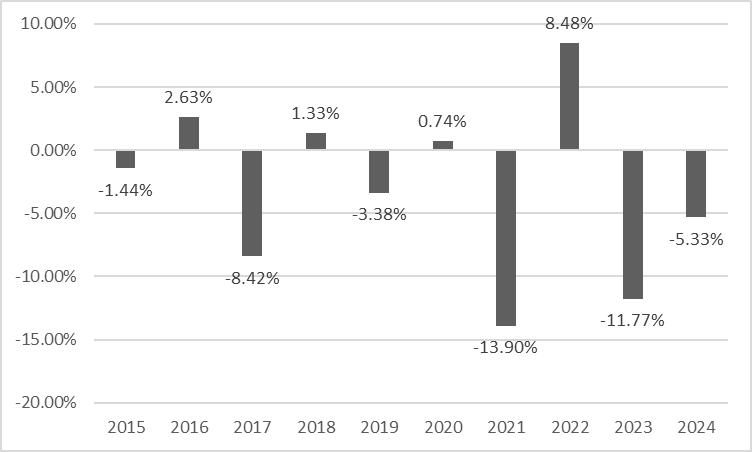
The calendar year-to-date total return as of June 30, 2025, was 3.47%.
Highest/Lowest quarterly results during this time period were:
Highest Quarter: 4.75%
Lowest Quarter: (6.30)%
| Absolute CEF Opportunities | 1 Year | 5 Year | 10 Year |
| Institutional Shares - Return Before Taxes | (5.33)% | (4.71)% | (3.33)% |
| Institutional Shares - Return After Taxes on Distributions | (6.91)% | (5.28)% | (4.20)% |
| Institutional Shares - Return After Taxes on Distributions and Sale of Fund Shares | (3.13)% | (3.71)% | (2.50)% |
| S&P 500® Index(1)
(reflects no deduction for fees, expenses or taxes) |
25.02% | 14.53% | 13.10% |
| Bloomberg U.S. Aggregate Bond Index(2) (reflects no deduction for fees, expenses or taxes) |
1.25% | (0.33)% | 1.35% |
| HFRX Global Hedge Fund Index(3) (reflects no deduction for fees, expenses or taxes) |
3.11% | 3.46% | 1.41% |
| MSCI World Index(4) (reflects no deduction for fees, expenses or taxes) |
18.67% | 11.17% | 9.95% |
| (1) | S&P 500® Index is a widely recognized unmanaged market capitalization weighted index of 500 leading publicly traded companies in the U.S. and is representative of a broader domestic equity market and range of securities than is found in the Fund’s portfolio. Individuals cannot invest directly in the index; however, an individual can invest in exchange traded funds or other investment vehicles that attempt to track the performance of a benchmark index. Index returns assume reinvestment of dividends and do not reflect any fees or expenses. |
| (2) | Bloomberg U.S. Aggregate Bond Index is an unmanaged index comprised of U.S. investment grade, fixed rate bond market securities, including government, government agency, corporate and mortgage-backed securities between one and ten years. Index returns assume reinvestment of dividends. Investors may not invest in the index directly. |
| (3) | HFRX Global Hedge Fund Index is designed to be representative of the overall composition of the hedge fund universe. It is comprised of all eligible hedge fund strategies, including but not limited to convertible arbitrage, distressed securities, equity hedge, equity market neutral, event driven, macro, merger arbitrage, and relative value arbitrage. Investors may not invest in the index directly. |
| (4) | MSCI World® Index is an unmanaged index that is designed to capture large and mid-cap representation across 23 developed market countries, including securities listed on exchanges in the U.S., Europe, Canada, Australia, New Zealand, Israel and the Far East. Investors may not invest in the index directly. |
After-tax returns are calculated using the historical highest individual federal marginal income tax rates and do not reflect the impact of state and local taxes. Actual after-tax returns depend on an investor’s tax situation and may differ from those shown. After-tax returns shown are not relevant to investors who hold their Fund shares through tax-advantaged arrangements, such as 401(k) plans or individual retirement accounts.
The return after taxes on distributions and sale of Fund shares may exceed the return before taxes due to an assumed tax benefit from any losses on a sale of Fund shares at the end of the measurement period.
The Fund acquired all of the assets and liabilities of the Absolute Capital Opportunities Fund, a series of Forum Funds (the “Predecessor Fund”), in a tax-free reorganization on September 8, 2023. In connection with this acquisition, shares of the Predecessor Fund’s Institutional Class shares were exchanged for Institutional Class shares of the Fund. The Predecessor Fund had an investment objective and strategies that were, in all material respects, the same as those of the Fund, and was managed in a manner that, in all material respects, complied with the investment guidelines and restrictions of the Fund. The Fund’s performance for periods prior to September 11, 2023 is that of the Predecessor Fund. The Fund is a continuation of the Predecessor Fund, and therefore, the performance information includes the performance of the Predecessor Fund.
The bar chart and table that follow provide some indication of the risks of investing in the Fund by showing changes in the performance of the Fund from year to year and by showing how the Fund’s average annual returns compare with those of a broad based securities market index and a secondary performance index. The performance of the Predecessor Fund was calculated net of the Predecessor Fund’s fees and expenses. The performance of the Predecessor Fund is not the performance of the Fund, has not been restated to reflect the fees, expenses and fee waivers and/or expense limitations of the Fund, and is not necessarily indicative of the Fund’s future performance. If the performance of the Predecessor Fund had been restated to reflect the applicable fees and expenses of the Fund, the performance may have been lower than the performance shown in the bar chart and Average Annual Total Returns table below. Updated performance information is available at www.absoluteadvisers.com or by calling (888) 99-ABSOLUTE or (888) 992-2765 (toll free).
Performance information (before and after taxes) represents only past performance and does not necessarily indicate future results.
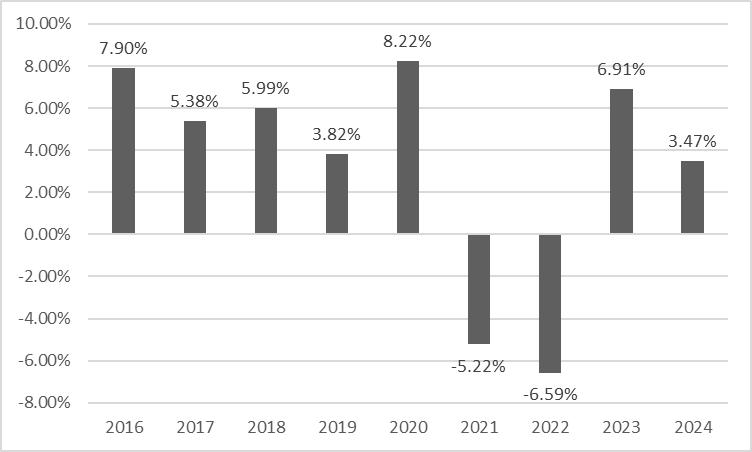
The calendar year-to-date total return as of June 30, 2025, was 3.84%.
Highest/Lowest quarterly results during this time period were:
Highest Quarter: First Quarter 2018 10.11%
Lowest Quarter: Fourth Quarter 2022 (5.09)%
| Absolute Capital Opportunities Fund | 1 Year | 5 Year | Since Inception 12/30/15 | |||
| Return Before Taxes | 3.47% | 1.17% | 3.18% | |||
| Return After Taxes on Distributions | 3.25% | (0.16)% | 2.18% | |||
| Return After Taxes on Distributions and Sale of Fund Shares | 2.21% | 0.39% | 2.11% | |||
S&P 500® Index(1) (reflects no deduction for expenses or taxes) |
25.02% | 14.53% | 14.36% | |||
|
HFRX Equity Hedge Index(2) (reflects no deduction for expenses or taxes) |
6.90% | 6.09% | 3.70% |
| (1) | The Fund’s primary index, the S&P 500 Index®, is included due to regulatory requirements for broad-based index comparison. The S&P 500® Index is a widely recognized unmanaged market capitalization weighted index of 500 leading publicly traded companies in the U.S. and is representative of a broader domestic equity market and range of securities than is found in the Fund’s portfolio. Individuals cannot invest directly in the index; however, an individual can invest in exchange traded funds or other investment vehicles that attempt to track the performance of a benchmark index. Index returns assume reinvestment of dividends and do not reflect any fees or expenses. |
| (2) | HFRX Equity Hedge Index is an unmanaged index designed to measure daily performance representative of long-short equity hedge funds. Hedge Fund Research, Inc. is the established global leader in the indexation, analysis and research of the hedge fund industry. With over 150 indices ranging from broad composites down to specific, niche areas of sub-strategy and regional investment focus, the HFRX Indices are considered the industry standard benchmarks of hedge fund performance. The HFRX branded indices are daily indices utilizing a rigorous quantitative selection process to represent the larger hedge fund universe. Investors cannot invest directly in the index. The index includes the reinvestment of dividends and does not reflect deduction of expenses. |
After-tax returns are calculated using the historical highest individual federal marginal income tax rates and do not reflect the impact of state and local taxes. Actual after-tax returns depend on an investor’s tax situation and may differ from those shown. After-tax returns shown are not relevant to investors who hold their Fund shares through tax-advantaged arrangements, such as 401(k) plans or individual retirement accounts (“IRAs”).
The return after taxes on distributions and sale of Fund shares may exceed the return before taxes due to an assumed tax benefit from any losses on a sale of Fund shares at the end of the measurement period.
The Fund acquired all of the assets and liabilities of the Absolute Convertible Arbitrage Fund, a series of Forum Funds (the “Predecessor Fund”), in a tax-free reorganization on September 8, 2023. In connection with this acquisition, shares of the Predecessor Fund’s Investor Class and Institutional Class shares were exchanged for Investor Class and Institutional Class shares of the Fund, respectively. The Predecessor Fund had an investment objective and strategies that were, in all material respects, the same as those of the Fund, and was managed in a manner that, in all material respects, complied with the investment guidelines and restrictions of the Fund. The Fund’s performance for periods prior to September 11, 2023 is that of the Predecessor Fund. The Fund is a continuation of the Predecessor Fund, and therefore, the performance information includes the performance of the Predecessor Fund.
The returns presented for the Predecessor Fund prior to August 14, 2017 reflect the performance of the Mohican VCA Fund, LP (“Mohican”) a privately offered hedge fund that was the predecessor of the Predecessor Fund. The Predecessor Fund had adopted the historical performance of Mohican as the result of a reorganization in which the Predecessor Fund acquired all the assets, subject to liabilities, of Mohican, effective as of the close of business on August 14, 2017.
Mohican was advised by the Predecessor Fund’s subadviser, Mohican Financial Management, LLC. The Predecessor Fund was managed in a manner that is in all material respects equivalent to the management of Mohican, including the investment objective, strategies, guidelines, and restrictions. Mohican was created for purposes entirely unrelated to the establishment of a performance record. Mohican, however, was not registered as an investment company under the Investment Company Act of 1940, as amended (“1940 Act”). Therefore, Mohican was not subject to certain investment limitations, diversification requirements, liquidity requirements, and other restrictions imposed by the 1940 Act and the Internal Revenue Code of 1986, as amended, which, if applicable, may have adversely affected its performance.
The Predecessor Fund’s performance for periods prior to August 14, 2017 is that of Mohican and is based on calculations that are different from the methodology mandated by the SEC for registered investment companies. The performance of Mohican and the Predecessor Fund was calculated net of the Mohican’s and the Predecessor Fund’s fees and expenses respectively. Mohican’s and the Predecessor Fund’s performance are included because the Fund believes that the performance information presented is sufficiently relevant to merit consideration by prospective Fund investors. The performance of Mohican and the Predecessor Fund is not the performance of the Fund, has not been restated to reflect the fees, expenses and fee waivers and/or expense limitations of the Fund, and is not necessarily indicative of the Fund’s future performance. If the performance of Mohican and the Predecessor Fund had been restated to reflect the applicable fees and expenses of the Fund, the performance may have been lower than the performance shown in the bar chart and Average Annual Total Returns table below. Updated performance information for the Fund will be available at www.absoluteadvisers.com or by calling Shareholder Services at (888) 992-2765.
The following bar chart and table are intended to help you understand the risks and potential rewards of investing in the Fund. The bar chart provides some indication of the risks of investing in the Fund by showing how the performance of the Predecessor Fund and Mohican and the Fund has varied from one calendar year to another over the periods shown. The table shows how the Predecessor Fund’s and the Fund’s average annual total returns of the share classes presented compared to those of a broad based securities market index and secondary performance indices.
Performance information (before and after taxes) represents only past performance and does not necessarily indicate future results.
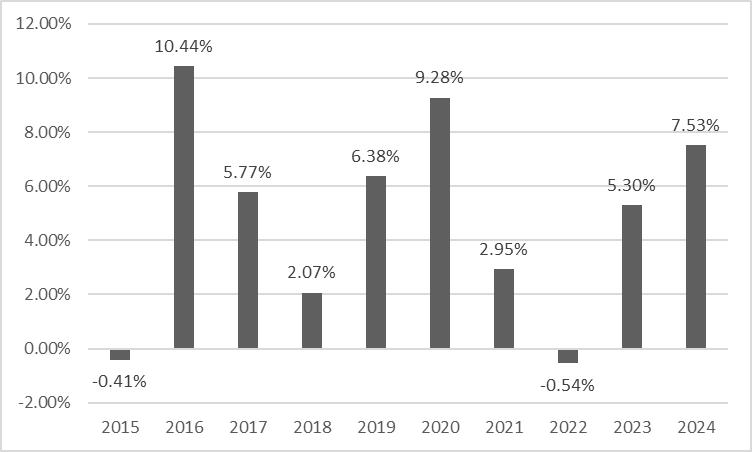
The calendar year-to-date total return as of June 30, 2025, was 4.07%.
Highest/Lowest quarterly results during this time period were:
Highest Quarter: Second Quarter 2016 4.62%
Lowest Quarter: Second Quarter 2022 (3.07)%
| Absolute Convertible Arbitrage Fund | 1 Year | 5 Years | 10 Years | Since Inception* | ||||
| Institutional Shares - Return Before Taxes | 7.53% | 4.85% | 4.81% | 6.35% | ||||
| Institutional Shares - Return After Taxes on Distributions | 5.47% | 3.63% | 4.03% | 5.99% | ||||
| Institutional Shares - Return After Taxes on Distributions and Sale of Fund Shares | 4.47% | 3.36% | 3.56% | 5.27% | ||||
| Investor Shares - Return Before Taxes* | 7.28% | N/A | N/A | 3.18% | ||||
S&P 500® Index(1) (reflects no deduction for fees, expenses or taxes) |
25.02% | 14.53% | 13.10% | 11.42% | ||||
|
HFRX Fixed Income Convertible Arbitrage Index(2) (reflects no deduction for fees, expenses or taxes) |
10.14% | 4.04% |
|
2.16% | 0.63% | |||
|
Bloomberg U.S. Aggregate Bond Index(3) (reflects no deduction for fees, expenses or taxes) |
1.25% | (0.33)% | 1.35% | 3.16% |
| * | The inception date of the Fund’s Institutional Shares and Investor Shares is September 30, 2002 and February 25, 2021, respectively. The inception date used for the S&P 500® Index, HFRX Fixed Income Convertible Arbitrage Index and Bloomberg U.S. Aggregate Bond Index is September 30, 2002, the inception date of the Fund’s Institutional Shares. |
| (1) | The Fund’s primary index, the S&P 500 Index®, is included due to regulatory requirements for broad-based index comparison. The S&P 500® Index is a widely recognized unmanaged market capitalization weighted index of 500 leading publicly traded companies in the U.S. and is representative of a broader domestic equity market and range of securities than is found in the Fund’s portfolio. Individuals cannot invest directly in the index; however, an individual can invest in exchange traded funds or other investment vehicles that attempt to track the performance of a benchmark index. Index returns assume reinvestment of dividends and do not reflect any fees or expenses. |
| (2) | HFRX Fixed Income Convertible Arbitrage Index is designed to reflect the performance of the hedge fund universe employing convertible arbitrage strategies. The index selects constituents which exhibit strategies in which the investment thesis is predicated on realization of a spread between related instruments in which one or multiple components of the spread is a convertible fixed income instrument. Strategies employ an investment process designed to isolate attractive opportunities between the price of a convertible security and the price of a non-convertible security, typically of the same issuer. |
| (3) | Bloomberg U.S. Aggregate Bond Index is an unmanaged index comprised of U.S. investment grade, fixed rate bond market securities, including government, government agency, corporate and mortgage-backed securities between one and ten years. Index returns assume reinvestment of dividends. Investors may not invest in the index directly. |
After-tax returns are calculated using the historical highest individual federal marginal income tax rates and do not reflect the impact of state and local taxes. Actual after-tax returns depend on an investor’s tax situation and may differ from those shown. After-tax returns shown are not relevant to investors who hold their Fund shares through tax-advantaged arrangements, such as 401(k) plans or individual retirement accounts. After-tax returns are shown only for the Institutional Shares and after-tax returns for other share classes will vary.
The return after taxes on distributions and sale of Fund shares may exceed the return before taxes due to an assumed tax benefit from any losses on a sale of Fund shares at the end of the measurement period.
The Fund acquired all of the assets and liabilities of the Absolute Flexible Fund, a series of Forum Funds (the “Predecessor Fund”), in a tax-free reorganization on September 8, 2023. In connection with this acquisition, shares of the Predecessor Fund’s Institutional Class shares were exchanged for Institutional Class shares of the Fund. The Predecessor Fund had an investment objective and strategies that were, in all material respects, the same as those of the Fund, and was managed in a manner that, in all material respects, complied with the investment guidelines and restrictions of the Fund. The Fund’s performance for periods prior to September 11, 2023 is that of the Predecessor Fund. The Fund is a continuation of the Predecessor Fund, and therefore, the performance information includes the performance of the Predecessor Fund.
The bar chart and table that follow provide some indication of the risks of investing in the Fund by showing changes in the performance of the Fund from year to year and by showing how the Fund’s average annual returns compare with those of a broad based securities market index and a secondary performance index. The performance of the Predecessor Fund was calculated net of the Predecessor Fund’s fees and expenses. The performance of the Predecessor Fund is not the performance of the Fund, has not been restated to reflect the fees, expenses and fee waivers and/or expense limitations of the Fund, and is not necessarily indicative of the Fund’s future performance. If the performance of the Predecessor Fund had been restated to reflect the applicable fees and expenses of the Fund, the performance may have been lower than the performance shown in the bar chart and Average Annual Total Returns table below. Updated performance information is available at www.absoluteadvisers.com or by calling (888) 99-ABSOLUTE or (888) 992-2765 (toll free).
Performance information (before and after taxes) represents only past performance and does not necessarily indicate future results.
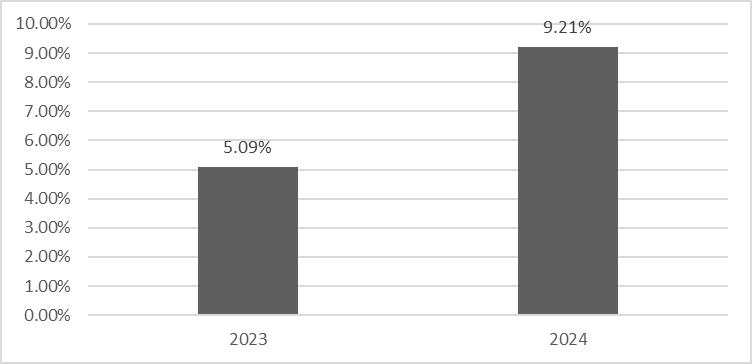
The calendar year-to-date total return as of June 30, 2025, was 4.20%.
Highest/Lowest quarterly results during this time period were:
Highest Quarter: Third Quarter 2024 3.07%
Lowest Quarter: Third Quarter 2023 (0.39)%
| Absolute Flexible Fund | 1 Year | Since Inception (6/30/2022) | ||
| Institutional Shares - Return Before Taxes | 9.21% | 7.09% | ||
| Institutional Shares - Return After Taxes on Distributions | 6.95% | 4.76% | ||
| Institutional Shares - Return After Taxes on Distributions and Sale of Fund Shares | 5.42% | 4.46% | ||
Bloomberg U.S. Aggregate Bond Index(1) (reflects no deduction for fees, expenses or taxes) |
1.25% | 1.45% | ||
S&P 500® Index(2) (reflects no deduction for fees, expenses or taxes) |
25.02% | 21.11% |
| (1) | Bloomberg U.S. Aggregate Bond Index is an unmanaged index comprised of U.S. investment grade, fixed rate bond market securities, including government, government agency, corporate and mortgage-backed securities between one and ten years. Index returns assume reinvestment of dividends. Investors may not invest in the index directly. |
| (2) | S&P 500® Index is a widely recognized unmanaged market capitalization weighted index of 500 leading publicly traded companies in the U.S. and is representative of a broader domestic equity market and range of securities than is found in the Fund’s portfolio. Individuals cannot invest directly in the index; however, an individual can invest in exchange traded funds or other investment vehicles that attempt to track the performance of a benchmark index. Index returns assume reinvestment of dividends and do not reflect any fees or expenses. |
After-tax returns are calculated using the historical highest individual federal marginal income tax rates and do not reflect the impact of state and local taxes. Actual after-tax returns depend on an investor’s tax situation and may differ from those shown. After-tax returns shown are not relevant to investors who hold their Fund shares through tax-advantaged arrangements, such as 401(k) plans or individual retirement accounts.
The return after taxes on distributions and sale of Fund shares may exceed the return before taxes due to an assumed tax benefit from any losses on a sale of Fund shares at the end of the measurement period.