Concurrently with the Fund’s commencement of operations, the Fund will acquire all of the assets and liabilities of the Predecessor Mutual Fund, in a tax-free reorganization (the “Reorganization”). In connection with the Reorganization, shares of the Predecessor Mutual Fund will be exchanged for shares of the Fund. The Predecessor Mutual Fund had an investment objective and investment strategies that were, substantially similar as those of the Fund. The Fund’s performance for periods prior to July 14, 2025 is that of the Predecessor Mutual Fund’s Class A Shares.
The bar chart and table below provide some indication of the risks of investing in the Fund. The Fund is adopting the performance of the Predecessor Mutual Fund as the result of the Reorganization. The bar chart shows changes in the Predecessor Mutual Fund’s Class A Shares performance from year to year. The table shows how the Predecessor Mutual Fund’s average annual returns for 1 year, 5 years and since inception periods compared with those of a broad-based securities market index as well as a secondary index. Had the Predecessor Mutual Fund been structured as an ETF, its performance may have differed. The Fund’s (and the Predecessor Mutual Fund’s) past performance (before and after taxes) is not necessarily an indication of how the Fund will perform in the future. Updated performance information for the Fund, including its current net asset value per share, is available on the Fund’s website at www.otgam.net/products/exchanged-traded-fund/latin-america-etf-otgl or by calling toll-free at 888-632-3399.
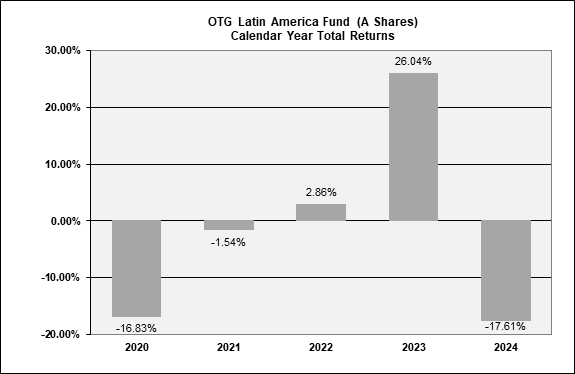
During the periods shown, the highest quarterly return was 24.08% (quarter ended December 31, 2020) and the lowest quarterly return was -41.93% (quarter ended March 31, 2020).
The year-to-date return as of June 30, 2025 was 24.74%.
| Average Annual Returns for Periods Ended December 31, 2024 | One Year | Five Year | Since Inception (05/08/2019) |
| Predecessor Mutual Fund – OTG Latin American Fund | |||
| Return Before Taxes | (17.61)% | (2.64)% | (2.04)% |
| Return After Taxes on Distributions | (17.78)% | (3.88)% | (3.23)% |
| Return After Taxes on Distributions and Sale of Fund Shares1 | (10.18)% | (2.46)% | (1.99)% |
| MSCI AWCI ex-USA Index (reflects no deduction for fees, expense, or taxes)2 | 6.09% | 4.61% | 5.82% |
| MSCI EM Latin America Index (reflects no deduction for fees, expenses, or taxes) | (30.43)% | (8.68)% | (6.47)% |
| 1 | This table shows returns for the Predecessor Mutual Fund. After-tax returns are calculated using the historical highest individual federal marginal income tax rates and do not reflect the impact of state and local taxes. Actual after-tax returns depend on an investor’s tax situation and may differ from those shown, and after-tax returns shown are not relevant to investors who hold their shares through tax-deferred arrangements, such as 401(k) plans or individual retirement accounts. |
| 2 | The MSCI ACWI ex-USA Index is the Fund’s new broad-based securities market index. The Fund will continue to show performance for the Fund’s previous broad-based securities market index, the MSCI EM Latin America Index, which is an additional benchmark index. |