Annual Total Returns
|
|
12 Months Ended |
Mar. 31, 2025 |
Dec. 31, 2024 |
Dec. 31, 2023 |
Dec. 31, 2022 |
Dec. 31, 2021 |
Dec. 31, 2020 |
Dec. 31, 2019 |
Dec. 31, 2018 |
Dec. 31, 2017 |
Dec. 31, 2016 |
Dec. 31, 2015 |
| Optimum Large Cap Growth Fund |
|
|
|
|
|
|
|
|
|
|
|
| Bar Chart |
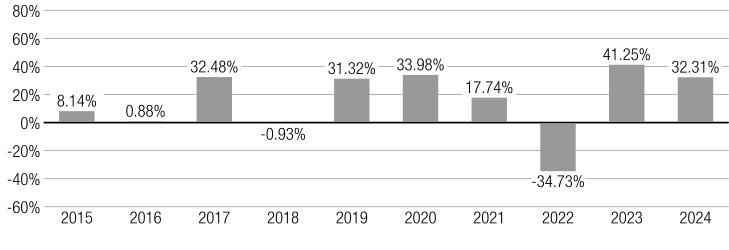
Calendar year-by-year total return
|
|
|
|
|
|
|
|
|
|
|
| Bar Chart |
Year
| 2015
| 2016
| 2017
| 2018
| 2019
| 2020
| 2021
| 2022
| 2023
| 2024
|
Year Total Return
| 8.14%
| 0.88%
| 32.48%
| -0.93%
| 31.32%
| 33.98%
| 17.74%
| -34.73%
| 41.25%
| 32.31%
|
|
|
|
|
|
|
|
|
|
|
|
| Bar Chart Closing |
As of June 30, 2025, the Fund’s Institutional Class shares had a calendar year-to-date return of 4.30%. During the periods illustrated in this bar chart, the Institutional Class’s highest quarterly return was 26.94% for the quarter ended June 30, 2020, and its lowest quarterly return was -24.17% for the quarter ended June 30, 2022.
|
|
|
|
|
|
|
|
|
|
|
| Optimum Large Cap Growth Fund | Institutional Class |
|
|
|
|
|
|
|
|
|
|
|
| Year Total Return |
|
32.31%
|
41.25%
|
(34.73%)
|
17.74%
|
33.98%
|
31.32%
|
(0.93%)
|
32.48%
|
0.88%
|
8.14%
|
| Bar Chart, Year to Date Return, Date |
Jun. 30, 2025
|
|
|
|
|
|
|
|
|
|
|
| Bar Chart, Year to Date Return |
4.30%
|
|
|
|
|
|
|
|
|
|
|
| Highest Quarterly Return, Label |
highest quarterly return
|
|
|
|
|
|
|
|
|
|
|
| Highest Quarterly Return |
26.94%
|
|
|
|
|
|
|
|
|
|
|
| Highest Quarterly Return, Date |
Jun. 30, 2020
|
|
|
|
|
|
|
|
|
|
|
| Lowest Quarterly Return, Label |
lowest quarterly return
|
|
|
|
|
|
|
|
|
|
|
| Lowest Quarterly Return |
(24.17%)
|
|
|
|
|
|
|
|
|
|
|
| Lowest Quarterly Return, Date |
Jun. 30, 2022
|
|
|
|
|
|
|
|
|
|
|
| Optimum Large Cap Value Fund |
|
|
|
|
|
|
|
|
|
|
|
| Bar Chart |
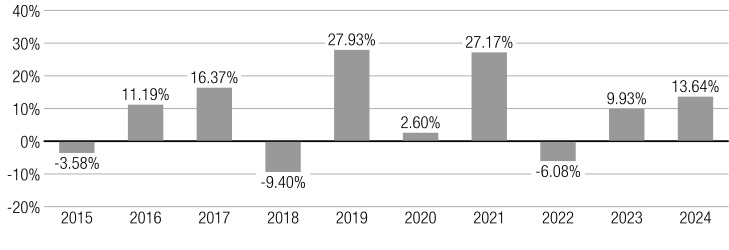
Calendar year-by-year total return
|
|
|
|
|
|
|
|
|
|
|
| Bar Chart |
Year
| 2015
| 2016
| 2017
| 2018
| 2019
| 2020
| 2021
| 2022
| 2023
| 2024
|
Year Total Return
| -3.58%
| 11.19%
| 16.37%
| -9.40%
| 27.93%
| 2.6%
| 27.17%
| -6.08%
| 9.93%
| 13.64%
|
|
|
|
|
|
|
|
|
|
|
|
| Bar Chart Closing |
As of June 30, 2025 , the Fund’s Institutional Class shares had a calendar year-to-date return of 6.20%. During the periods illustrated in this bar chart, the Institutional Class’s highest quarterly return was 13.66% for the quarter ended June 30, 2020, and its lowest quarterly return was -24.93% for the quarter ended March 31, 2020.
|
|
|
|
|
|
|
|
|
|
|
| Optimum Large Cap Value Fund | Insitutional Class |
|
|
|
|
|
|
|
|
|
|
|
| Year Total Return |
|
13.64%
|
9.93%
|
(6.08%)
|
27.17%
|
2.60%
|
27.93%
|
(9.40%)
|
16.37%
|
11.19%
|
(3.58%)
|
| Bar Chart, Year to Date Return, Date |
Jun. 30, 2025
|
|
|
|
|
|
|
|
|
|
|
| Bar Chart, Year to Date Return |
6.20%
|
|
|
|
|
|
|
|
|
|
|
| Highest Quarterly Return, Label |
highest quarterly return
|
|
|
|
|
|
|
|
|
|
|
| Highest Quarterly Return |
13.66%
|
|
|
|
|
|
|
|
|
|
|
| Highest Quarterly Return, Date |
Jun. 30, 2020
|
|
|
|
|
|
|
|
|
|
|
| Lowest Quarterly Return, Label |
lowest quarterly return
|
|
|
|
|
|
|
|
|
|
|
| Lowest Quarterly Return |
(24.93%)
|
|
|
|
|
|
|
|
|
|
|
| Lowest Quarterly Return, Date |
Mar. 31, 2020
|
|
|
|
|
|
|
|
|
|
|
| Optimum Small-Mid Cap Growth Fund |
|
|
|
|
|
|
|
|
|
|
|
| Bar Chart |
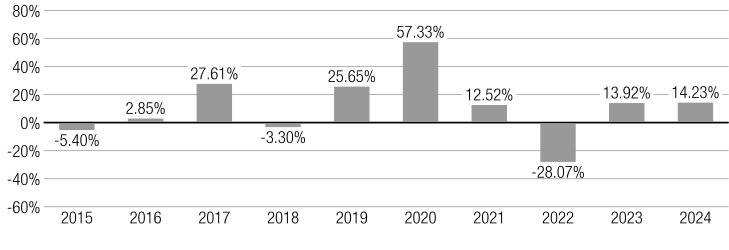
Calendar year-by-year total return
|
|
|
|
|
|
|
|
|
|
|
| Bar Chart |
Year
| 2015
| 2016
| 2017
| 2018
| 2019
| 2020
| 2021
| 2022
| 2023
| 2024
|
Year Total Return
| -5.40%
| 2.85%
| 27.61%
| -3.30%
| 25.65%
| 57.33%
| 12.52%
| -28.07%
| 13.92%
| 14.23%
|
|
|
|
|
|
|
|
|
|
|
|
| Bar Chart Closing |
As of June 30, 2025 , the Fund’s Institutional Class shares had a calendar year-to-date return of -2.25%. During the periods illustrated in this bar chart, the Institutional Class’s highest quarterly return was 36.53% for the quarter ended June 30, 2020, and its lowest quarterly return was -21.65% for the quarter ended December 31, 2018.
|
|
|
|
|
|
|
|
|
|
|
| Optimum Small-Mid Cap Growth Fund | Institutional Class |
|
|
|
|
|
|
|
|
|
|
|
| Year Total Return |
|
14.23%
|
13.92%
|
(28.07%)
|
12.52%
|
57.33%
|
25.65%
|
(3.30%)
|
27.61%
|
2.85%
|
(5.40%)
|
| Bar Chart, Year to Date Return, Date |
Jun. 30, 2025
|
|
|
|
|
|
|
|
|
|
|
| Bar Chart, Year to Date Return |
(2.25%)
|
|
|
|
|
|
|
|
|
|
|
| Highest Quarterly Return, Label |
highest quarterly return
|
|
|
|
|
|
|
|
|
|
|
| Highest Quarterly Return |
36.53%
|
|
|
|
|
|
|
|
|
|
|
| Highest Quarterly Return, Date |
Jun. 30, 2020
|
|
|
|
|
|
|
|
|
|
|
| Lowest Quarterly Return, Label |
lowest quarterly return
|
|
|
|
|
|
|
|
|
|
|
| Lowest Quarterly Return |
(21.65%)
|
|
|
|
|
|
|
|
|
|
|
| Lowest Quarterly Return, Date |
Dec. 31, 2018
|
|
|
|
|
|
|
|
|
|
|
| Optimum Small-Mid Cap Value Fund |
|
|
|
|
|
|
|
|
|
|
|
| Bar Chart |
Calendar year-by-year total return
|
|
|
|
|
|
|
|
|
|
|
| Bar Chart |

Year
| 2015
| 2016
| 2017
| 2018
| 2019
| 2020
| 2021
| 2022
| 2023
| 2024
|
Year Total Return
| -10.76%
| 18.43%
| 9.75%
| -16.39%
| 24.58%
| 1.42%
| 29.11%
| -14.08%
| 10.56%
| 10.21%
|
|
|
|
|
|
|
|
|
|
|
|
| Bar Chart Closing |
As of June 30, 2025 , the Fund’s Institutional Class shares had a calendar year-to-date return of -3.48%. During the periods illustrated in this bar chart, the Institutional Class’s highest quarterly return was 26.62% for the quarter ended December 31, 2020, and its lowest quarterly return was -35.83% for the quarter ended March 31, 2020.
|
|
|
|
|
|
|
|
|
|
|
| Optimum Small-Mid Cap Value Fund | Institutional Class |
|
|
|
|
|
|
|
|
|
|
|
| Year Total Return |
|
10.21%
|
10.56%
|
(14.08%)
|
29.11%
|
1.42%
|
24.58%
|
(16.39%)
|
9.75%
|
18.43%
|
(10.76%)
|
| Bar Chart, Year to Date Return, Date |
Jun. 30, 2025
|
|
|
|
|
|
|
|
|
|
|
| Bar Chart, Year to Date Return |
(3.48%)
|
|
|
|
|
|
|
|
|
|
|
| Highest Quarterly Return, Label |
highest quarterly return
|
|
|
|
|
|
|
|
|
|
|
| Highest Quarterly Return |
26.62%
|
|
|
|
|
|
|
|
|
|
|
| Highest Quarterly Return, Date |
Dec. 31, 2020
|
|
|
|
|
|
|
|
|
|
|
| Lowest Quarterly Return, Label |
lowest quarterly return
|
|
|
|
|
|
|
|
|
|
|
| Lowest Quarterly Return |
(35.83%)
|
|
|
|
|
|
|
|
|
|
|
| Lowest Quarterly Return, Date |
Mar. 31, 2020
|
|
|
|
|
|
|
|
|
|
|
| Optimum International Fund |
|
|
|
|
|
|
|
|
|
|
|
| Bar Chart |
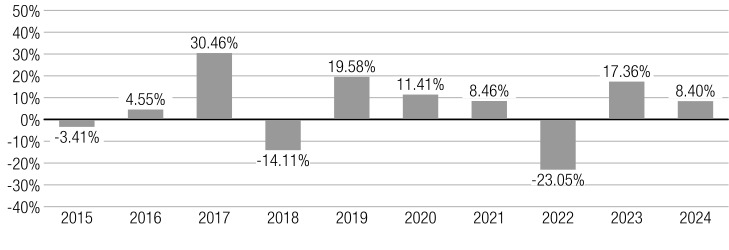
Calendar year-by-year total return
|
|
|
|
|
|
|
|
|
|
|
| Bar Chart |
Year
| 2015
| 2016
| 2017
| 2018
| 2019
| 2020
| 2021
| 2022
| 2023
| 2024
|
Year Total Return
| -3.41%
| 4.55%
| 30.46%
| -14.11%
| 19.58%
| 11.41%
| 8.46%
| -23.05%
| 17.36%
| 8.4%
|
|
|
|
|
|
|
|
|
|
|
|
| Bar Chart Closing |
As of June 30, 2025 , the Fund’s Institutional Class shares had a calendar year-to-date return of 18.53%. During the periods illustrated in this bar chart, the Institutional Class’s highest quarterly return was 23.13% for the quarter ended December 31, 2020, and its lowest quarterly return was -25.58% for the quarter ended March 31, 2020.
|
|
|
|
|
|
|
|
|
|
|
| Optimum International Fund | Institutional Class |
|
|
|
|
|
|
|
|
|
|
|
| Year Total Return |
|
8.40%
|
17.36%
|
(23.05%)
|
8.46%
|
11.41%
|
19.58%
|
(14.11%)
|
30.46%
|
4.55%
|
(3.41%)
|
| Bar Chart, Year to Date Return, Date |
Jun. 30, 2025
|
|
|
|
|
|
|
|
|
|
|
| Bar Chart, Year to Date Return |
18.53%
|
|
|
|
|
|
|
|
|
|
|
| Highest Quarterly Return, Label |
highest quarterly return
|
|
|
|
|
|
|
|
|
|
|
| Highest Quarterly Return |
23.13%
|
|
|
|
|
|
|
|
|
|
|
| Highest Quarterly Return, Date |
Dec. 31, 2020
|
|
|
|
|
|
|
|
|
|
|
| Lowest Quarterly Return, Label |
lowest quarterly return
|
|
|
|
|
|
|
|
|
|
|
| Lowest Quarterly Return |
(25.58%)
|
|
|
|
|
|
|
|
|
|
|
| Lowest Quarterly Return, Date |
Mar. 31, 2020
|
|
|
|
|
|
|
|
|
|
|
| Optimum Fixed Income Fund |
|
|
|
|
|
|
|
|
|
|
|
| Bar Chart |
Calendar year-by-year total return
|
|
|
|
|
|
|
|
|
|
|
| Bar Chart |
Year
| 2015
| 2016
| 2017
| 2018
| 2019
| 2020
| 2021
| 2022
| 2023
| 2024
|
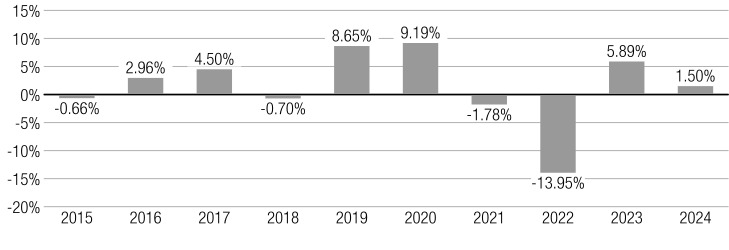
Year Total Return
| -0.66%
| 2.96%
| 4.50%
| -0.70%
| 8.65%
| 9.19%
| -1.78%
| -13.95%
| 5.89%
| 1.5%
|
|
|
|
|
|
|
|
|
|
|
|
| Bar Chart Closing |
As of June 30, 2025 , the Fund’s Institutional Class shares had a calendar year-to-date return of 4.12%. During the periods illustrated in this bar chart, the Institutional Class’s highest quarterly return was 7.10% for the quarter ended December 31, 2023, and its lowest quarterly return was -6.20% for the quarter ended June 30, 2022.
|
|
|
|
|
|
|
|
|
|
|
| Optimum Fixed Income Fund | Institutional Class |
|
|
|
|
|
|
|
|
|
|
|
| Year Total Return |
|
1.50%
|
5.89%
|
(13.95%)
|
(1.78%)
|
9.19%
|
8.65%
|
(0.70%)
|
4.50%
|
2.96%
|
(0.66%)
|
| Bar Chart, Year to Date Return, Date |
Jun. 30, 2025
|
|
|
|
|
|
|
|
|
|
|
| Bar Chart, Year to Date Return |
4.12%
|
|
|
|
|
|
|
|
|
|
|
| Highest Quarterly Return, Label |
highest quarterly return
|
|
|
|
|
|
|
|
|
|
|
| Highest Quarterly Return |
7.10%
|
|
|
|
|
|
|
|
|
|
|
| Highest Quarterly Return, Date |
Dec. 31, 2023
|
|
|
|
|
|
|
|
|
|
|
| Lowest Quarterly Return, Label |
lowest quarterly return
|
|
|
|
|
|
|
|
|
|
|
| Lowest Quarterly Return |
(6.20%)
|
|
|
|
|
|
|
|
|
|
|
| Lowest Quarterly Return, Date |
Jun. 30, 2022
|
|
|
|
|
|
|
|
|
|
|