Pay Versus Performance Table
|
Year |
Summary Compensation Table Total for PEO (1) |
Compensation Actually Paid to PEO (2) |
Average Summary Compensation Table Total for Non-PEO NEOs (3) |
Average Compensation Actually Paid to Non-PEO NEOs (4) |
Value of Initial Fixed $100 Investment Based on Cumulative TSR (5) |
Net Income (Loss) (in thousands) |
||||||||||||||||||
|
2022 |
$ | 1,082,240 | $ | 1,082,240 | $ | 506,787 | $ | 506,787 | $ | 126 | $ | 1,448 | ||||||||||||
|
2023 |
$ | 894,667 | $ | 894,667 | $ | 382,120 | $ | 382,120 | $ | 69 | $ | (3,078 | ) | |||||||||||
|
2024 |
$ | 910,075 | $ | 910,075 | $ | 439,927 | $ | 439,927 | $ | 97 | $ | (6,599 | ) | |||||||||||
|
(1) |
The dollar amounts reported in this column are the amounts of total compensation reported for the PEO for each corresponding year in the “Total” column of the Summary Compensation Table. |
|
(2) |
The dollar amounts reported in this column represent the amount of “compensation actually paid” to the PEO, as computed in accordance with Item 402(v) of Regulation S-K. No adjustments were required to be made to the PEO’s total compensation for each year to determine the compensation actually paid pursuant to the requirements of Item 402(v) of Regulation S-K. |
|
(3) |
The dollar amounts reported in this column represent the average of the amounts reported for Non-PEO NEOs in the “Total” column of the Summary Compensation Table in each applicable year. |
|
(4) |
The dollar amounts reported in this column represent the average amount of “compensation actually paid” to the non-PEO NEOs as a group, as computed in accordance with Item 402(v) of Regulation S-K. No adjustments were required to be made to average total compensation for the non-PEO NEOs as a group for each year to determine the compensation actually paid pursuant to the requirements of Item 402(v) of Regulation S-K. |
|
(5) |
The cumulative total shareholder return (“TSR”) amounts reported in this column are calculated by dividing the sum of the cumulative amount of dividends for the measurement period, assuming dividend reinvestment, and the difference between the Company’s share price at the end and the beginning of the measurement period by the Company’s share price at the beginning of the measurement period. No dividends were paid on stock or option awards in fiscal 2022, fiscal 2023 or fiscal 2024. |
|
(6) |
The dollar amounts reported in this column represent the amount of net income reflected in the Company’s audited financial statements for the applicable year. |
Narrative Disclosure to Pay Versus Performance Table
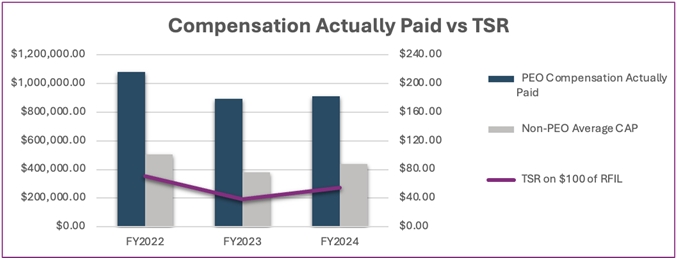
Compensation Actually Paid and Cumulative Total Shareholder Return. The graph below compares the compensation actually paid to our PEO and the average of the compensation actually paid to our remaining NEOs, with our cumulative total stockholder return for the fiscal years ended October 31, 2024, 2023 and 2022. Total stockholder return amounts reported in the graph assume an initial fixed investment of $100 on November 1, 2021.
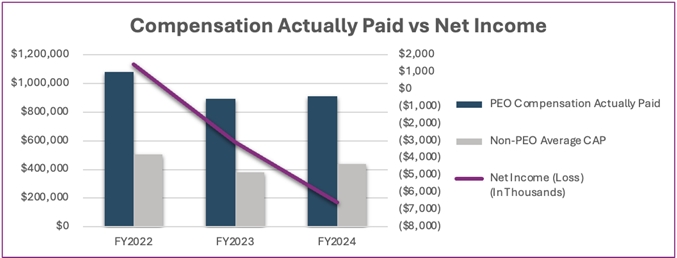
Compensation Actually Paid and Net Income. The graph below compares the compensation actually paid to our PEO and the average of the compensation actually paid to our remaining NEOs, with our net income for the fiscal years ended October 31, 2024, 2023 and 2022.