Provide the opportunity for capital appreciation with some opportunity to generate income.
This table describes the fees and expenses that you may pay if you buy, hold, and sell Fund shares. You may pay other fees, such as brokerage commissions and other fees to financial intermediaries, which are not reflected in this table and examples below.
This Example is intended to help you compare the cost of investing in the Fund with the cost of investing in other mutual funds. The Example assumes that you invest $10,000 in the Fund for the time periods indicated and then redeem or hold all of your shares at the end of those periods. The Example also assumes that your investment has a 5% return each year and that the Fund's operating expenses remain the same.
The Fund pays transaction costs, such as commissions, when it buys and sells securities (or "turns over" its portfolio). A higher portfolio turnover rate may indicate higher transaction costs and may result in higher taxes when Fund shares are held in a taxable account. These costs, which are not reflected in annual Fund operating expenses or in the Example, affect the Fund's performance. During the most recent fiscal year, the Fund's portfolio turnover rate was 9% of the average value of its portfolio.
GoalLink Strategy Component
The Fund is designed to be one component of a broader strategy (GoalLink Strategy) employed by SEI Investments Management Corporation (SIMC or the Adviser), in which shareholders allocate their overall investment portfolio among investments in the Fund as well as one or more SEI funds that invest primarily in municipal bonds (Muni Bond Funds). The allocation between the Fund and the Muni Bond Funds is based on models developed by SIMC and selected by the shareholder (in consultation with his or her investment adviser). Accordingly, the Fund is not recommended for persons who do not participate in the GoalLink Strategy.
Investment Strategy
Under normal circumstances, the Fund will seek to provide the opportunity for capital appreciation with some opportunity to generate income. The Fund invests in other SEI funds (which may include exchange-traded funds (ETFs)), each of which has its own investment goal (the Underlying SEI Funds), that form the non-Underlying Muni Bond Fund component of the GoalLink Strategy. The Underlying SEI Funds invest, in turn, in securities and other instruments of various asset classes. Each of the Underlying SEI Funds is managed by one or more sub-advisers (each, a Sub-Adviser and collectively, the Sub-Advisers) under the supervision of SIMC, or, in certain circumstances, is managed directly by SIMC.
The Fund's assets may be diversified across Underlying SEI equity funds, bond and money market funds, and real estate funds. The equity funds may consist of a wide range of investment styles that provide investment exposure to U.S. and/or foreign equity securities of companies of various capitalization ranges. The bond funds may consist of a wide range of investment styles that provide exposure to U.S. and/or foreign fixed income securities of varying credit quality (including junk bonds), maturity and duration. The real estate funds provide exposure to the equity securities of real estate companies.
The Fund's assets are allocated among a variety of Underlying SEI Funds within the following percentage ranges:
|
Underlying SEI Fund Type |
Investment Range (Percentage of the Fund's Assets) |
||||||
|
U.S. Equity Funds |
30-100 |
% |
|||||
|
International Equity Funds |
0-70 |
% |
|||||
|
Non-Investment Grade Bond Funds |
0-70 |
% |
|||||
|
Investment Grade Bond & Money Market Funds |
0-50 |
% |
|||||
|
Real Estate Funds |
0-40 |
% |
|||||
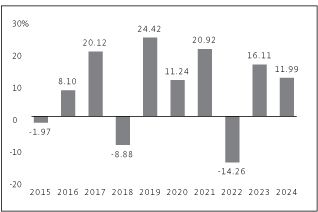
The bar chart and the performance table below provide some indication of the risks of investing in the Fund by showing changes in the Fund's performance from year to year for the past ten calendar years and by showing how the Fund's average annual returns for 1, 5 and 10 years, and since the Fund's inception, compared with those of a broad measure of market performance. The Fund's past performance (before and after taxes) is not necessarily an indication of how the Fund will perform in the future. For current performance information, please call 1-800-DIAL-SEI.
|
|
Best Quarter: 18.33% (6/30/2020) Worst Quarter: -22.92% (3/31/2020) The Fund's Class F total return (pre-tax) from January 1, 2025 to June 30, 2025 was 8.16%. |
||||||
This table compares the Fund's average annual total returns for Class F Shares to those of an appropriate broad-based index and an additional index with characteristics relevant to the Fund's investment strategy. The additional index is the Fund's Blended Benchmark index, which consists of the ICE BofA US High Yield Constrained Index (USD) (10%), the S&P 500 Index (75%) and the MSCI EAFE Index (15%).
After-tax returns are calculated using the historical highest individual federal marginal income tax rates and do not reflect the impact of state and local taxes. Your actual after-tax returns will depend on your tax situation and may differ from those shown. After-tax returns shown are not relevant to investors who hold their Fund shares through tax-deferred arrangements, such as 401(k) plans or individual retirement accounts.
Equity Market Risk — The risk that the market value of a security may move up and down, sometimes rapidly and unpredictably. Market risk may affect a single issuer, an industry, a sector or the equity or bond market as a whole. Equity markets may decline significantly in response to adverse issuer, political, regulatory, market, economic or other developments that may cause broad changes in market value, public perceptions concerning these developments, and adverse investor sentiment or publicity. Similarly, environmental and public health risks, such as natural disasters or epidemics, or widespread fear that such events may occur, may impact markets adversely and cause market volatility in both the short- and long-term.
Fixed Income Market Risk — The prices of fixed income securities respond to economic developments, particularly interest rate changes, as well as to perceptions about the creditworthiness of individual issuers, including governments and their agencies. Generally, an Underlying SEI Fund's fixed income securities will decrease in value if interest rates rise and vice versa. In a low interest rate environment, risks associated with rising rates are heightened. Declines in dealer market-making capacity as a result of structural or regulatory changes could decrease liquidity and/or increase volatility in the fixed income markets. Markets for fixed income securities may decline significantly in response to adverse issuer, political, regulatory, market, economic or other developments that may cause broad changes in market value, public perceptions concerning these developments, and adverse investor sentiment or publicity. Similarly, environmental and public health risks, such as natural disasters or epidemics, or widespread fear that such events may occur, may impact markets adversely and cause market volatility in both the short- and long-term. In response to these events, the Underlying SEI Fund's and, in turn, the Fund's value may fluctuate and/or the Underlying SEI Fund and the Fund may experience increased redemptions from shareholders, which may impact the Underlying SEI Fund's and the Fund's liquidity or force the Underlying SEI Fund and the Fund to sell securities into a declining or illiquid market.
Strategy Risk — The Fund is intended to be used only as a part of the GoalLink Strategy and is not designed as a stand-alone investment. The overall investment risk to a shareholder is significantly different when not combined with recommended investments in SEI funds that invest primarily in municipal bonds as part of a GoalLink Strategy.
Taxation Risk — The Fund is managed to minimize tax consequences to investors, but will likely earn taxable income and gains from time to time.
Investment Company Risk — When the Fund or an Underlying SEI Fund invests in an investment company, in addition to directly bearing the expenses associated with its own operations, it will bear a pro rata portion of the investment company's expenses. In addition, while the risks of owning shares of an investment company generally reflect the risks of owning the underlying investments of the investment company, the Fund may be subject to additional or different risks than if the Fund or an Underlying SEI Fund had invested directly in the underlying investments.
Asset Allocation Risk — The risk that SIMC's decisions regarding asset classes and Underlying SEI Funds will not anticipate market trends successfully.
Small and Medium Capitalization Risk — Small and medium capitalization companies may be more vulnerable to adverse business or economic events than larger, more established companies. In particular, small and medium capitalization companies may have limited product lines, markets and financial resources and may
depend upon a relatively small management group. Therefore, small and medium capitalization stocks may be more volatile than those of larger companies. Small and medium capitalization stocks may be traded over-the-counter (OTC). OTC stocks may trade less frequently and in smaller volume than exchange listed stocks and may have more price volatility than that of exchange-listed stocks.
Large Capitalization Risk — The risk that larger, more established companies may be unable to respond quickly to new competitive challenges such as changes in technology and consumer tastes. Larger companies also may not be able to attain the high growth rates of successful smaller companies.
U.S. Government Securities Risk — Although U.S. Government securities are considered to be among the safest investments, they are still subject to the credit risk of the U.S. Government and are not guaranteed against price movements due to changing interest rates. Obligations issued by some U.S. Government agencies are backed by the U.S. Treasury, while others are backed solely by the ability of the agency to borrow from the U.S. Treasury or by the agency's own resources. No assurance can be given that the U.S. Government will provide financial support to its agencies and instrumentalities if it is not obligated by law to do so.
Below Investment Grade Securities (Junk Bonds) Risk — Fixed income securities rated below investment grade (junk bonds) involve greater risk of default or downgrade and are generally more volatile than investment grade securities because the prospect for repayment of principal and interest of many of these securities is speculative. Because these securities typically offer a higher rate of return to compensate for these risks, they are sometimes referred to as "high yield bonds," but there is no guarantee that an investment in these securities will result in a high rate of return.
Interest Rate Risk — The risk that a change in interest rates will cause a fall in the value of fixed income securities, including U.S. Government securities, in which the Underlying SEI Funds invest. Generally, the value of the Underlying SEI Funds' fixed income securities will vary inversely with the direction of prevailing interest rates. Changing interest rates may have unpredictable effects on the markets and may affect the value and liquidity of instruments held by an Underlying SEI Fund. Although U.S. Government securities are considered to be among the safest investments, they are not guaranteed against price movements due to changing interest rates.
Foreign Investment/Emerging Markets Risk — The risk that non-U.S. securities may be subject to additional risks due to, among other things, political, social and economic developments abroad, currency movements, and different legal, regulatory, tax, accounting and audit environments. These additional risks may be heightened with respect to emerging market countries because political turmoil and rapid changes in economic conditions are more likely to occur in these countries. Investments in emerging markets are subject to the added risk that information in emerging market investments may be unreliable or outdated due to differences in regulatory, accounting or auditing and financial record keeping standards, or because less information about emerging market investments is publicly available. In addition, the rights and remedies associated with emerging market investments may be different than investments in developed markets. A lack of reliable information, rights and remedies increase the risks of investing in emerging markets in comparison to more developed markets. In addition, periodic U.S. Government restrictions on investments in issuers from certain foreign countries may require the Fund or an Underlying SEI Fund to sell such investments at inopportune times, which could result in losses to the Fund or an Underlying SEI Fund.
Real Estate Industry Risk — Securities of companies principally engaged in the real estate industry may be subject to the risks associated with the direct ownership of real estate. Risks commonly associated with the
direct ownership of real estate include fluctuations in the value of underlying properties, defaults by borrowers or tenants, changes in interest rates and risks related to general or local economic conditions.
Short Sales Risk — A short sale involves the sale of a security that an Underlying SEI Fund does not own in the expectation of purchasing the same security (or a security exchangeable therefore) at a later date at a lower price. Short sales entered into by an Underlying SEI Fund expose the Fund to the risk that the Underlying SEI Fund will be required to buy a security sold short (also known as "covering" the short position) at a time when the security has appreciated in value, thus resulting in a loss to the Underlying SEI Fund and, therefore, the Fund, that is potentially unlimited. Reinvesting proceeds received from short selling may create leverage, which can amplify the effects of market volatility on the share price of an Underlying SEI Fund and, therefore, the Fund. Investment in short sales may also cause an Underlying SEI Fund to incur expenses related to borrowing securities. In addition, shorting a future contract may require posting only a margin that may amount to less than the notional exposure of the contract. Such a practice may exacerbate the loss in a case of adverse price action.
Exchange-Traded Products (ETPs) Risk — The risks of owning interests of an ETP, such as an ETF or exchange-traded commodity pool, generally reflect the same risks as owning the underlying securities or other instruments that the ETP is designed to track. The shares of certain ETPs may trade at a premium or discount to their intrinsic value (i.e., the market value may differ from the net asset value of an ETP's shares). For example, supply and demand for shares of an ETF or market disruptions may cause the market price of the ETF to deviate from the value of the ETF's investments, which may be emphasized in less liquid markets. By investing in an ETP, the Fund or an Underlying SEI Fund indirectly bears the proportionate share of any fees and expenses of the ETP in addition to the fees and expenses that the Fund and its shareholders directly bear in connection with the Fund's operations. Because certain ETPs may have a significant portion of their assets exposed directly or indirectly to commodities or commodity-linked securities, developments affecting commodities may have a disproportionate impact on such ETPs and may subject the ETPs to greater volatility than investments in traditional securities.
| [1] | Because the Market Growth Strategy Allocation Fund (Fund) incurred AFFE during the most recent fiscal year, the operating expenses in this fee table will not correlate to the expense ratio in the Fund's financial statements (or the "Financial Highlights" section in the prospectus) because the financial statements include only the direct operating expenses incurred by the Fund, not the indirect costs of investing in underlying funds. |