Capital appreciation while maintaining broad equity and fixed income market participation.
This table describes the fees and expenses that you may pay if you buy, hold, and sell Fund shares. You may pay other fees, such as brokerage commissions and other fees to financial intermediaries, which are not reflected in this table and examples below.
|
(expenses that you pay each year as a percentage of the value of your investment) |
Class F Shares |
||||||
|
Management Fees* |
0.10 |
% |
|||||
|
Distribution (12b-1) Fees |
None |
||||||
|
Other Expenses* |
0.55 |
% |
|||||
|
Acquired Fund Fees and Expenses (AFFE) |
0.69 |
% |
|||||
|
Total Annual Fund Operating Expenses |
1.34 |
%† |
|||||
† Because the Market Growth Strategy Fund (Fund) incurred AFFE during the most recent fiscal year, the operating expenses in this fee table will not correlate to the expense ratio in the Fund's financial statements (or the "Financial Highlights" section in the prospectus) because the financial statements include only the direct operating expenses incurred by the Fund, not the indirect costs of investing in underlying funds.
This Example is intended to help you compare the cost of investing in the Fund with the cost of investing in other mutual funds. The Example assumes that you invest $10,000 in the Fund for the time periods indicated and then redeem or hold all of your shares at the end of those periods. The Example also assumes that your investment has a 5% return each year and that the Fund's operating expenses remain the same.
|
1 Year |
3 Years |
5 Years |
10 Years |
||||||||||||||||
|
Market Growth Strategy Fund — Class F Shares |
$ |
136 |
$ |
425 |
$ |
734 |
$ |
1,613 |
|||||||||||
The Fund pays transaction costs, such as commissions, when it buys and sells securities (or "turns over" its portfolio). A higher portfolio turnover rate may indicate higher transaction costs and may result in higher taxes when Fund shares are held in a taxable account. These costs, which are not reflected in annual Fund operating expenses or in the Example, affect the Fund's performance. During the most recent fiscal year, the Fund's portfolio turnover rate was 35% of the average value of its portfolio.
Under normal circumstances, the Fund will seek to generate capital appreciation while maintaining broad equity and fixed income market participation. The Fund predominantly invests in other SEI funds (including exchange-traded funds (ETFs)), each of which has its own investment goal (the Underlying SEI Funds). The Underlying SEI Funds invest, in turn, in securities and other instruments of various asset classes. Each of the Underlying SEI Funds is managed by one or more sub-advisers (each, a Sub-Adviser and collectively, the Sub-Advisers) under the supervision of SEI Investments Management Corporation (SIMC or the Adviser), or, in certain circumstances, is managed directly by SIMC.
The Fund's assets may be diversified across Underlying SEI equity funds, bond and money market funds, real estate funds and multi-asset funds. The equity funds may consist of a wide range of investment styles that provide investment exposure to U.S. and/or foreign equity securities of companies of various capitalization ranges. The bond funds may consist of a wide range of investment styles that provide exposure to U.S. and/or foreign fixed income securities of varying credit quality (including junk bonds), maturity and duration. The real estate funds provide exposure to the equity securities of real estate companies. The multi-asset funds consist of funds that seek to achieve their investment goals by selecting investments from among a broad range of asset classes. A multi-asset fund may also adjust its allocation among asset classes over short periods of time, and therefore it may provide the Fund with a dynamic investment component. Although a multi-asset fund could consist of equity securities, bonds or real estate securities, it may also provide exposure to additional asset classes, such as commodities.
The Fund's assets are allocated among a variety of Underlying SEI Funds within the following percentage ranges:
|
Underlying SEI Fund Type |
Investment Range (Percentage of the Fund's Assets) |
||||||
|
U.S. Equity Funds |
10-85 |
% |
|||||
|
Multi-Asset Investment Funds |
0-60 |
% |
|||||
|
Investment Grade Bond & Money Market Funds |
0-50 |
% |
|||||
|
Non-Investment Grade Bond Funds |
0-35 |
% |
|||||
|
International Equity Funds |
0-35 |
% |
|||||
|
Real Estate Funds |
0-20 |
% |
|||||
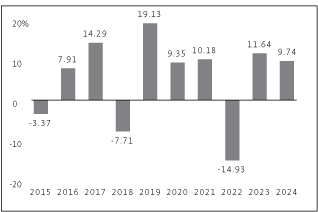
The bar chart and the performance table below provide some indication of the risks of investing in the Fund by showing changes in the Fund's performance from year to year for the past ten calendar years and by showing how the Fund's average annual returns for 1, 5 and 10 years, and since the Fund's inception, compared with those of a broad measure of market performance. The Fund's past performance (before and after taxes) is not necessarily an indication of how the Fund will perform in the future. For current performance information, please call 1-800-DIAL-SEI.
|
|
Best Quarter: 12.89% (6/30/2020) Worst Quarter: -15.97% (3/31/2020) The Fund's Class F total return (pre-tax) from January 1, 2025 to June 30, 2025 was 8.63%. |
||||||
|
|
Best Quarter: 12.89% (6/30/2020) Worst Quarter: -15.97% (3/31/2020) The Fund's Class F total return (pre-tax) from January 1, 2025 to June 30, 2025 was 8.63%. |
||||||
This table compares the Fund's average annual total returns for Class F Shares to those of an appropriate broad-based index and an additional index with characteristics relevant to the Fund's investment strategy. The additional index is the Fund's Blended Benchmark index, which consists of the Bloomberg U.S. Aggregate Bond Index (40%), the Russell 3000 Index (35%) and the MSCI ACWI ex-USA Index (25%).
After-tax returns are calculated using the historical highest individual federal marginal income tax rates and do not reflect the impact of state and local taxes. Your actual after-tax returns will depend on your tax situation and may differ from those shown. After-tax returns shown are not relevant to investors who hold their Fund shares through tax-deferred arrangements, such as 401(k) plans or individual retirement accounts. In some cases, the Fund's return after taxes may exceed the Fund's return before taxes due to an assumed tax benefit from any losses on a sale of Fund shares at the end of the measurement period.
|
Market Growth Strategy Fund — Class F |
1 Year |
5 Years |
10 Years |
Since Inception (11/17/2003) |
|||||||||||||||
|
Return Before Taxes |
9.74 |
% |
4.66 |
% |
5.11 |
% |
5.35 |
% |
|||||||||||
|
Return After Taxes on Distributions |
8.24 |
% |
2.57 |
% |
3.55 |
% |
3.98 |
% |
|||||||||||
|
Return After Taxes on Distributions and Sale of Fund Shares |
6.19 |
% |
3.01 |
% |
3.51 |
% |
3.84 |
% |
|||||||||||
|
S&P 500 Index Return (reflects no deduction for fees, expenses or taxes) |
25.02 |
% |
14.53 |
% |
13.10 |
% |
10.65 |
% |
|||||||||||
|
Blended Benchmark Return (reflects no deduction for fees, expenses or taxes) |
9.92 |
% |
5.92 |
% |
6.32 |
% |
6.75 |
% |
|||||||||||