Pay Versus Performance
The following table sets forth the compensation for our CEOs and the average compensation for our other Named Executive Officers (the "Non-CEO NEOs"), both as reported in the Summary Compensation Table along with certain adjustments to reflect the compensation actually paid to such individuals, as required by Section 953(a) of the Dodd-Frank Wall Street Reform and Consumer Protection Act and Item 402(v) of Regulation S-K, for each of fiscal year 2025, 2024 and 2023. The Compensation Committee did not consider the pay versus performance disclosure below in making its pay decisions for any of the years shown.
Year |
|
Summary Compensation Table Total for CEO (Royal) |
|
Compensation Actually Paid to CEO (Royal) (1) |
|
Summary Compensation Table Total for CEO (Rost) |
|
Compensation Actually Paid to CEO (Rost)(1) |
|
Summary Compensation Table Total for CEO (Marohn) |
|
Compensation Actually Paid to CEO (Marohn)(1) |
|
Average Summary Compensation Table Total for Non-CEO NEOs |
|
Average Compensation Actually Paid to Non-CEO NEOs (1) |
|
Value of Initial Fixed $100 Investment Based On: Total Shareholder Return (2) |
|
Net Income (Loss) (millions) (3) |
|
|||||||||||
(a) |
|
(b) |
|
(c) |
|
(d) |
|
(e) |
|
(f) |
|
(g) |
|
(h) |
|
(i) |
|
(j) |
|
(k) |
|
|||||||||||
|
2025 |
|
$ |
454,500 |
|
$ |
454,500 |
|
$ |
215,627 |
|
$ |
215,627 |
|
$ |
|
$ |
|
$ |
175,064 |
|
$ |
175,064 |
|
$ |
89.32 |
|
$ |
(5.15 |
) |
||
|
2024 |
|
$ |
|
$ |
|
$ |
306,870 |
|
$ |
306,870 |
|
$ |
|
$ |
|
$ |
359,038 |
|
$ |
359,391 |
|
$ |
63.95 |
|
$ |
20.80 |
|
||||
|
2023 |
|
$ |
|
$ |
|
$ |
282,991 |
|
$ |
282,991 |
|
$ |
208,052 |
|
$ |
(76,519 |
) |
$ |
208,216 |
|
$ |
277,525 |
|
$ |
58.16 |
|
$ |
(34.10 |
) |
||
(1) The dollar amounts reported in columns (c), (e), (g), and (i) represent the amount of compensation actually paid to our CEOs and the average of the compensation actually paid to our Non-CEO NEOs. The dollar amounts reported as compensation actually paid do not reflect the actual amount of compensation earned by or paid to our CEO or our Non-CEO NEOs during the applicable years, as explained in the ensuing tables. Our CEO included for purposes of calculating the amounts in each applicable year are as follows: (i) for fiscal 2025, Jeffrey Royal and Michael Rost, (ii) for fiscal 2024, Michael Rost, and (iii) for fiscal 2023, Michael Rost and Douglas W. Marohn. During fiscal 2025, the Non-CEO NEOs were Charles Krebs, Mark Radabaugh, and Irina Nashtatik (through July 12, 2024). The only Non-CEO NEO for fiscal 2024 and fiscal 2023 was Irina Nashtatik.
(2) Total Shareholder Return, or TSR, reflects the cumulative return of a $100 investment from the beginning of fiscal 2023 through the end of each of the fiscal years in the table, calculated in accordance with Item 201(e) of Regulation S-K.
(3) The dollar amounts reported represent the amount of net income (loss) reflected in our audited consolidated financial statements for the applicable year.
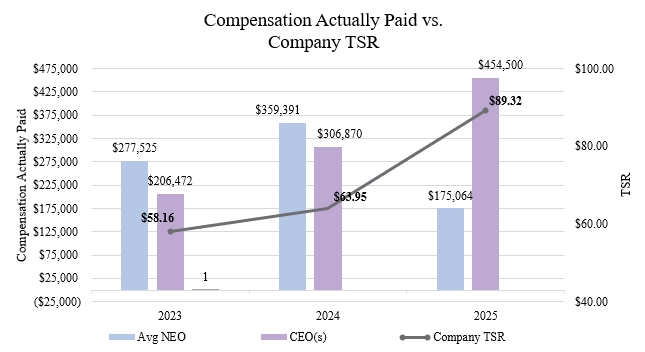
Compensation Actually Paid vs. Cumulative TSR of the Company
The following graph compares the relationship between the amount of compensation actually paid to our CEOs and the average compensation actually paid to our Non-CEO NEOs with the Company’s cumulative TSR over the three years presented in the table.
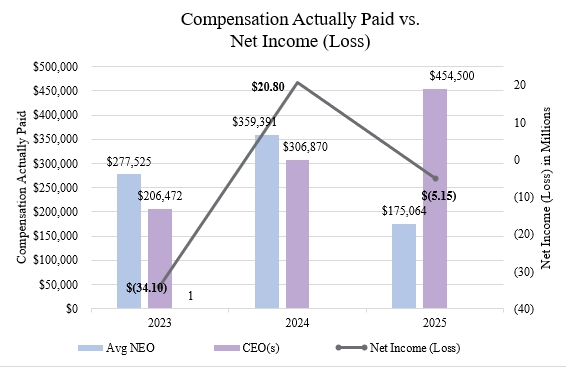
Compensation Actually Paid vs. Net Income (Loss)
The following graph compares the relationship between the amount of compensation actually paid to our CEOs and the average compensation paid to our Non-CEO NEOs with our net income (loss) over the three years presented in the table.