Pay vs Performance Disclosure - USD ($)
Mar. 31, 2025
Mar. 31, 2024
Mar. 31, 2023
Mar. 31, 2022
Mar. 31, 2021
Pay Versus Performance
This section summarizes the relationship between the total compensation paid for the Company’s Chief Executive Officer and the other Named Executive Officers and the Company’s financial performance for the fiscal years shown in the table (in this discussion, the Company’s Chief Executive Officer is also referred to as the principal executive officer or “PEO”, and the Named Executive Officers other than the Company’s Chief Executive Officer are referred to as the
“Non-PEO
NEOs”). Value of Initial Fixed $100 Investment Based On: |
||||||||||||||||||||||||||||||||||||
Fiscal Year |
Summary Compensation Table Total for PEO ($) (1)(2) |
Compensation Actually Paid to PEO ($) (3) |
Average Summary Compensation Table Total for Non-PEO NEOs ($) (1)(2) |
Average Compensation Actually Paid to Non-PEO NEOs ($) (3) |
Lionsgate TSR ($) (4) |
Dow Jones U.S. Media Sector TSR ($) (4) |
S&P Movies & Entertainment Index TSR ($) (4) |
Lionsgate Net Income (Loss) ($Millions) (5) |
Lionsgate Adjusted OIBDA ($Millions) (6) |
|||||||||||||||||||||||||||
(a) |
(b) |
(c) |
(d) |
(e) |
(f) |
(g) |
(h) |
(i) |
||||||||||||||||||||||||||||
| 2025 | $ | 9,823,232 | $ | 9,324,606 | $ | 5,682,552 | $ | 5,517,726 | $ | 146 | $ | 109 | $ | 161 | $ | (362.0 | ) | $ | 448.1 | |||||||||||||||||
| 2024 | $ | 18,213,948 | $ | 13,002,216 | $ | 6,624,357 | $ | 6,218,137 | $ | 164 | $ | 118 | $ | 133 | $ | (1,102.9 | ) | $ | 517.6 |
|||||||||||||||||
| 2023 | $ | 21,528,409 | $ | 13,153,336 | $ | 6,429,940 | $ | 4,169,033 | $ | 182 | $ | 108 | $ | 96 | $ | (2,010.2 | ) | $ | 358.1 | |||||||||||||||||
| 2022 | $ | 5,585,412 | $ | 10,753,069 | $ | 4,649,415 | $ | 6,185,148 | $ | 267 | $ | 144 | $ | 124 | $ | (188.2 | ) | $ | 402.2 | |||||||||||||||||
| 2021 | $ | 19,176,875 | $ | 30,384,695 | $ | 5,694,133 | $ | 10,065,318 | $ | 246 | $ | 176 | $ | 166 | $ | (18.9 | ) | $ | 540.9 | |||||||||||||||||
| (1) | Mr. Feltheimer was the Company’s Chief Executive Officer for each of the five fiscal years included in the table above. For fiscal years 2021 and 2022, the Company’s Non-PEO NEOs were Messrs. Burns, Barge, Goldsmith and Corii Berg, the Company’s former General Counsel. For fiscal year 2023, the Company’s Non-PEO NEOs were Messrs. Burns, Barge, Goldsmith, Tobey and Berg. For fiscal years 2024 and 2025, the Company’s Non-PEO NEOs were Messrs. Burns, Barge, Goldsmith, and Tobey. |
| (2) | See the Summary Compensation Table Non-PEO NEOs for each of the earlier fiscal years was calculated from the Summary Compensation Table |
| (3) | For purposes of this table, the compensation actually paid (also referred to as “CAP”) to each of Lionsgate’s NEOs (including, for purposes of this table, former Named Executive Officers as noted above) is equal to the NEO’s total compensation reported in the Summary Compensation Table for the applicable fiscal year and adjusted for the following with respect to that NEO: |
| • | Less the amounts reported in the “Stock Awards” and “Option Awards” columns of the Summary Compensation Table |
| • | Plus the fiscal year-end value of Company option and stock awards granted in the covered fiscal year which were outstanding and unvested at the end of the covered fiscal year, |
| • | Plus/(less) the change in value as of the end of the covered fiscal year as compared to the value at the end of the prior fiscal year for Company option and stock awards which were granted in prior fiscal years and were outstanding and unvested at the end of the covered fiscal year, |
| • | Plus the vesting date value of Company option and stock awards which were granted and vested during the same covered fiscal year, |
| • | Plus/(less) the change in value as of the vesting date as compared to the value at the end of the prior fiscal year for Company option and stock awards which were granted in prior fiscal years and vested in the covered fiscal year, |
| • | Less, as to any Company option and stock awards which were granted in prior fiscal years and were forfeited during the covered fiscal year, the value of such awards as of the end of the prior fiscal year, |
| • | Plus the dollar value of any dividends or other earnings paid during the covered fiscal year on outstanding and unvested Company stock awards not otherwise included, |
| • | Plus, as to a Company option or stock award that was materially modified during the covered fiscal year, the amount by which the value of the award as of the date of the modification exceeds the value of the original award on the modification date. |
In making each of these adjustments, the “value” of an option or stock award is the fair value of the award on the applicable date determined in accordance with FASB ASC Topic 718 using the valuation assumptions the Company then used to calculate the fair value of its equity awards. For more information on the valuation of the Company’s equity awards, please see the notes to the Company’s financial statements that appear in its Annual Report on Form that appears in the Company’s annual proxy statement.
10-K
for each fiscal year and the footnotes to the Summary Compensation Table
The table above reflects the CAP (determined as noted above) for the Company’s Chief Executive Officer and, for the Company’s
Non-PEO
NEOs, the average of the CAPs determined for the Non-PEO
NEOs for each of the fiscal years shown in the table. The following table provides a reconciliation of the to for the PEO.
Summary
Compensation
Table
Total
Compensation
Actually Paid
Reconciliation of Summary Compensation Table Total to Compensation Actually Paid for PEO |
Fiscal Year 2025 ($) |
Fiscal Year 2024 ($) |
Fiscal Year 2023 ($) |
Fiscal Year 2022 ($) |
Fiscal Year 2021 ($) |
|||||||||||||||
Summary Compensation Table Total |
9,823,232 |
18,213,948 |
21,528,409 |
5,585,412 |
19,176,875 |
|||||||||||||||
Grant Date Fair Value of Option and Stock Awards Granted in Fiscal Year |
(6,727,032 | ) | (5,427,902 | ) | (9,750,004 | ) | (1,000,003 | ) | (7,446,931 | ) | ||||||||||
Fair Value at Fiscal Year-End of Outstanding and Unvested Option and Stock Awards Granted in Fiscal Year |
4,239,291 | 5,986,201 | 10,815,950 | — | 15,610,964 | |||||||||||||||
Change in Fair Value of Outstanding and Unvested Option and Stock Awards Granted in Prior Fiscal Years |
(690,122 | ) | (207,176 | ) | (8,868,143 | ) | 3,994,288 | 2,420,353 | ||||||||||||
Fair Value at Vesting of Option and Stock Awards Granted in Fiscal Year That Vested During Fiscal Year |
2,431,535 | — | — | 1,000,003 | — | |||||||||||||||
Change in Fair Value as of Vesting Date of Option and Stock Awards Granted in Prior Fiscal Years For Which Applicable Vesting Conditions Were Satisfied During Fiscal Year |
247,702 | (5,562,855 | ) | (572,876 | ) | 1,173,369 | 623,434 | |||||||||||||
Fair Value as of Prior Fiscal Year-End of Option and Stock Awards Granted in Prior Fiscal Years That Failed to Meet Applicable Vesting Conditions During Fiscal Year |
— | — | — | — | — | |||||||||||||||
Compensation Actually Paid |
$ |
9,324,606 |
$ |
13,002,216 |
$ |
13,153,336 |
$ |
10,753,069 |
$ |
30,384,695 |
||||||||||
The following table provides a reconciliation of the average of the for a fiscal year to the average of the for that fiscal year.
Summary Compensation Table Total for the
Non-PEO
NEOsCompensation Actually Paid for the
Non-PEO
NEOsReconciliation of Average Summary Compensation Table Total to Average Compensation Actually Paid for Non-PEO NEOs |
Fiscal Year 2025 ($) |
Fiscal Year 2024 ($) |
Fiscal Year 2023 ($) |
Fiscal Year 2022 ($) |
Fiscal Year 2021 ($) |
|||||||||||||||
Summary Compensation Table Total |
5,682,552 |
6,624,357 |
6,429,940 |
4,649,415 |
5,694,133 |
|||||||||||||||
Grant Date Fair Value of Option and Stock Awards Granted in Fiscal Year |
(2,396,974 | ) | (2,328,686 | ) | (3,272,202 | ) | (2,759,912 | ) | (2,366,952 | ) | ||||||||||
Fair Value at Fiscal Year-End of Outstanding and Unvested Option and Stock Awards Granted in Fiscal Year |
1,542,044 | 1,720,364 | 2,430,521 | 1,022,759 | 4,803,958 | |||||||||||||||
Change in Fair Value of Outstanding and Unvested Option and Stock Awards Granted in Prior Fiscal Years |
(199,971 | ) | (98,353 | ) | (761,350 | ) | 1,155,466 | 1,236,985 | ||||||||||||
Fair Value at Vesting of Option and Stock Awards Granted in Fiscal Year That Vested During Fiscal Year |
832,904 | 672,750 | 948,244 | 1,392,662 | 158,084 | |||||||||||||||
Change in Fair Value as of Vesting Date of Option and Stock Awards Granted in Prior Fiscal Years For Which Applicable Vesting Conditions Were Satisfied During Fiscal Year |
57,171 | (372,295 | ) | (1,571,828 | ) | 724,758 | 539,110 | |||||||||||||
Fair Value as of Prior Fiscal Year-End of Option and Stock Awards Granted in Prior Fiscal Years That Failed to Meet Applicable Vesting Conditions During Fiscal Year |
— | — | (34,292 | ) | — | — | ||||||||||||||
Compensation Actually Paid |
$ |
5,517,726 |
$ |
6,218,137 |
$ |
4,169,033 |
$ |
6,185,148 |
$ |
10,065,318 |
||||||||||
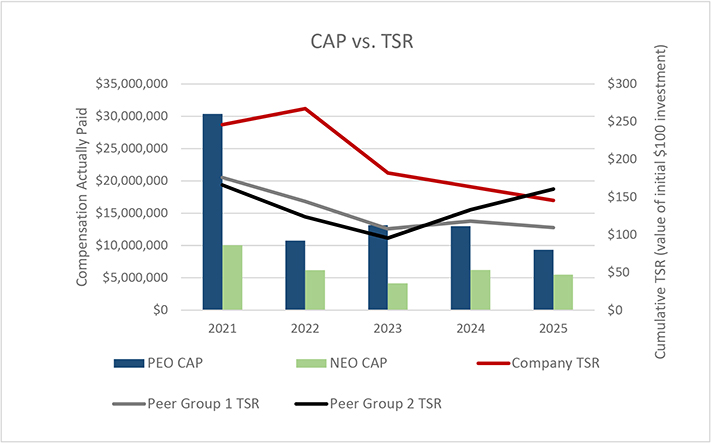
| (4) | The Company’s TSR represents cumulative total shareholder return on a fixed investment of $100 in existing common stock for the period beginning on the last trading day of fiscal year 2020 through the end of the applicable fiscal year, and is calculated assuming the reinvestment of dividends. The Dow Jones U.S. Media Sector Index TSR and the S&P Movies & Entertainment Index (which the Company also utilizes in the stock performance graph required by Item 201(e) of Regulation S-K included in its Annual Reports for each covered fiscal year) represent cumulative total shareholder return on a fixed investment of $100 in the Dow Jones U.S. Media Sector Index and the S&P Movies & Entertainment Index, respectively, for the period beginning on the last trading day of fiscal year 2020 through the end of the applicable fiscal year, and are calculated assuming the reinvestment of dividends. The following chart illustrates the CAP for the Company’s Chief Executive Officer and the average CAP for the Company’s Non-PEO NEOs for each of the last five fiscal years against the Company’s total shareholder return and the total shareholder return for each of the Dow Jones U.S. Media Sector and the S&P Movies & Entertainment Index (each calculated as described above) over that period of time. |
Non-PEO
NEOs were Messrs. Burns, Barge, Goldsmith and Corii Berg, the Company’s former General Counsel. For fiscal year 2023, the Company’s Non-PEO
NEOs were Messrs. Burns, Barge, Goldsmith, Tobey and Berg. For fiscal years 2024 and 2025, the Company’s Non-PEO
NEOs were Messrs. Burns, Barge, Goldsmith, and Tobey.
The following table provides a reconciliation of the to for the PEO.
Summary
Compensation
Table
Total
Compensation
Actually Paid
Reconciliation of Summary Compensation Table Total to Compensation Actually Paid for PEO |
Fiscal Year 2025 ($) |
Fiscal Year 2024 ($) |
Fiscal Year 2023 ($) |
Fiscal Year 2022 ($) |
Fiscal Year 2021 ($) |
|||||||||||||||
Summary Compensation Table Total |
9,823,232 |
18,213,948 |
21,528,409 |
5,585,412 |
19,176,875 |
|||||||||||||||
Grant Date Fair Value of Option and Stock Awards Granted in Fiscal Year |
(6,727,032 | ) | (5,427,902 | ) | (9,750,004 | ) | (1,000,003 | ) | (7,446,931 | ) | ||||||||||
Fair Value at Fiscal Year-End of Outstanding and Unvested Option and Stock Awards Granted in Fiscal Year |
4,239,291 | 5,986,201 | 10,815,950 | — | 15,610,964 | |||||||||||||||
Change in Fair Value of Outstanding and Unvested Option and Stock Awards Granted in Prior Fiscal Years |
(690,122 | ) | (207,176 | ) | (8,868,143 | ) | 3,994,288 | 2,420,353 | ||||||||||||
Fair Value at Vesting of Option and Stock Awards Granted in Fiscal Year That Vested During Fiscal Year |
2,431,535 | — | — | 1,000,003 | — | |||||||||||||||
Change in Fair Value as of Vesting Date of Option and Stock Awards Granted in Prior Fiscal Years For Which Applicable Vesting Conditions Were Satisfied During Fiscal Year |
247,702 | (5,562,855 | ) | (572,876 | ) | 1,173,369 | 623,434 | |||||||||||||
Fair Value as of Prior Fiscal Year-End of Option and Stock Awards Granted in Prior Fiscal Years That Failed to Meet Applicable Vesting Conditions During Fiscal Year |
— | — | — | — | — | |||||||||||||||
Compensation Actually Paid |
$ |
9,324,606 |
$ |
13,002,216 |
$ |
13,153,336 |
$ |
10,753,069 |
$ |
30,384,695 |
||||||||||
The following table provides a reconciliation of the average of the for a fiscal year to the average of the for that fiscal year.
Summary Compensation Table Total for the
Non-PEO
NEOsCompensation Actually Paid for the
Non-PEO
NEOsReconciliation of Average Summary Compensation Table Total to Average Compensation Actually Paid for Non-PEO NEOs |
Fiscal Year 2025 ($) |
Fiscal Year 2024 ($) |
Fiscal Year 2023 ($) |
Fiscal Year 2022 ($) |
Fiscal Year 2021 ($) |
|||||||||||||||
Summary Compensation Table Total |
5,682,552 |
6,624,357 |
6,429,940 |
4,649,415 |
5,694,133 |
|||||||||||||||
Grant Date Fair Value of Option and Stock Awards Granted in Fiscal Year |
(2,396,974 | ) | (2,328,686 | ) | (3,272,202 | ) | (2,759,912 | ) | (2,366,952 | ) | ||||||||||
Fair Value at Fiscal Year-End of Outstanding and Unvested Option and Stock Awards Granted in Fiscal Year |
1,542,044 | 1,720,364 | 2,430,521 | 1,022,759 | 4,803,958 | |||||||||||||||
Change in Fair Value of Outstanding and Unvested Option and Stock Awards Granted in Prior Fiscal Years |
(199,971 | ) | (98,353 | ) | (761,350 | ) | 1,155,466 | 1,236,985 | ||||||||||||
Fair Value at Vesting of Option and Stock Awards Granted in Fiscal Year That Vested During Fiscal Year |
832,904 | 672,750 | 948,244 | 1,392,662 | 158,084 | |||||||||||||||
Change in Fair Value as of Vesting Date of Option and Stock Awards Granted in Prior Fiscal Years For Which Applicable Vesting Conditions Were Satisfied During Fiscal Year |
57,171 | (372,295 | ) | (1,571,828 | ) | 724,758 | 539,110 | |||||||||||||
Fair Value as of Prior Fiscal Year-End of Option and Stock Awards Granted in Prior Fiscal Years That Failed to Meet Applicable Vesting Conditions During Fiscal Year |
— | — | (34,292 | ) | — | — | ||||||||||||||
Compensation Actually Paid |
$ |
5,517,726 |
$ |
6,218,137 |
$ |
4,169,033 |
$ |
6,185,148 |
$ |
10,065,318 |
||||||||||
Following is an unranked list of the Company’s financial performance measures it considers most important in linking the compensation actually paid to the Company’s NEOs for fiscal 2025 with the Company’s performance.
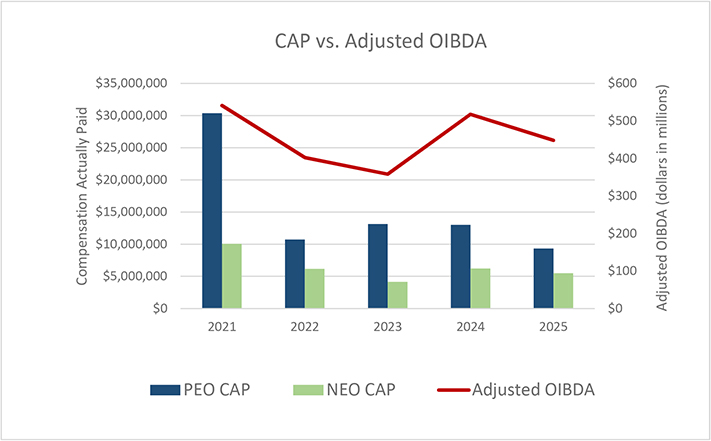
| • | Adjusted OIBDA (used in determining corporate performance for purposes of the annual incentive plan); and |
| • | Certain Discretionary Assessment of Achievement of Operational and Strategic Goals (used in determining individual performance for purposes of the annual incentive plan and the vesting of performance-based equity awards). |