| NASDAQ: SMBC July 29, 2025 |

| 67 locations serving 52 COMMUNITIES in 4 States St. Louis Kansas City Springfield Poplar Bluff Cape Girardeau Jonesboro |
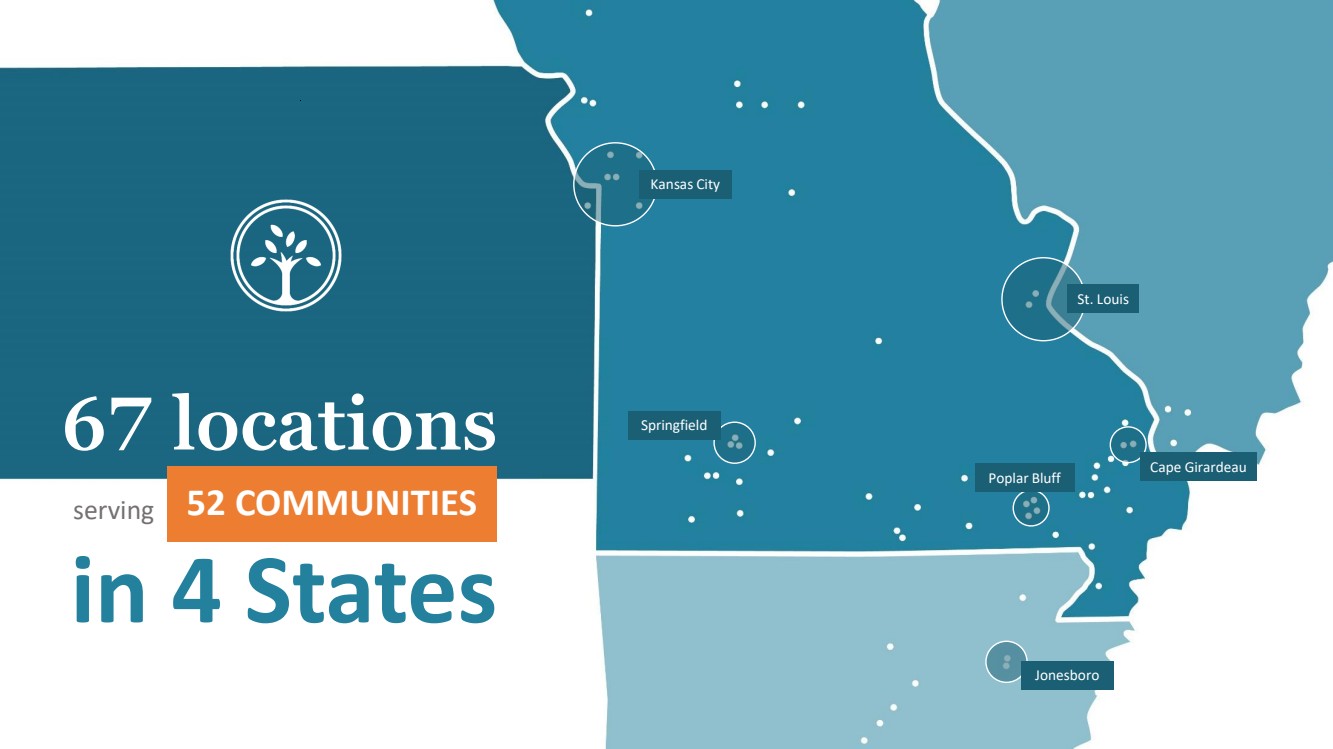
| Why Southern Bank? We see people working to seize opportunities, build communities, and achieve their dreams right in their hometowns. And we want to keep it that way. That's why we provide services, resources, and tools that help you accomplish what you want, where you want. Southern Missouri Bancorp, Inc, (“Company”) is a bank holding company and the parent company of Southern Bank (“Bank”). |

| Arnold/Oakville team members participated in and worked the booth at last year’s Keene Insurance Group Golf Tournament Smithville team members participated in Smithville School District’s staff vendor fair. Cape Girardeau team members attended United Way’s ribbon cutting. What sets us apart? OUR COMMUNITIES We’re invested in what our communities are doing and dedicated to provide exactly what they need in their local bank. Our team members are deeply involved in their communities – whether it is serving on boards and committees, volunteering with local schools/organizations, or coaching little league teams. OUR PEOPLE Our team members are what make our organization great. We are respectful, honest, and professional and strive to make every experience a good one – for both our customers and coworkers. We work as a team to help our customers reach their goals, whatever they may be. |

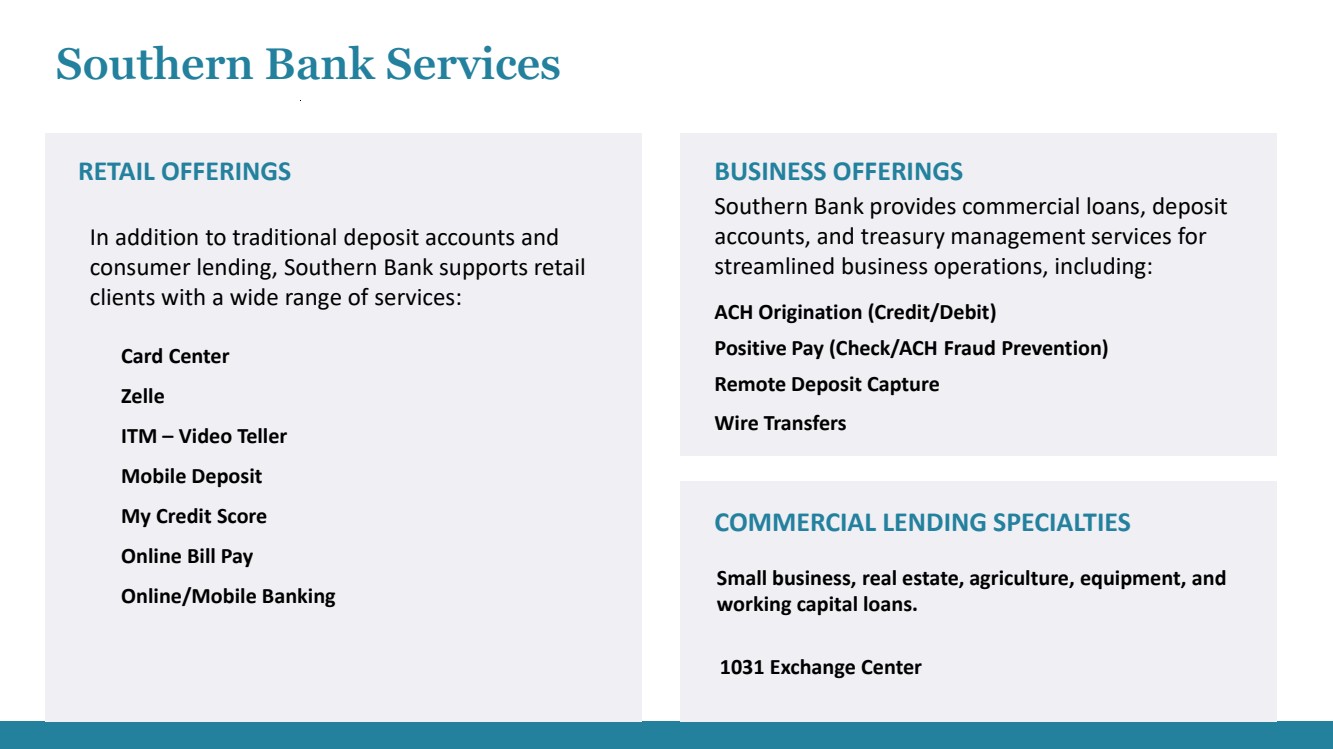
| Southern Bank Services RETAIL OFFERINGS BUSINESS OFFERINGS Southern Bank provides commercial loans, deposit accounts, and treasury management services for streamlined business operations, including: ACH Origination (Credit/Debit) Positive Pay (Check/ACH Fraud Prevention) Remote Deposit Capture Wire Transfers COMMERCIAL LENDING SPECIALTIES Small business, real estate, agriculture, equipment, and working capital loans. In addition to traditional deposit accounts and consumer lending, Southern Bank supports retail clients with a wide range of services: Card Center Zelle ITM – Video Teller Mobile Deposit My Credit Score Online Bill Pay Online/Mobile Banking 1031 Exchange Center |
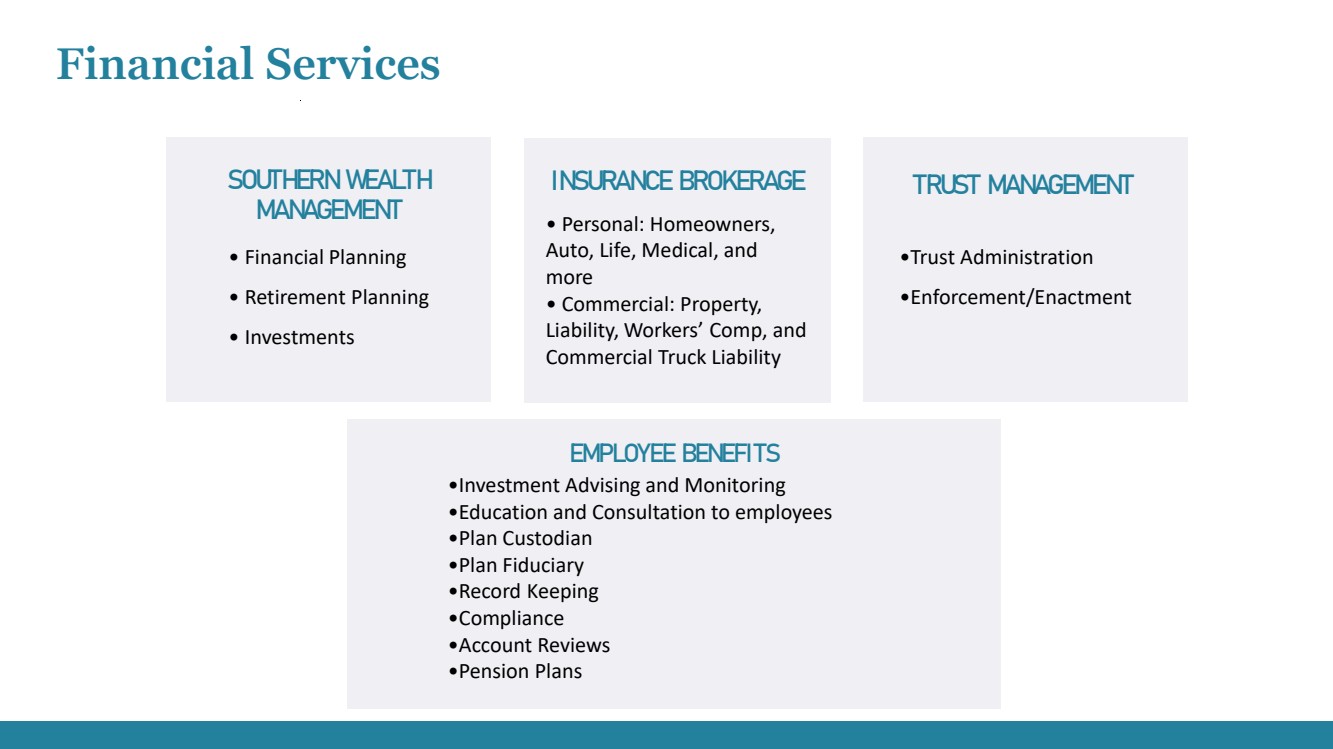
| SOUT HERN WEALT H MANAGEMEN T • Financial Planning • Retirement Planning • Investments INSURANCE BROKERAGE • Personal: Homeowners, Auto, Life, Medical, and more • Commercial: Property, Liability, Workers’ Comp, and Commercial Truck Liability T RUST MANAGEMEN T •Trust Administration •Enforcement/Enactment EMPLOYEE BENEFI TS •Investment Advising and Monitoring •Education and Consultation to employees •Plan Custodian •Plan Fiduciary •Record Keeping •Compliance •Account Reviews •Pension Plans Financial Services |
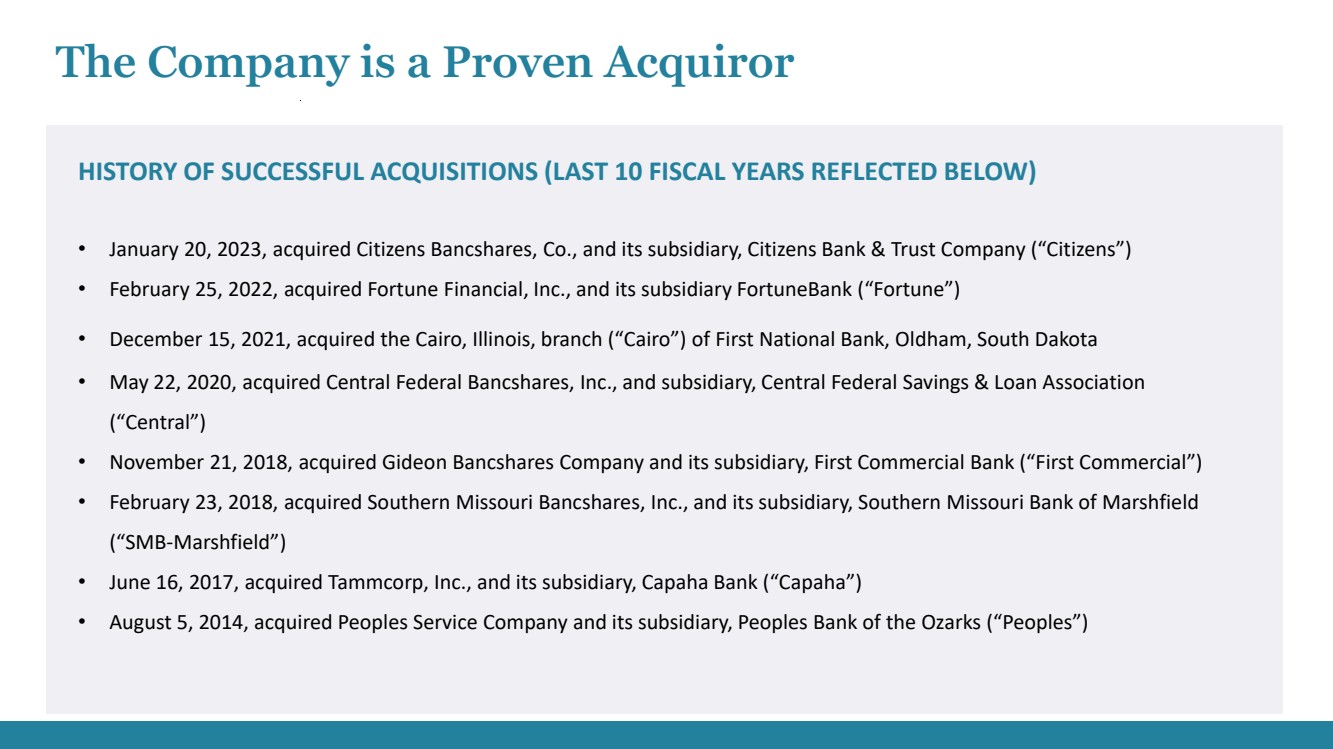
| The Company is a Proven Acquiror HISTORY OF SUCCESSFUL ACQUISITIONS (LAST 10 FISCAL YEARS REFLECTED BELOW) • January 20, 2023, acquired Citizens Bancshares, Co., and its subsidiary, Citizens Bank & Trust Company (“Citizens”) • February 25, 2022, acquired Fortune Financial, Inc., and its subsidiary FortuneBank (“Fortune”) • December 15, 2021, acquired the Cairo, Illinois, branch (“Cairo”) of First National Bank, Oldham, South Dakota • May 22, 2020, acquired Central Federal Bancshares, Inc., and subsidiary, Central Federal Savings & Loan Association (“Central”) • November 21, 2018, acquired Gideon Bancshares Company and its subsidiary, First Commercial Bank (“First Commercial”) • February 23, 2018, acquired Southern Missouri Bancshares, Inc., and its subsidiary, Southern Missouri Bank of Marshfield (“SMB-Marshfield”) • June 16, 2017, acquired Tammcorp, Inc., and its subsidiary, Capaha Bank (“Capaha”) • August 5, 2014, acquired Peoples Service Company and its subsidiary, Peoples Bank of the Ozarks (“Peoples”) |
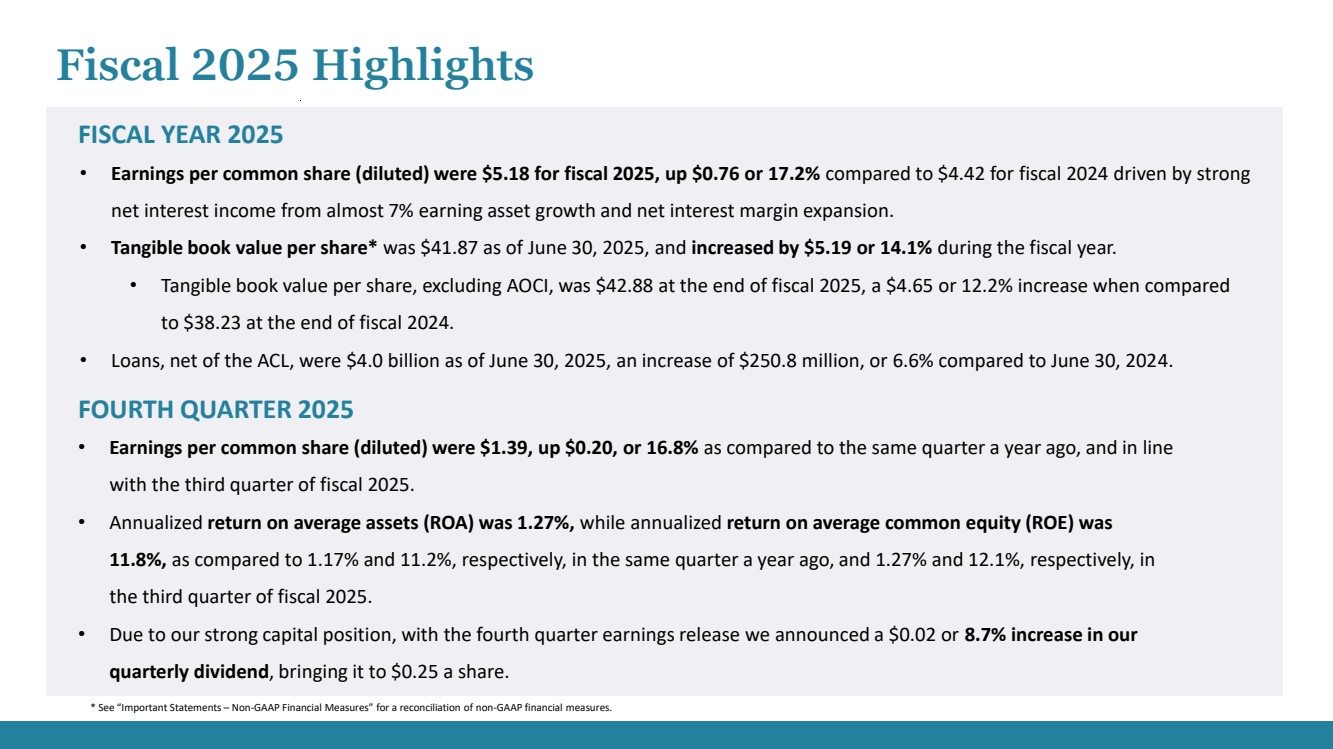
| Fiscal 2025 Highlights • Earnings per common share (diluted) were $5.18 for fiscal 2025, up $0.76 or 17.2% compared to $4.42 for fiscal 2024 driven by strong net interest income from almost 7% earning asset growth and net interest margin expansion. • Tangible book value per share* was $41.87 as of June 30, 2025, and increased by $5.19 or 14.1% during the fiscal year. • Tangible book value per share, excluding AOCI, was $42.88 at the end of fiscal 2025, a $4.65 or 12.2% increase when compared to $38.23 at the end of fiscal 2024. • Loans, net of the ACL, were $4.0 billion as of June 30, 2025, an increase of $250.8 million, or 6.6% compared to June 30, 2024. FISCAL YEAR 2025 * See “Important Statements – Non-GAAP Financial Measures” for a reconciliation of non-GAAP financial measures. FOURTH QUARTER 2025 • Earnings per common share (diluted) were $1.39, up $0.20, or 16.8% as compared to the same quarter a year ago, and in line with the third quarter of fiscal 2025. • Annualized return on average assets (ROA) was 1.27%, while annualized return on average common equity (ROE) was 11.8%, as compared to 1.17% and 11.2%, respectively, in the same quarter a year ago, and 1.27% and 12.1%, respectively, in the third quarter of fiscal 2025. • Due to our strong capital position, with the fourth quarter earnings release we announced a $0.02 or 8.7% increase in our quarterly dividend, bringing it to $0.25 a share. |
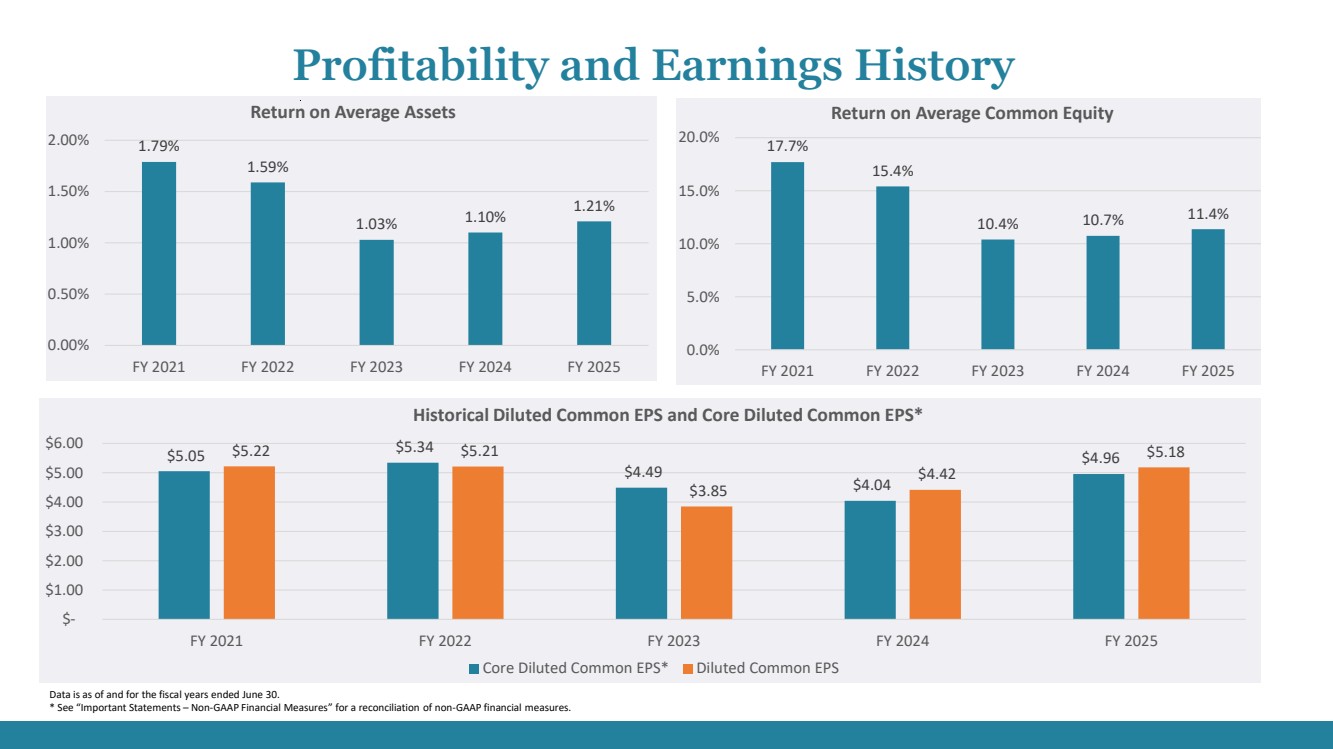
| 1.79% 1.59% 1.03% 1.10% 1.21% 0.00% 0.50% 1.00% 1.50% 2.00% FY 2021 FY 2022 FY 2023 FY 2024 FY 2025 Return on Average Assets 17.7% 15.4% 10.4% 10.7% 11.4% 0.0% 5.0% 10.0% 15.0% 20.0% FY 2021 FY 2022 FY 2023 FY 2024 FY 2025 Return on Average Common Equity $5.05 $5.34 $4.49 $4.04 $4.96 $5.22 $5.21 $3.85 $4.42 $5.18 $- $1.00 $2.00 $3.00 $4.00 $5.00 $6.00 FY 2021 FY 2022 FY 2023 FY 2024 FY 2025 Historical Diluted Common EPS and Core Diluted Common EPS* Core Diluted Common EPS* Diluted Common EPS Data is as of and for the fiscal years ended June 30. * See “Important Statements – Non-GAAP Financial Measures” for a reconciliation of non-GAAP financial measures. . Profitability and Earnings History |
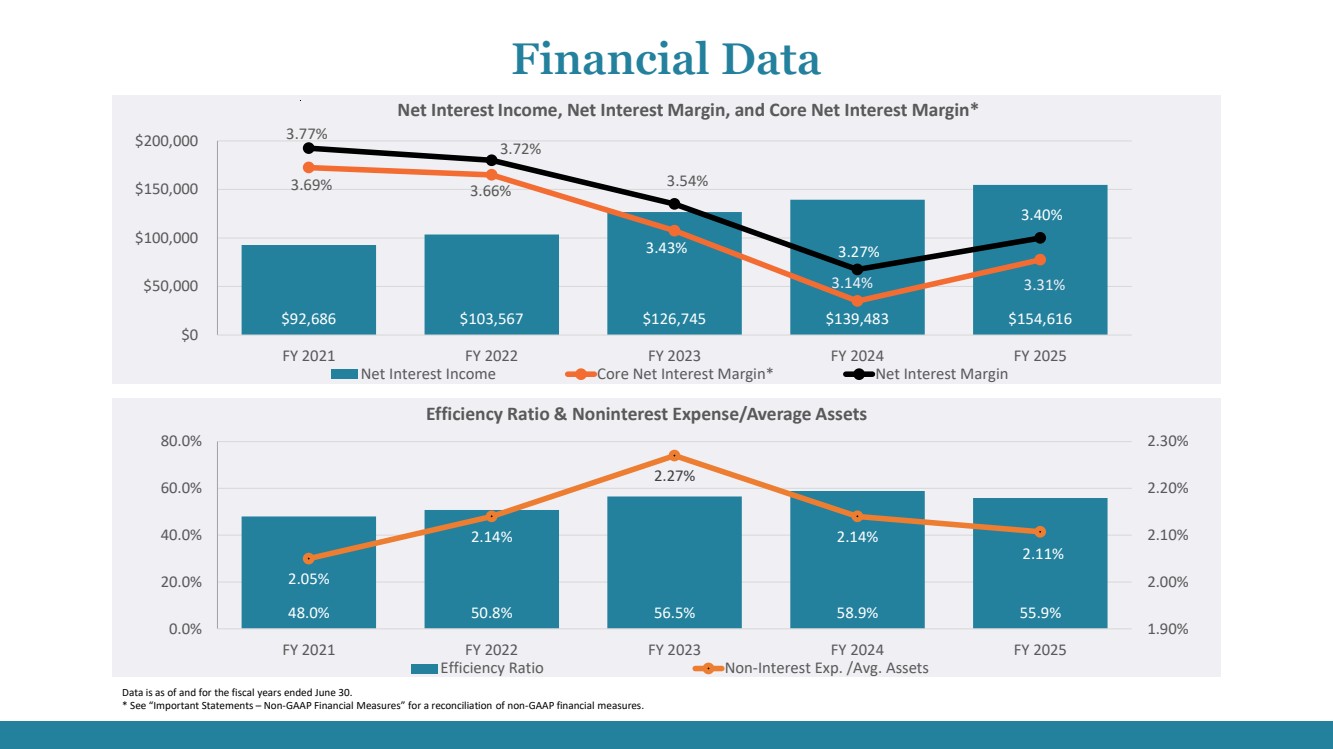
| $92,686 $103,567 $126,745 $139,483 $154,616 3.69% 3.66% 3.43% 3.14% 3.31% 3.77% 3.72% 3.54% 3.27% 3.40% 3.00% 3.20% 3.40% 3.60% 3.80% $0 $50,000 $100,000 $150,000 $200,000 FY 2021 FY 2022 FY 2023 FY 2024 FY 2025 Net Interest Income, Net Interest Margin, and Core Net Interest Margin* Net Interest Income Core Net Interest Margin* Net Interest Margin 48.0% 50.8% 56.5% 58.9% 55.9% 2.05% 2.14% 2.27% 2.14% 2.11% 1.90% 2.00% 2.10% 2.20% 2.30% 0.0% 20.0% 40.0% 60.0% 80.0% FY 2021 FY 2022 FY 2023 FY 2024 FY 2025 Efficiency Ratio & Noninterest Expense/Average Assets Efficiency Ratio Non-Interest Exp. /Avg. Assets Data is as of and for the fiscal years ended June 30. * See “Important Statements – Non-GAAP Financial Measures” for a reconciliation of non-GAAP financial measures. Financial Data |
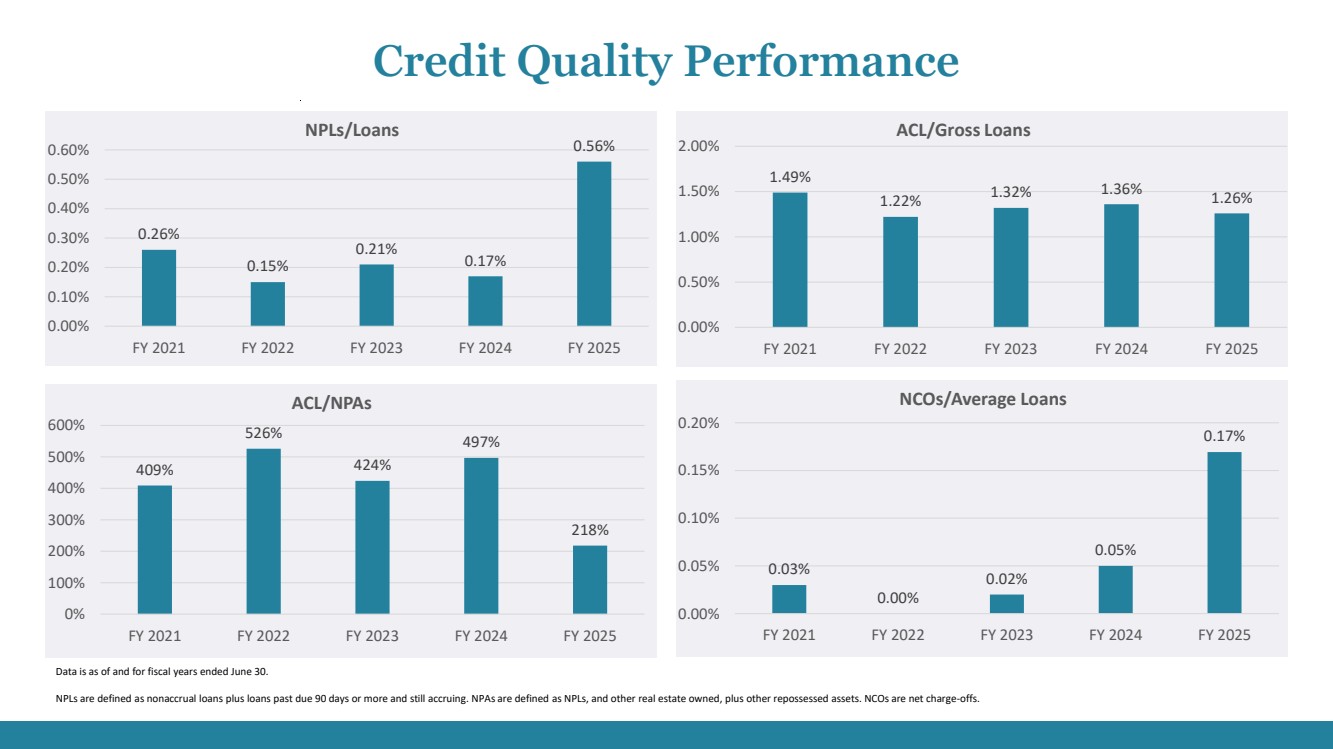
| 0.26% 0.15% 0.21% 0.17% 0.56% 0.00% 0.10% 0.20% 0.30% 0.40% 0.50% 0.60% FY 2021 FY 2022 FY 2023 FY 2024 FY 2025 NPLs/Loans 1.49% 1.22% 1.32% 1.36% 1.26% 0.00% 0.50% 1.00% 1.50% 2.00% FY 2021 FY 2022 FY 2023 FY 2024 FY 2025 ACL/Gross Loans 409% 526% 424% 497% 218% 0% 100% 200% 300% 400% 500% 600% FY 2021 FY 2022 FY 2023 FY 2024 FY 2025 ACL/NPAs 0.03% 0.00% 0.02% 0.05% 0.17% 0.00% 0.05% 0.10% 0.15% 0.20% FY 2021 FY 2022 FY 2023 FY 2024 FY 2025 NCOs/Average Loans Data is as of and for fiscal years ended June 30. NPLs are defined as nonaccrual loans plus loans past due 90 days or more and still accruing. NPAs are defined as NPLs, and other real estate owned, plus other repossessed assets. NCOs are net charge-offs. Credit Quality Performance |
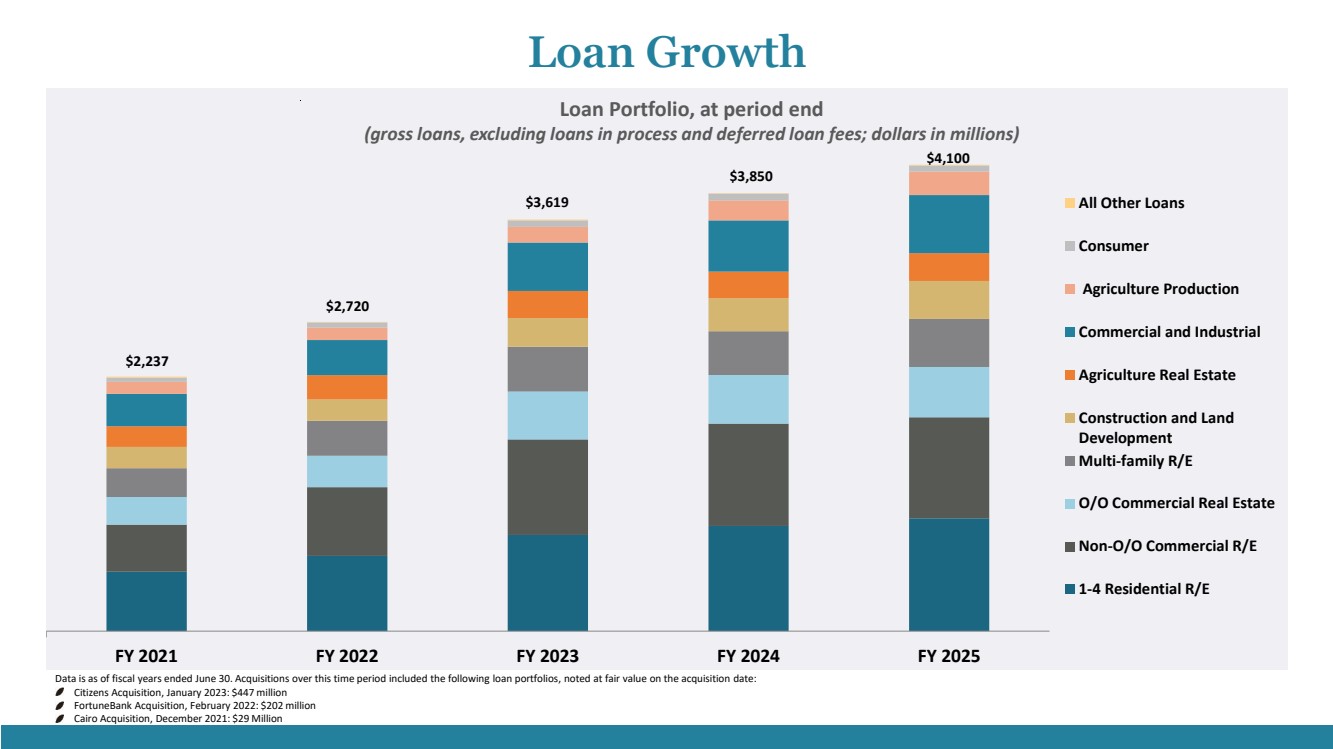
| FY 2021 FY 2022 FY 2023 FY 2024 FY 2025 All Other Loans Consumer Agriculture Production Commercial and Industrial Agriculture Real Estate Construction and Land Development Multi-family R/E O/O Commercial Real Estate Non-O/O Commercial R/E 1-4 Residential R/E $2,237 $4,100 $3,850 $3,619 $2,720 Loan Portfolio, at period end (gross loans, excluding loans in process and deferred loan fees; dollars in millions) Loan Growth Data is as of fiscal years ended June 30. Acquisitions over this time period included the following loan portfolios, noted at fair value on the acquisition date: Citizens Acquisition, January 2023: $447 million FortuneBank Acquisition, February 2022: $202 million Cairo Acquisition, December 2021: $29 Million |
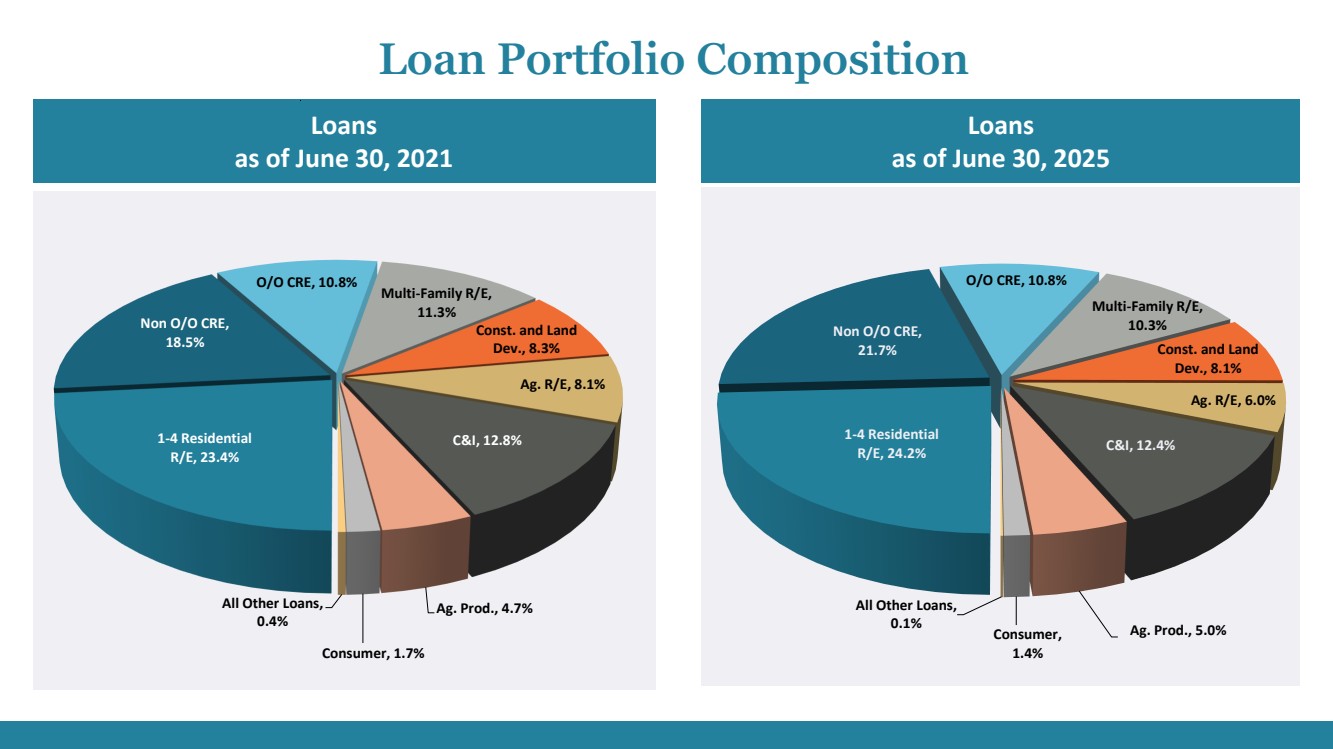
| Loans as of June 30, 2025 Loans as of June 30, 2021 Loan Portfolio Composition 1-4 Residential R/E, 23.4% Non O/O CRE, 18.5% O/O CRE, 10.8% Multi-Family R/E, 11.3% Const. and Land Dev., 8.3% Ag. R/E, 8.1% C&I, 12.8% Ag. Prod., 4.7% Consumer, 1.7% All Other Loans, 0.4% 1-4 Residential R/E, 24.2% Non O/O CRE, 21.7% O/O CRE, 10.8% Multi-Family R/E, 10.3% Const. and Land Dev., 8.1% Ag. R/E, 6.0% C&I, 12.4% Consumer, Ag. Prod., 5.0% 1.4% All Other Loans, 0.1% |
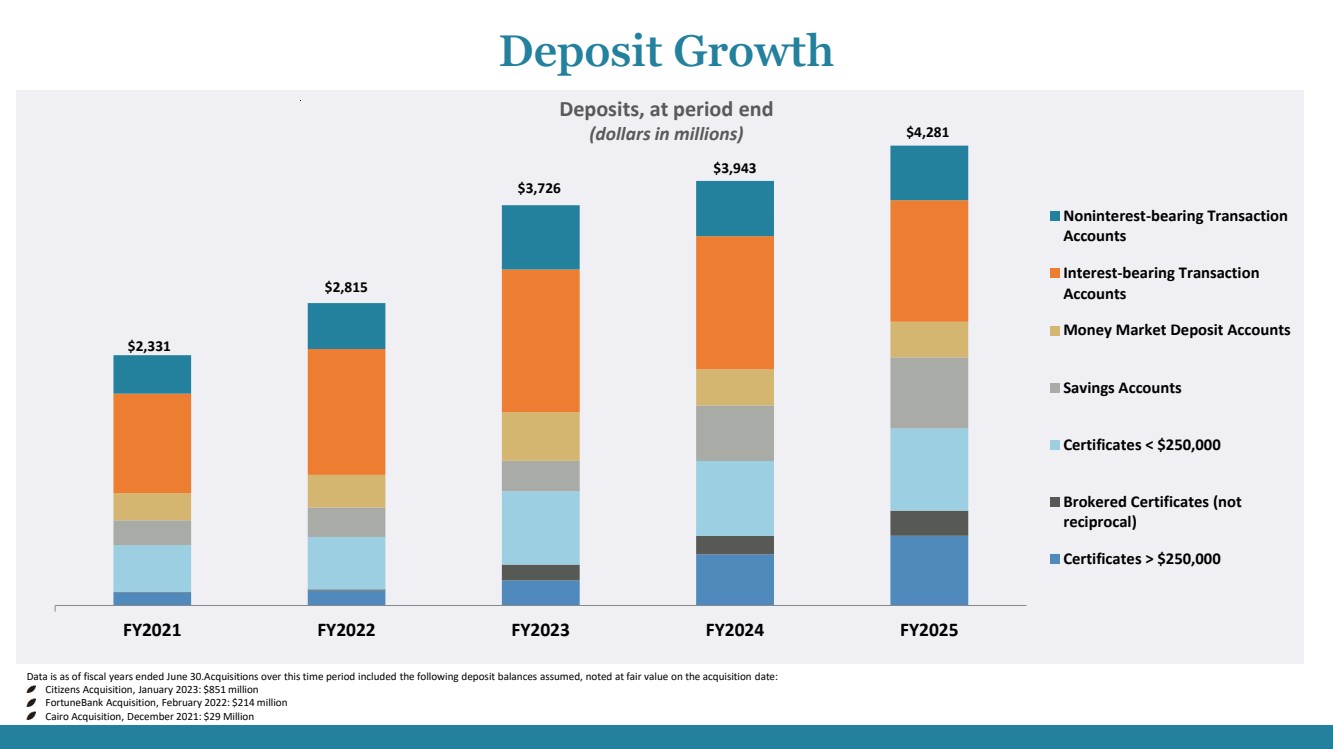
| $2,331 $2,815 $3,726 $3,943 $4,281 FY2021 FY2022 FY2023 FY2024 FY2025 Noninterest-bearing Transaction Accounts Interest-bearing Transaction Accounts Money Market Deposit Accounts Savings Accounts Certificates < $250,000 Brokered Certificates (not reciprocal) Certificates > $250,000 Deposits, at period end (dollars in millions) Deposit Growth Data is as of fiscal years ended June 30.Acquisitions over this time period included the following deposit balances assumed, noted at fair value on the acquisition date: Citizens Acquisition, January 2023: $851 million FortuneBank Acquisition, February 2022: $214 million Cairo Acquisition, December 2021: $29 Million |
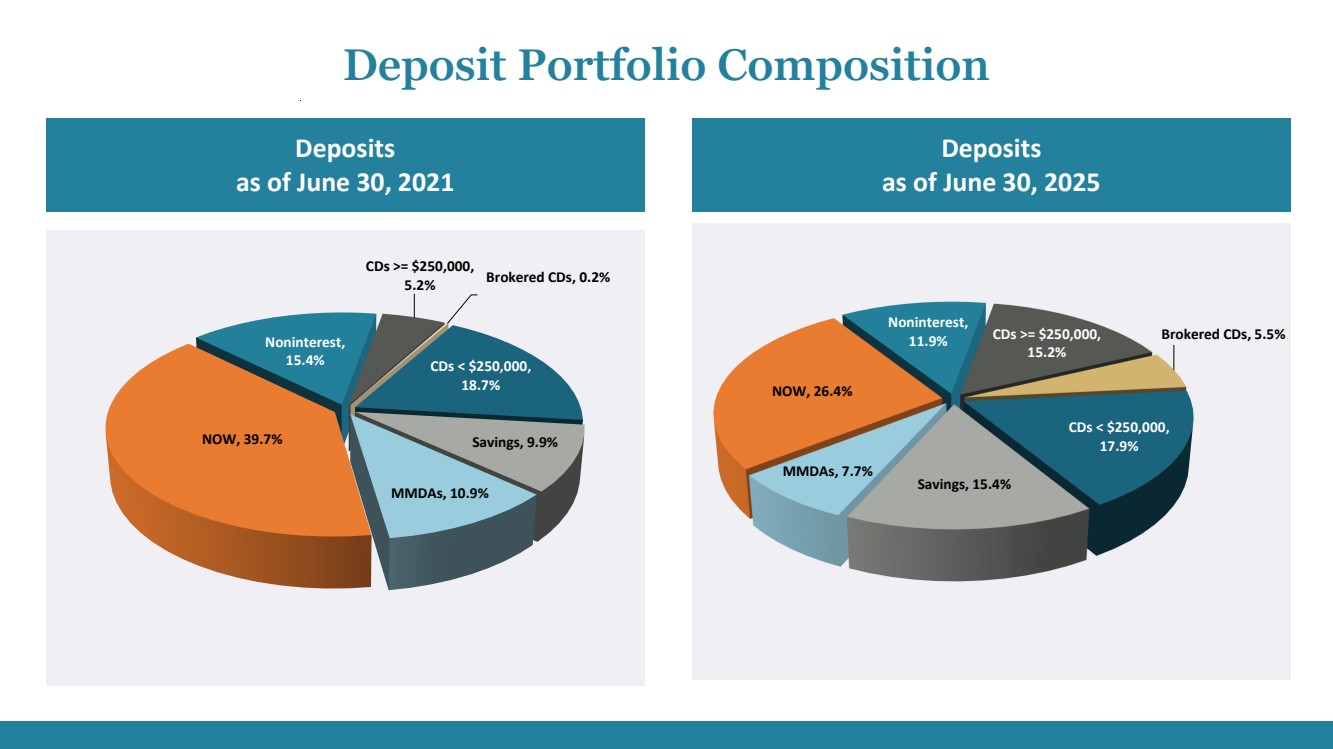
| Deposits as of June 30, 2021 Deposits as of June 30, 2025 Deposit Portfolio Composition CDs >= $250,000, 5.2% Brokered CDs, 0.2% CDs < $250,000, 18.7% Savings, 9.9% MMDAs, 10.9% NOW, 39.7% Noninterest, 15.4% CDs >= $250,000, 15.2% Brokered CDs, 5.5% CDs < $250,000, 17.9% Savings, 15.4% MMDAs, 7.7% NOW, 26.4% Noninterest, 11.9% |
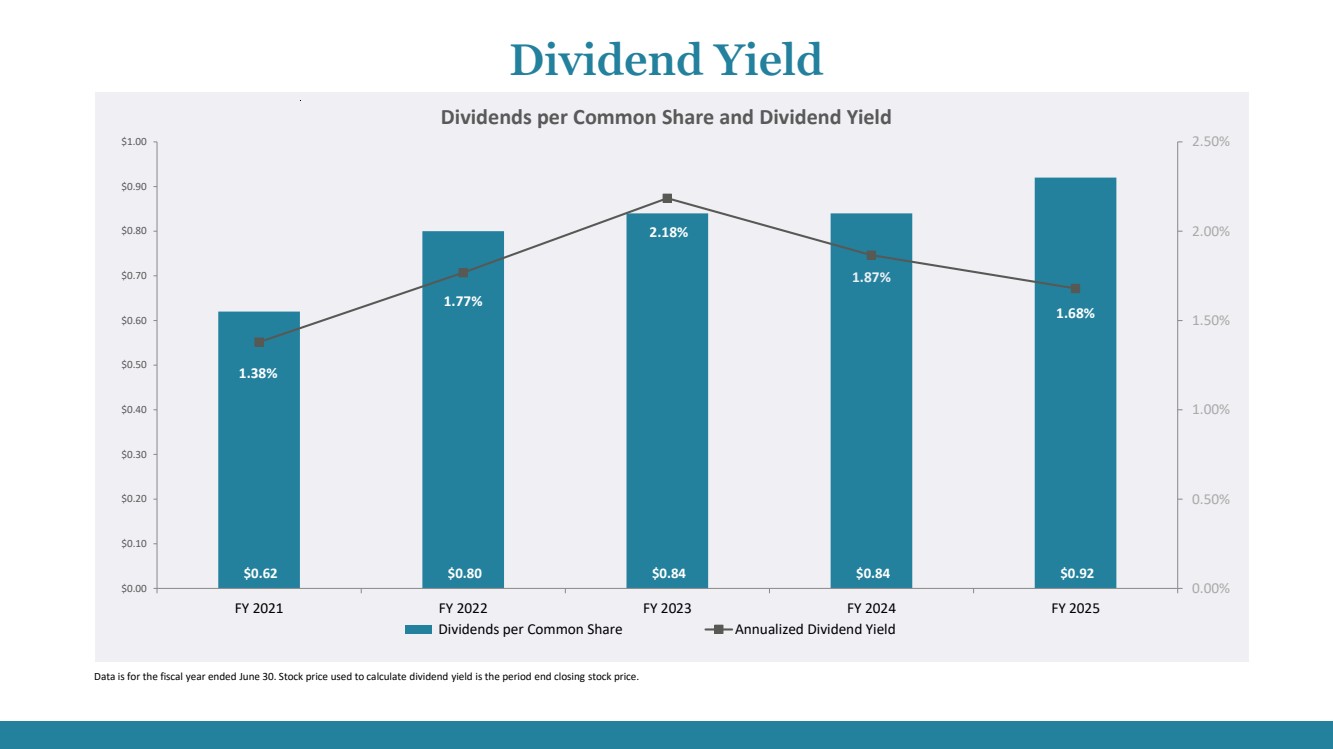
| $0.62 $0.80 $0.84 $0.84 $0.92 1.38% 1.77% 2.18% 1.87% 1.68% 0.00% 0.50% 1.00% 1.50% 2.00% 2.50% $0.00 $0.10 $0.20 $0.30 $0.40 $0.50 $0.60 $0.70 $0.80 $0.90 $1.00 FY 2021 FY 2022 FY 2023 FY 2024 FY 2025 Dividends per Common Share Annualized Dividend Yield Data is for the fiscal year ended June 30. Stock price used to calculate dividend yield is the period end closing stock price. Dividends per Common Share and Dividend Yield Dividend Yield |
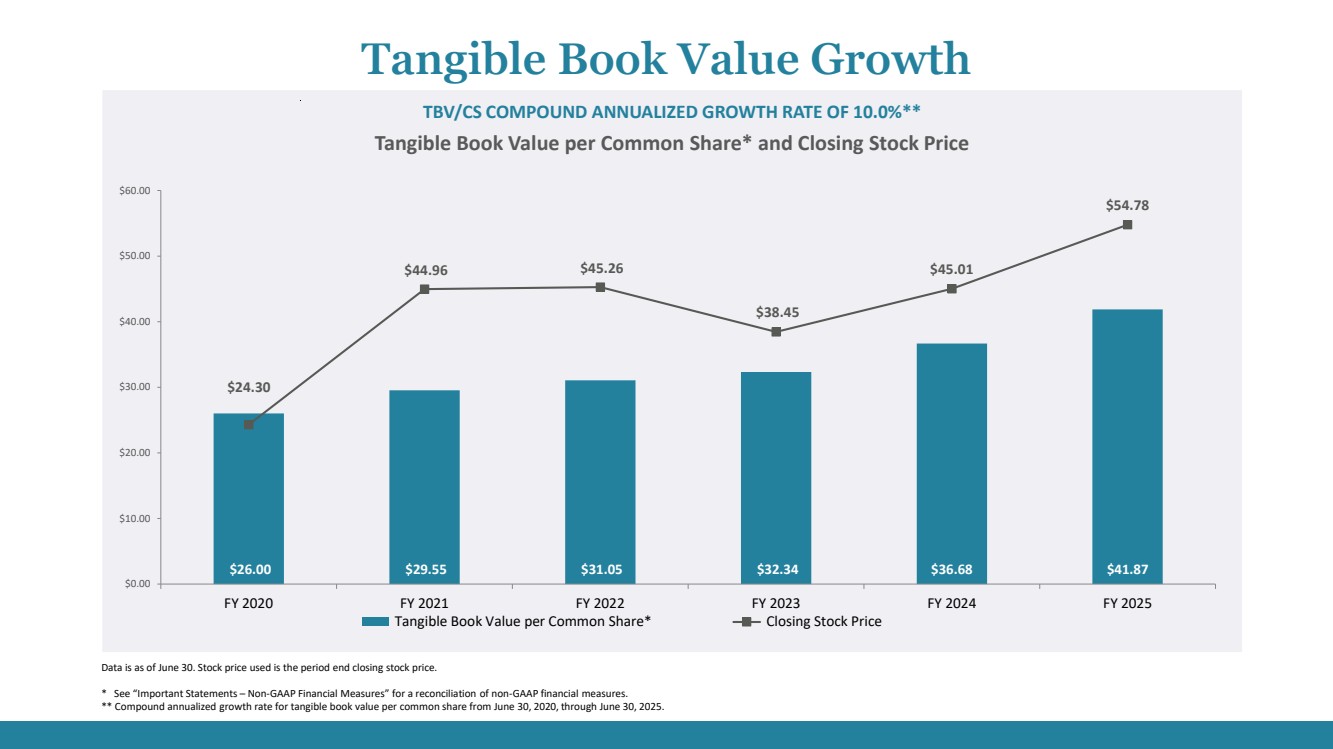
| $26.00 $29.55 $31.05 $32.34 $36.68 $41.87 $24.30 $44.96 $45.26 $38.45 $45.01 $54.78 $0.00 $10.00 $20.00 $30.00 $40.00 $50.00 $60.00 FY 2020 FY 2021 FY 2022 FY 2023 FY 2024 FY 2025 Tangible Book Value per Common Share* Closing Stock Price TBV/CS COMPOUND ANNUALIZED GROWTH RATE OF 10.0%** Data is as of June 30. Stock price used is the period end closing stock price. * See “Important Statements – Non-GAAP Financial Measures” for a reconciliation of non-GAAP financial measures. ** Compound annualized growth rate for tangible book value per common share from June 30, 2020, through June 30, 2025. Tangible Book Value per Common Share* and Closing Stock Price Tangible Book Value Growth |
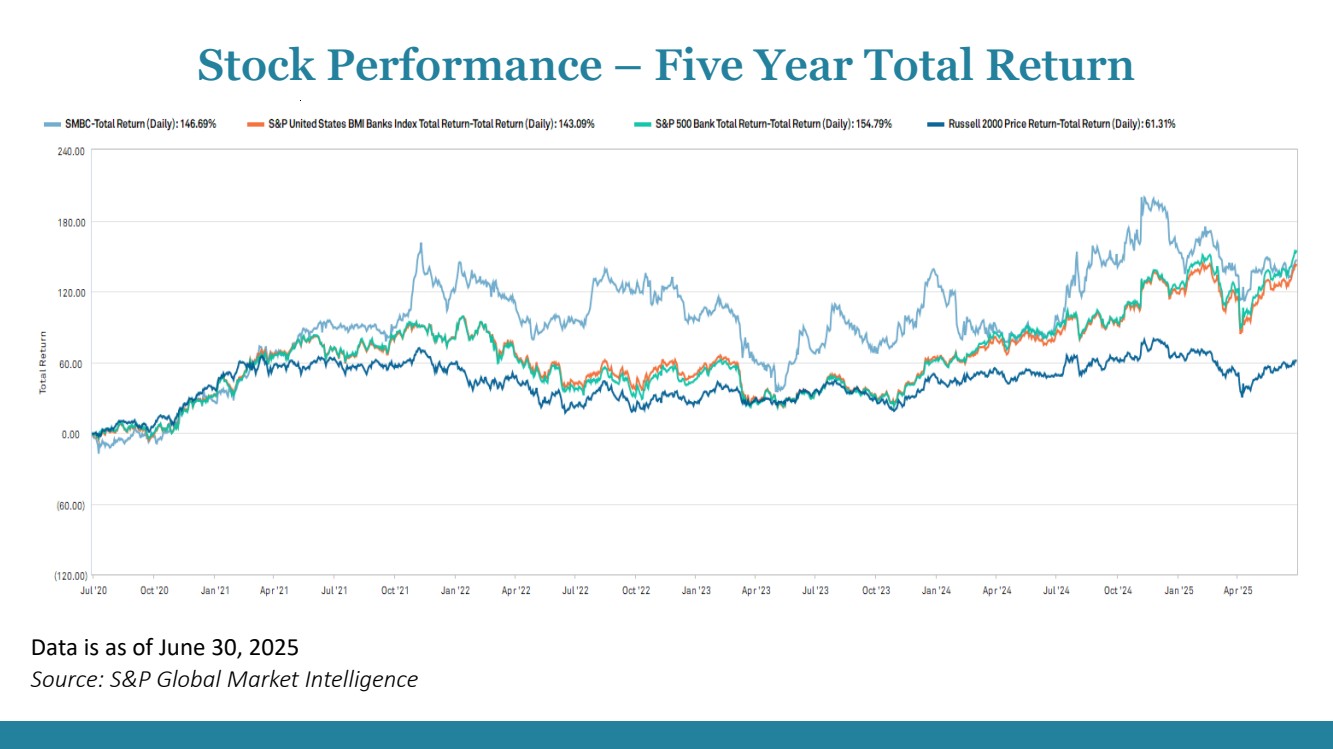
| Data is as of June 30, 2025 Source: S&P Global Market Intelligence Stock Performance – Five Year Total Return |
| Forward Looking Statements This presentation may contain “forward-looking statements” within the meaning of the Private Securities Litigation Reform Act of 1995 regarding Southern Missouri Bancorp, Inc. (the “Company”). These forward-looking statements may include, without limitation, statements with respect to anticipated future operating and financial performance, growth opportunities, interest rates, cost savings and funding advantages expected or anticipated to be realized by management. Words such as “may,” “could,” “should,” “would,” “believe,” “anticipate,” “estimate,” “expect,” “intend,” “plan” and similar expressions are intended to identify these forward-looking statements. Forward-looking statements by the Company and its management are based on beliefs, plans, objectives, goals, expectations, anticipations, estimates and intentions of management and are not guarantees of future performance. The important factors we discuss below, as well as other factors identified in this filing and in our other filings with the SEC and those presented elsewhere by our management from time to time, could cause actual results to differ materially from those indicated by the forward-looking statements made in this document: expected cost savings, synergies and other benefits from our merger and acquisition activities, including our ongoing and recently completed acquisitions, might not be realized within the anticipated time frames, to the extent anticipated, or at all, and costs or difficulties relating to integration matters, including but not limited to customer and employee retention and labor shortages, might be greater than expected and goodwill impairment charges might be incurred; potential adverse impacts to economic conditions in our local market areas, other markets where the Company has lending relationships, or other aspects of the Company’s business operations or financial markets, including, without limitation, as a result of employment levels, labor shortages and the effects of inflation, a potential recession or slowed economic growth; the strength of the United States economy in general and the strength of the local economies in which we conduct operations; fluctuations in interest rates and inflation, including the effects of a potential recession whether caused by Federal Reserve actions or otherwise or slowed economic growth caused by changes in oil prices or supply chain disruptions; impact of monetary and fiscal policies of the Board of Governors of the Federal Reserve System and the U.S. Government and other governmental initiatives affecting the financial services industry; impact of bank failures or adverse developments at other banks and related negative press about the banking industry in general on investor and depositor sentiment; risks of lending and investing activities, including changes in the level and direction of loan delinquencies and write-offs and changes in estimates of the adequacy of the allowance for credit losses on loans; our ability to access cost-effective funding and maintain sufficient liquidity; timely development of and acceptance of our new products and services and the perceived overall value of these products and services by users, including the features, pricing and quality compared to competitors’ products and services; fluctuations in real estate values and both residential and commercial real estate markets, as well as agricultural business conditions; demand for loans and deposits; The impact of a federal government shutdown; legislative or regulatory changes that adversely affect our business; effects of climate change, severe weather events, other natural disasters, war, terrorist activities or civil unrest and their effects on economic and business environments in which the Company operates; changes in accounting principles, policies, or guidelines results of examinations of us by our regulators, including the possibility that our regulators may, among other things, require an increase in our reserve for credit losses on loans or a write-down of assets; the impact of technological changes and an inability to keep pace with the rate of technological advances; cyber threats, such as phishing, ransomware, and insider attacks, can lead to financial loss, reputational damage, and regulatory penalties if sensitive customer data and critical infrastructure are not adequately protected; and our success at managing the risks involved in the foregoing. The Company disclaims any obligation to update or revise any forward-looking statements based on the occurrence of future events, the receipt of new information, or otherwise. Important Statements |
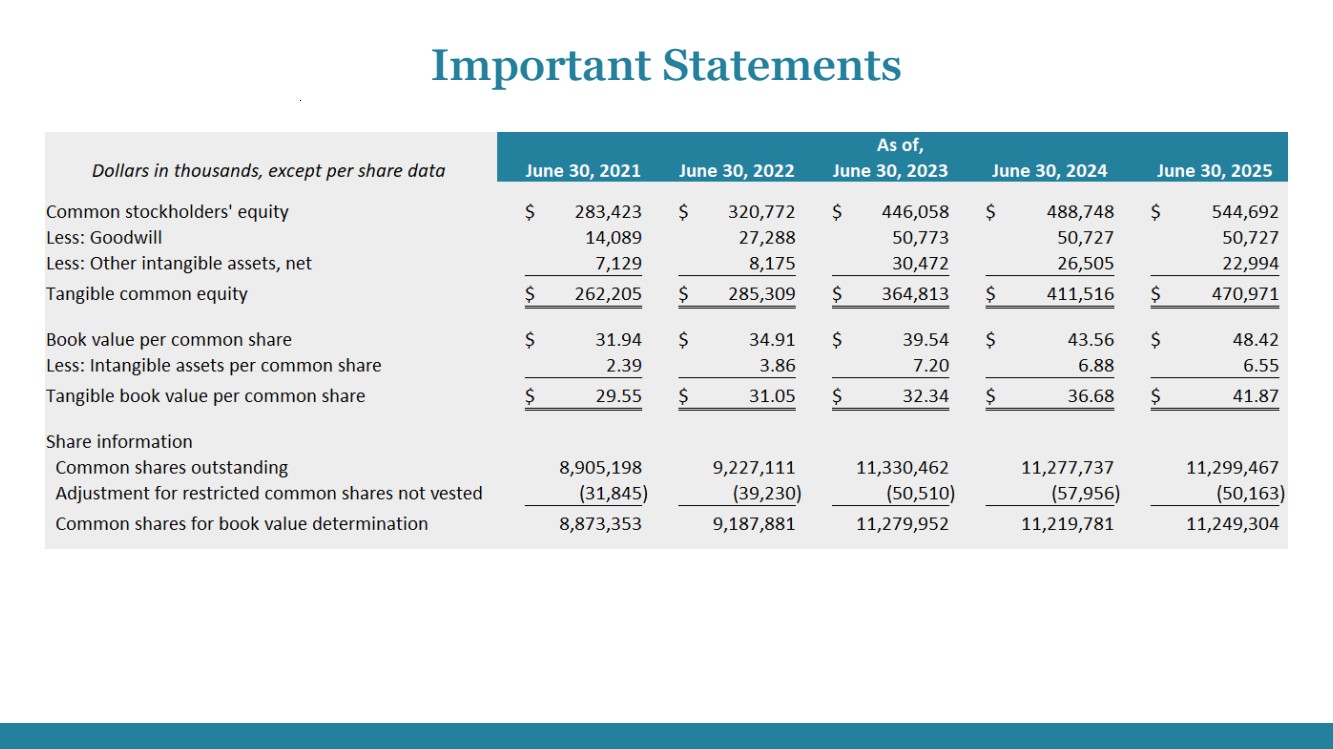
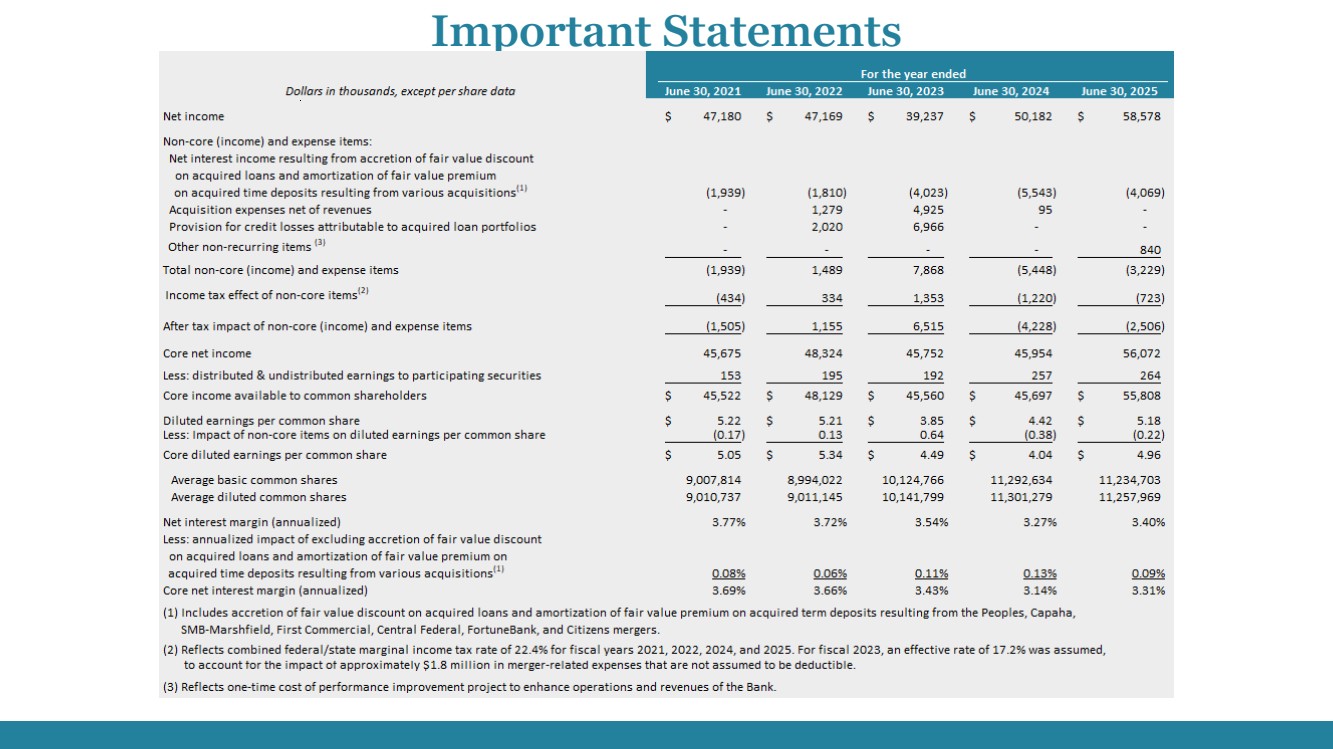
| Financial Data Financial information presented as of and for the fourth quarter and fiscal year ended June 30, 2025, is provided on a preliminary basis and is unaudited. Non-GAAP Financial Measures Tangible common equity, tangible book value per common share, core diluted earnings per common share, and core net interest margin are financial measures determined by methods other than in accordance with accounting principles generally accepted in the United States (GAAP). These non-GAAP financial measures are supplemental and not a substitute for an analysis based on GAAP measures. As other companies may use different calculations for these measures, this presentation may not be comparable to other similarly titled measures used by other companies. We calculate tangible common equity by excluding the balance of intangible assets from common stockholders’ equity. We calculate tangible book value per common share by dividing tangible common equity by common shares outstanding, less restricted common shares not vested, as compared to book value per common share, which we calculate by dividing common stockholders’ equity by common shares outstanding, less restricted common shares not vested. We believe that this is consistent with the treatment by bank regulatory agencies, which generally exclude intangible assets from the calculation of risk-based capital ratios. We calculate core diluted earnings per common share by excluding from net interest income the accretion of fair value discount on the acquired loan portfolio and amortization of fair value premium on the acquired time deposit portfolio resulting from the fiscal 2015 Peoples acquisition, the fiscal 2017 Capaha acquisition, the fiscal 2018 SMB-Marshfield acquisition, the fiscal 2019 the First Commercial acquisition, the fiscal 2020 Central acquisition, the fiscal 2022 FortuneBank acquisition, and the fiscal 2023 Citizens acquisition. We also exclude from noninterest expense the acquisition expenses we incurred during fiscal years 2020, 2022, 2023 and 2024 year to date resulting from the acquisitions we undertook during those periods. We believe that core diluted earnings per common share is useful in assessing our core operating performance, particularly when comparing periods or when comparing our operating performance to the operating performance of our industry peers. We calculate core net interest margin by excluding from net interest income the accretion of fair value discount on the acquired loan portfolio and amortization of fair value premium on the acquired time deposit portfolio resulting from the Peoples acquisition, the Capaha acquisition, the SMB-Marshfield acquisition, the First Commercial acquisition, the Central acquisition, the FortuneBank acquisition, and the Citizens acquisition. We believe that each of these non-GAAP financial measures provides information that is important to investors and that is useful in understanding our capital position and ratios. Reconciliations of the non-GAAP measures of tangible common equity, tangible book value per common share, core diluted earnings per common share, and core net interest margin to the GAAP measures of common stockholders’ equity, book value per common share, diluted earnings per common share, and net interest margin are set forth below. Important Statements |
| Important Statements |
| Important Statements |
| Stefan Chkautovich Executive Vice President and Chief Financial Officer Matt Funke President and Chief Administrative Officer Greg Steffens Chairman and Chief Executive Officer |