The Fund acquired all of the assets and liabilities of Centerstone Investors Fund, a series of Centerstone Investment Trust, (the “Predecessor Fund”) in a tax-free reorganization on March 5, 2021. In connection with this acquisition, shares of the Predecessor Fund’s Class A, Class C and Class I Shares were exchanged for Class A, Class C and Class I Shares of the Fund, respectively. The Predecessor Fund had an investment objective and strategies that were, in all material respects, the same as those of the Fund, and was managed in a manner that, in all material respects, complied with the investment guidelines and restrictions of the Fund. The Fund is a continuation of the Predecessor Fund, and therefore, the performance information for the period prior to the reorganization is that of the Predecessor Fund.
The
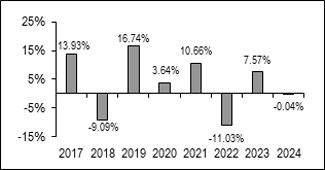
bar chart and performance table below show the variability of the Predecessor Fund’s returns, which may be an indication of the
risks of investing in the Fund. The bar chart shows performance of the Fund’s Class I shares for each full calendar year since
the Predecessor Fund’s inception. After tax returns for Class A and Class C shares, which are not presented, will vary from the
returns of Class I shares. The performance table compares the performance of the Fund over time to the performance of a broad-based securities
market index. You should be aware that the Predecessor Fund’s past performance (before and after taxes) may not be an indication
of how the Fund will perform in the future. Shareholder reports containing financial and performance information are delivered to shareholders
semi-annually. Updated performance information is available at no cost by calling the Fund toll-free at 877.314.9006.
Best
Quarter: 2nd Quarter 2020 16.88%
Worst Quarter: 1st Quarter 2020 (26.33)%
The year-to-date return as of the most recent fiscal quarter, which ended June 30, 2025, was 15.94%.
| One Year | Five Years | Since
Inception of the Predecessor Fund (05-03-2016) | |
| Class I Return before taxes | (0.04)% | 1.87% | 3.74% |
| Class I Return after taxes on distributions | (0.58)% | 1.62% | 3.36% |
| Class I Return after taxes on distributions and sale of Fund shares | 0.38% | 1.55% | 2.95% |
| Class A Return with sales charge before taxes | (5.28)% | 0.60% | 2.87% |
| Class C Return before taxes | (1.02)% | 0.87% | 2.76% |
| MSCI
ACWI Index (reflects no deduction for fees, expenses or taxes)(1) |
17.49% | 10.06% | 10.93% |
| (1) | The MSCI ACWI Index is a free float-adjusted market capitalization weighted index that is designed to measure the equity market performance of developed and emerging markets. The index is not available for direct investment. |
After-tax
returns are calculated using the highest historical individual federal marginal income tax rate and do not reflect the impact of state
and local taxes. Actual after-tax returns depend on a shareholder’s tax situation and may differ from those shown. The after-tax
returns are not relevant if you hold your Fund shares in tax-deferred arrangements, such as 401(k) plans or individual retirement accounts
(“IRA”).